. 2023 Jul 15;14(1):4227.
doi: 10.1038/s41467-023-40000-x.

HIV-1 promotes ubiquitination of the amyloidogenic C-terminal fragment of APP to support viral replication

Affiliations

HIV-1 promotes ubiquitination of the amyloidogenic C-terminal fragment of APP to support viral replication

Feng Gu et al. Nat Commun. .

Abstract

HIV-1 replication in macrophages and microglia involves intracellular assembly and budding into modified subsets of multivesicular bodies (MVBs), which support both viral persistence and spread. However, the cellular factors that regulate HIV-1's vesicular replication remain poorly understood. Recently, amyloid precursor protein (APP) was identified as an inhibitor of HIV-1 replication in macrophages and microglia via an unknown mechanism. Here, we show that entry of HIV-1 Gag into MVBs is blocked by the amyloidogenic C-terminal fragment of APP, "C99", but not by the non-amyloidogenic product, "C83". To counter this, Gag promotes multi-site ubiquitination of C99 which controls both exocytic sorting of MVBs and further processing of C99 into toxic amyloids. Processing of C99, entry of Gag into MVBs and release of infectious virus could be suppressed by expressing ubiquitination-defective C99 or by γ-secretase inhibitor treatment, suggesting that APP's amyloidogenic pathway functions to sense and suppress HIV-1 replication in macrophages and microglia.


Conflict of interest statement

The authors declare no conflict of interest.

Figures
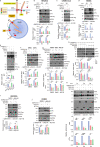
Fig. 1
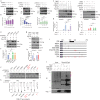
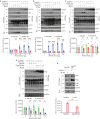
Fig. 1. HIV-1 Gag increases processing of APP and CTFs.
a APP processing pathways. During non-amyloidogenic processing APP is cleaved at the plasma membrane by α-secretase to produce external sAPPα and C83, followed by γ-secretase resulting in p3 and AICD fragments. During amyloidogenic processing APP is endocytosed and trafficked to late endosomes/multivesicular bodies (MVBs), where it is cleaved by β-secretase to produce sAPPβ and C99, followed by γ-secretase cleavage into Aβ42 and AICD. Transfection of HEK293A (b) or infection of CHME3 4 × 4 (c) or MDMs (d) with HIV-1 pNL4.3 or JR-CSF downregulates APP and CTFs at the indicated days post transfection (d.p.t) or infection (d.p.i). e pNL4.3, but not pNL4.3 containing point mutations in MA domain (85YG and 87VE), results in a reduction in both APP and CTFs in transfected HEK293A cells. L.E., long exposure; S.E., short exposure. Bafilomycin A1 (BafA1) or MG132, but not DMSO control treatment prevents APP and CTF downregulation by transfected pNL4.3 or JR-CSF (f) or HA-tagged Gag (Gag-HA) or Nicastrin (NCT-HA) (g) in HEK293A cells. h Increasing amount of Gag-HA, but not GAPDH-HA, results in a reduction in both APP and CTFs in transfected HEK293A cells treated with cycloheximide (CHX). GSI L685,458 inhibits both basal CTF turnover in untransfected cells and accelerated turnover in Gag-HA- or NCT-HA-transfected HEK293A (i) or CHME3 (j) cells. k Timecourse transfection of HEK293A cells with Gag-HA or NCT-HA, but not with the control GAPDH-HA, reduces the levels of APP and CTF at the indicated d.p.t. Quantification of the protein levels from 3 independent replicates is presented below each panel shown in b–k. Data is presented as mean, SEM using one-way ANOVA with Tukey’s multiple comparisons test (in b, c, f, g, j, and k), two-way ANOVA with Sidak’s multiple comparisons test (in d, h APP graph) or Dunnett’s multiple comparisons test (in h CTFs graph); two tailed one sample t test (in e); unpaired two tailed t test with Welch’s correction (in i). *p < 0.05, **p < 0.01, ***p < 0.001, ****p < 0.0001, ns: not significant. Source data are provided as a Source Data file.
Fig. 2
Fig. 2. HIV-1 ubiquitinates and degrades C99, but not C83.
a Transfection of HIV-1 JR-CSF reduces Flag-C99, but not Flag-C83 or GAPDH-HA in HEK293A cells. b Densitometry analysis of effects in (a) from 3 independent replicates. c Ubiquitination inhibitor TAK-243 stabilizes exogenous Flag-C99 but not C83-V5 in HEK293A cells transfected with either empty vector control (pcDNA3.1) or JR-CSF. d Densitometry analysis of effects in c from 3 independent replicates. e MG132 and TAK-243, but not DMSO control, stabilizes exogenous Flag-C99 in HEK293A cells transfected with JR-CSF. f Densitometry analysis of effects in (e) from 3 independent replicates. g Ubiquitin-activating enzyme E1 (UBE1) specific siRNA, but not negative control siRNA (NC2), suppresses downregulation of exogenous Flag-C99 in JR-CSF transfected HEK293A cells. h Densitometry analysis of effects in (g) from 3 independent replicates. i Schematic of N-terminally Flag-tagged WT or mutant C99 constructs used in (j). K: Lysine; A. Alanine. Each mutation site at the corresponding amino acid is represented by X. WB (j) and densitometry analysis (k) of effects of single or combined lysine-alanine (K-A) mutations on Flag-C99 stability in control pcDNA3.1 or JR-CSF transfected HEK293A cells. Complete stabilization mirroring TAK-243 treatment occurs in the C99-7KA mutant. l Representative (n = 3) anti-Flag IP showing ubiquitination of Flag-C99 but not Flag-C99-7KA mutant in lysates from HEK293A transfected with JR-CSF. Red arrows highlight ubiquitinated bands. Quantification of the protein levels from 3 independent replicates is presented in b, d, f, h, k. Data is presented as mean, SEM. b one-way ANOVA with Tukey’s multiple comparisons test; d unpaired two-tailed t test with Welch’s correction; f unpaired two-tailed t test with Welch’s correction; h and k: two-way ANOVA with Sidak’s multiple comparisons test. *p < 0.05, **p < 0.01, ***p < 0.001, ****p < 0.0001, ns: not significant. Source data are provided as a Source Data file.
Fig. 3
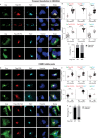
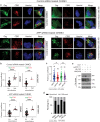
Fig. 3. Preventing C99 ubiquitination suppresses HIV-1 Gag entry into Rab7-positive vesicles.
JR-CSF-transfected HEK293A (a–c) or CHME3 (d–f) cells transiently or stably expressing Flag-C99 WT or Flag-C99-7KA mutant, respectively. Cells were fixed and stained for Gag, Flag and Rab7, detecting nuclei using Hoechst. Representative images of cells expressing Flag-C99 or Flag-C99-7KA in HEK293A at 48 h (a) or in CHME3 at 24 h (d) post-transfection. Quantification of the colocalization of Gag and C99, C99 and Rab7, or Gag and Rab7 under each condition in HEK293A (b) or CHME3 (e) cells determined by Pearson’s Correlation Coefficient. Data is presented as mean with SEM using two-tailed one sample Wilcoxon test with hypothetical value 0.50 (Flag-C99/Rab7, Flag-C99-7KA/Rab7 in b; Flag-C99-7KA/Rab7 in e or unpaired two-tailed t test for the remaining graphs, **p < 0.01, ****p < 0.0001. Number of cells analyzed is indicated. Quantification of HEK293A (c) or CHME3 (f) cells exhibiting typical punctate/speckled versus diffuse Gag distribution patterns. Number of cells analyzed is indicated. Source data are provided as a Source Data file.
Fig. 4
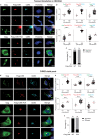
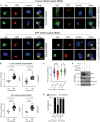
Fig. 4. Preventing C99 ubiquitination suppresses HIV-1 Gag entry into CD63-positive vesicles.
JR-CSF-transfected HEK293A (a–c) or CHME3 (d–f) cells transiently or stably expressing Flag-C99 WT or Flag-C99-7KA mutant, respectively. Cells were fixed and stained for Gag, Flag and CD63, detecting nuclei using Hoechst. Representative images of cells expressing Flag-C99 WT or Flag-C99-7KA mutant in HEK293A at 48 h (a) or in CHME3 at 24 h (d) post-transfection. Quantification of the colocalization of Gag and C99, C99 and CD63, or Gag and CD63 under each condition in HEK293A (b) or CHME3 (e) cells determined by Pearson’s Correlation Coefficient. Data is presented as mean with SEM using unpaired two-tailed t test (Gag/Flag-C99 and paired Gag/CD63, Gag/Flag-C99-7KA and paired Gag/CD63 in b; Gag/Flag-C99, Gag/Flag-C99-7KA, Flag-C99-7KA/CD63 and paired Gag/CD63 in e) or unpaired two-tailed t test with Welch’s correction (Flag-C99/CD63 and paired Gag/CD63 in e) or two-tailed Mann–Whitney test (Flag-C99/CD63 in b) or two-tailed one sample Wilcoxon test with hypothetical value 0.50 (Flag-C99-7KA/CD63 in b)**p < 0.01, ****p < 0.0001. Number of cells analyzed is indicated. Quantification of HEK293A (c) or CHME3 (f) cells exhibiting typical punctate/speckled versus diffuse Gag distribution patterns. Number of cells analyzed is indicated. Source data are provided as a Source Data file.
Fig. 5
Fig. 5. Preventing C99 ubiquitination suppresses HIV-1 Gag entry into CD63-positive vesicles in primary human macrophages.
a–c MDMs stably expressing Flag-C99 WT or Flag-C99-7KA mutant were infected with JR-CSF-derived HIV-1. 5 days post infection cells were fixed and stained for Gag, Flag and CD63, detecting nuclei using Hoechst. a Representative images of MDMs expressing Flag-C99 WT or Flag-C99-7KA mutant are shown. b Quantification of the colocalization of Gag and C99, C99 and CD63, or Gag and CD63 under each condition determined by Pearson’s Correlation Coefficient; mean with SEM using unpaired two-tailed t test, ****p < 0.0001. Number of cells analyzed is indicated. c Quantification of cells exhibiting typical punctate/speckled versus diffuse Gag distribution patterns. Number of cells analyzed is indicated. Source data are provided as a Source Data file.
Fig. 6
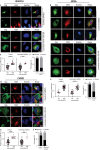
Fig. 6. Preventing endogenous APP processing limits HIV-1 Gag entry into MVBs.
HEK293A (ac) or CHME3 (df) cells transfected with JR-CSF were treated with DMSO control or γ-secretase inhibitor L685,458 at 4 h post-transfection. 24 h post-transfection, cells were fixed and stained for Gag and Rab7, detecting nuclei using Hoechst. a, d Representative images of cells treated with DMSO control or L685,458. b, e Quantification of the colocalization of Gag and Rab7 at 24 h using Pearson’s Correlation Coefficient; c, f Quantification of cells exhibiting typical punctate/speckled versus diffuse Gag distribution patterns. Number of cells analyzed in b, c, e and f are indicated. g–i MDMs infected with JR-CSF-derived HIV-1 were treated with DMSO control or L685,458 at 24 h post-infection. 5 days post-infection, cells were fixed and stained for Gag and CD63, detecting nuclei using Hoechst. g Representative images of cells treated with DMSO control or L-685,458. h, i Quantification of the colocalization of Gag and CD63 at 5 days using Pearson’s Correlation Coefficient. Data is presented as mean with SEM using unpaired two-tailed t test (b, γ-secretase inhibitor treatment graph in e, h, or unpaired two-tailed t test with Welch’s correction (control graph in e). ***p < 0.001, ****p < 0.0001. Source data are provided as a Source Data file.
Fig. 7
Fig. 7. The block to HIV-1 Gag entry into CD63-positive MVBs mediated by γ-secretase inhibition requires APP in CHME3 cells.
CHME3 cells treated with control (a) (upper panels) or APP (a) (lower panels) siRNAs were transfected with JR-CSF followed by treatment with DMSO control or γ-secretase inhibitor L685,458 4 h post-transfection. 24 h post-transfection, cells were fixed and stained for Gag, CD63, detecting nuclei using Hoechst. a Representative images of cells treated with DMSO control (left hand side panels) or L685,458 (right hand side panels). b, c Quantification of the colocalization of Gag and CD63 under each condition determined by Pearson’s Correlation Coefficient; mean with SEM using unpaired two-tailed t test with Welch’s correction (APP siRNA and DMSO treated graph in b, control siRNA treated graph in c) or unpaired two-tailed t test for the remaining graphs, *p < 0.05, ***p < 0.001, ****p < 0.0001, ns: not significant. Number of cells analyzed is indicated. Panel (c) shows the combined high and low data analysis from b. d Quantification of cells exhibiting typical punctate/speckled versus diffuse Gag distribution patterns. Number of cells analyzed is indicated. e Representative (n = 3) WB confirmation of APP and Pr55 Gag levels in samples from a. Source data are provided as a Source Data file.
Fig. 8
Fig. 8. The block to HIV-1 Gag entry into CD63-positive MVBs mediated by γ-secretase inhibition requires APP in primary human macrophages.
MDMs treated with control ((a) upper panels) or APP ((a) lower panels) siRNAs were infected with JR-CSF-derived HIV-1 followed by treatment with DMSO control or γ-secretase inhibitor L685,458 4 h post-transfection. 24 h post-transfections, cells were fixed and stained for Gag, CD63, detecting nuclei using Hoechst. a Representative images of cells treated with DMSO control (left hand side panels) or L685,458 (right hand side panels). b, c Quantification of the colocalization of Gag and CD63 under each condition determined by Pearson’s Correlation Coefficient; mean with SEM using unpaired two-tailed t test with Welch’s correction (control siRNA and DMSO treated graph in b) or unpaired two-tailed t test for the remaining graphs, ****p < 0.0001, ns: not significant. Number of cells analyzed is indicated. Panel (c) shows the combined high and low data analysis from b. d Quantification of cells exhibiting typical punctate/speckled versus diffuse Gag distribution patterns. Number of cells analyzed is indicated. e Representative (n = 3) WB confirmation of APP and Pr55 Gag levels in samples from a. Source data are provided as a Source Data file.
Fig. 9
Fig. 9. Ubiquitination-defective C99 suppresses the production of infectious HIV-1 particles.
Representative WB analysis showing increasing expression of Flag-C83, but not control GAPDH-HA, increases production of extracellular HIV-1 particles in HEK293A transfected with pNL4.3 (a) or JR-CSF (b). S.E., short exposure; L.E., long exposure. Note that full-length Pr55 Gag signals become saturated and therefore appear the same in long exposures needed to detect p24 CA. c Representative WB analysis showing increasing expression of Flag-C99 or control GAPDH-HA does not affect pNL4.3 virion release in HEK293A cells. d Representative WB analysis showing increasing amounts of stabilized Flag-C99-7KA mutant, but not Flag-C99, results in a dose-dependent inhibition of infectious virus release from HEK293A cells transfected with JR-CSF (note, p24 CA drops to background levels of uninfected cells at the highest C99-7KA concentration). e Representative WB analysis showing expression of Flag-C99-7KA decreases extracellular HIV-1 particles in CHME3 cells infected with JR-CSF. a–e lower panels: Infectious virus in supernatants measured using TZM-bl indicator cells. n = 4 (a), n = 3 (b–e) shown as mean, SEM; two-way ANOVA Sidak’s multiple comparisons test, *p < 0.05, **p < 0.01, ***p < 0.001, ****p < 0.0001, ns: not significant. Source data are provided as a Source Data file.
Fig. 10
Fig. 10. Model for how Gag and C99 compete for control of vesicular sorting pathways.
During amyloidogenic processing of APP, ubiquitination (Ub) of the C-terminal C99 domain regulates invagination into and sorting of MVBs to lysosomes by engaging the VPS machinery. HIV-1 Gag, which comprises of four main structural domains: matrix (MA), capsid (CA), nucleocapsid (NC) and p6, uses a similar strategy to bud into and control sorting of MVBs to exocytic pathways, establishing a competition for control of MVBs using shared and distinct host factors. INSET: The “7-KA” mutant of C99 acts as a dominant-negative that makes MVBs inaccessible to Gag.

Similar articles

Cited by

References

    1. Killingsworth L, Spudich S. Neuropathogenesis of HIV-1: insights from across the spectrum of acute through long-term treated infection. Semin Immunopathol. 2022;44:709–724. doi: 10.1007/s00281-022-00953-5. - DOI - PMC - PubMed
    1. Martin-Serrano J, Zang T, Bieniasz PD. Role of ESCRT-I in retroviral budding. J. Virol. 2003;77:4794–4804. doi: 10.1128/JVI.77.8.4794-4804.2003. - DOI - PMC - PubMed
    1. Morita E, et al. ESCRT-III protein requirements for HIV-1 budding. Cell Host Microbe. 2011;9:235–242. doi: 10.1016/j.chom.2011.02.004. - DOI - PMC - PubMed
    1. Freed EO. HIV-1 assembly, release and maturation. Nat. Rev. Microbiol. 2015;13:484–496. doi: 10.1038/nrmicro3490. - DOI - PMC - PubMed
    1. Graziano F, Vicenzi E, Poli G. The ATP/P2X7 axis in human immunodeficiency virus infection of macrophages. Curr. Opin. Pharm. 2019;47:46–52. doi: 10.1016/j.coph.2019.02.006. - DOI - PubMed

Publication types

MeSH terms

Substances