

A single-cell atlas of bovine skeletal muscle reveals mechanisms regulating intramuscular adipogenesis and fibrogenesis
- PMID: 37439037
- PMCID: PMC10570087
- DOI: 10.1002/jcsm.13292
A single-cell atlas of bovine skeletal muscle reveals mechanisms regulating intramuscular adipogenesis and fibrogenesis
Abstract
Background: Intramuscular fat (IMF) and intramuscular connective tissue (IMC) are often seen in human myopathies and are central to beef quality. The mechanisms regulating their accumulation remain poorly understood. Here, we explored the possibility of using beef cattle as a novel model for mechanistic studies of intramuscular adipogenesis and fibrogenesis.
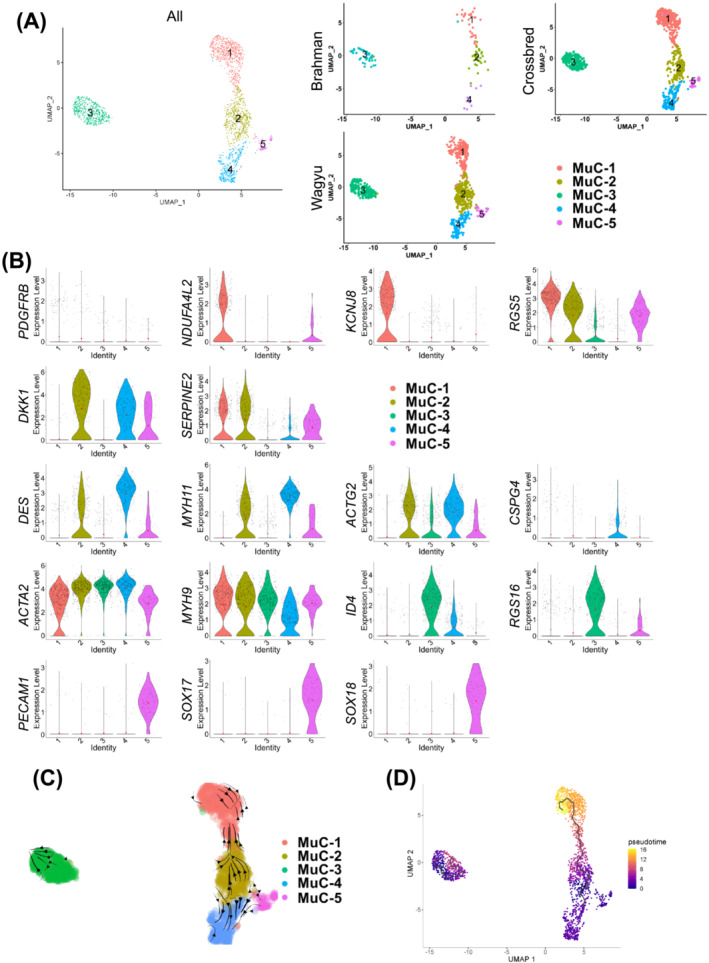
Methods: Skeletal muscle single-cell RNAseq was performed on three cattle breeds, including Wagyu (high IMF), Brahman (abundant IMC but scarce IMF), and Wagyu/Brahman cross. Sophisticated bioinformatics analyses, including clustering analysis, gene set enrichment analyses, gene regulatory network construction, RNA velocity, pseudotime analysis, and cell-cell communication analysis, were performed to elucidate heterogeneities and differentiation processes of individual cell types and differences between cattle breeds. Experiments were conducted to validate the function and specificity of identified key regulatory and marker genes. Integrated analysis with multiple published human and non-human primate datasets was performed to identify common mechanisms.
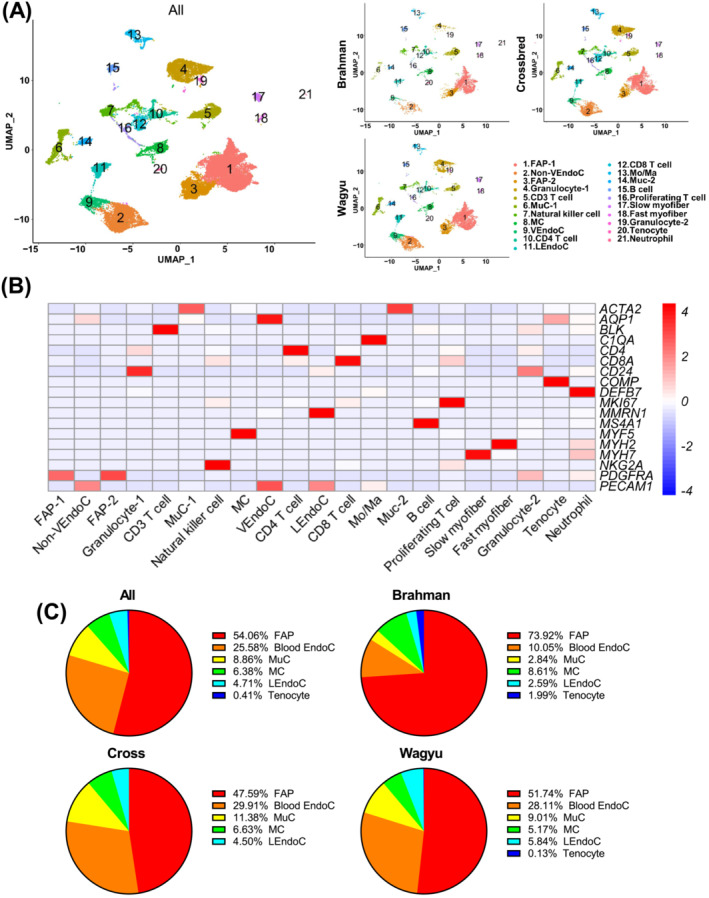
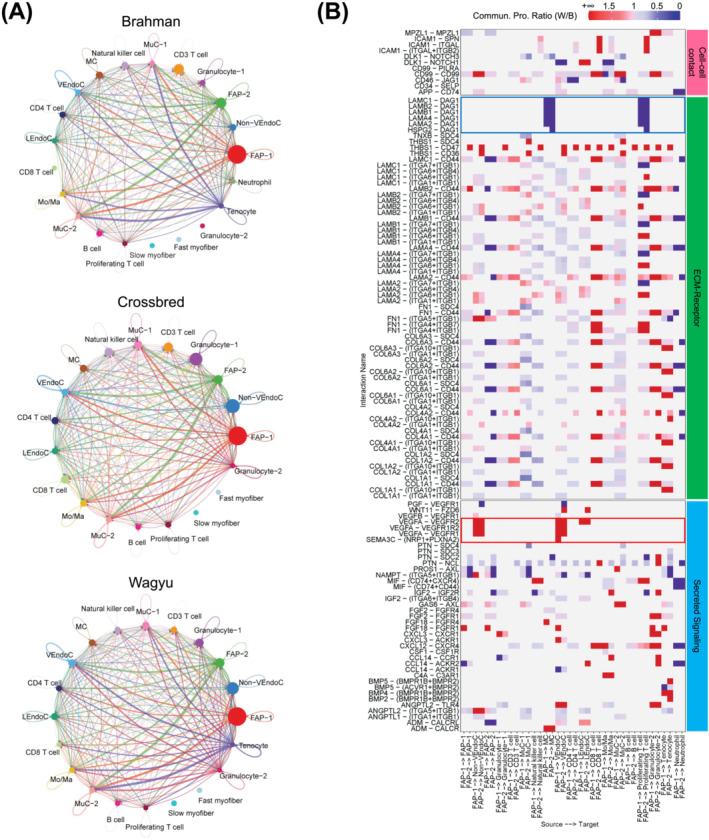
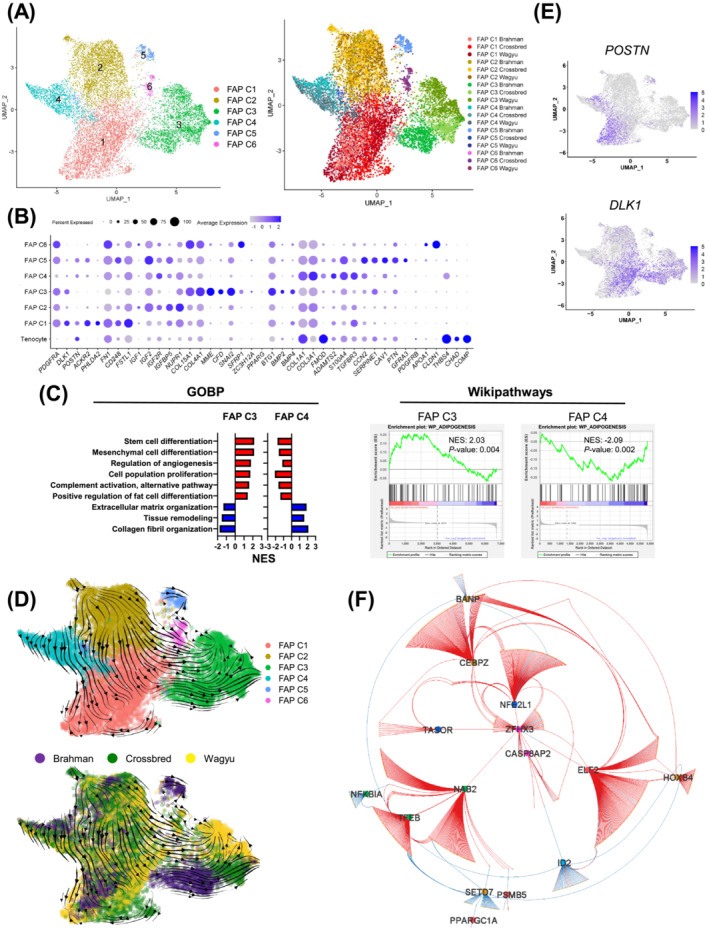
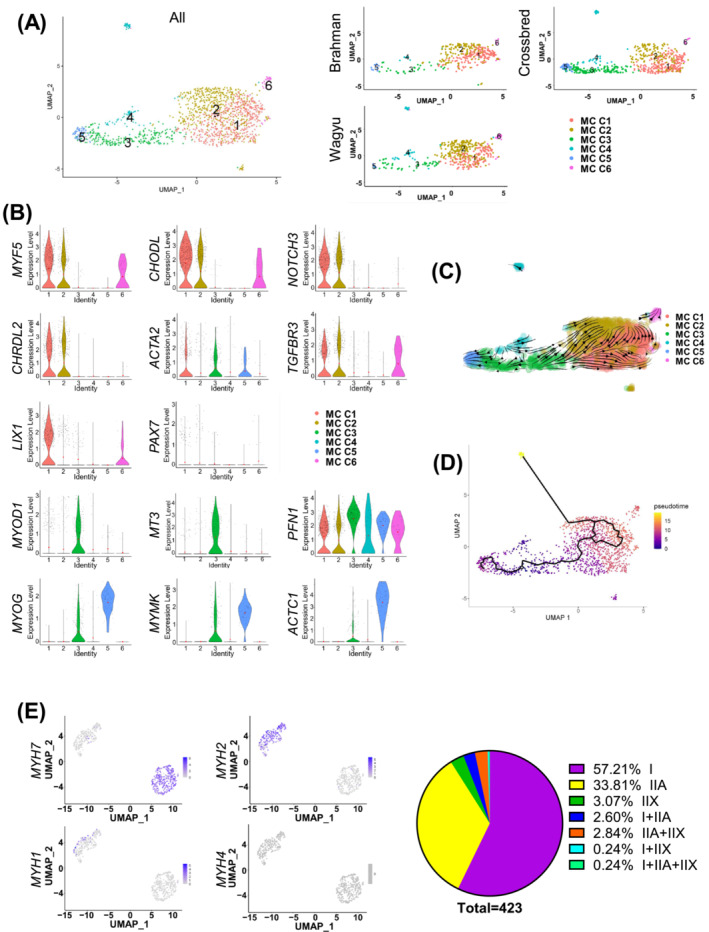
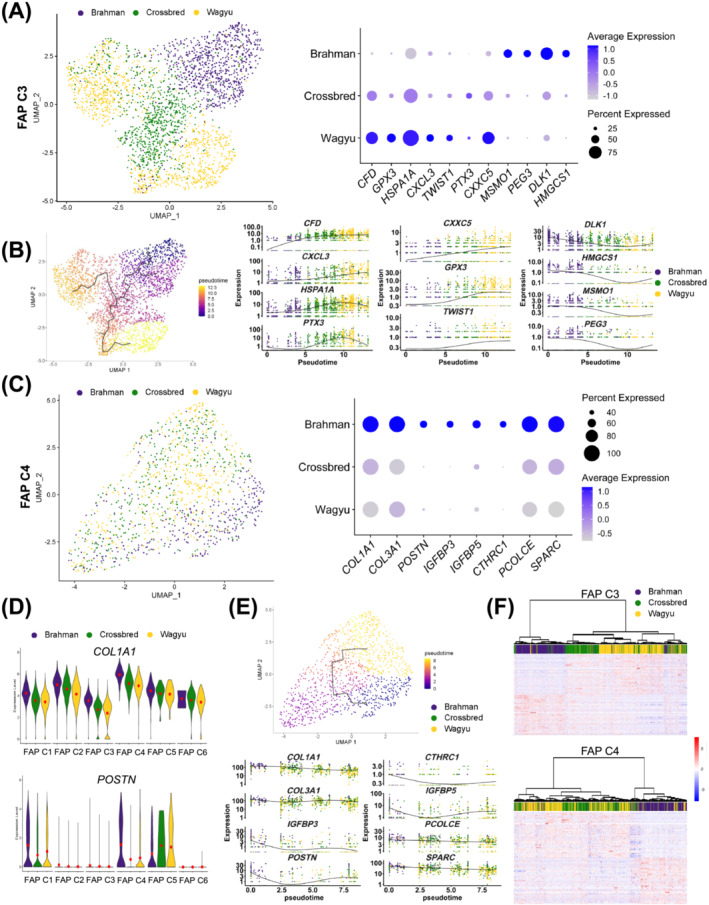
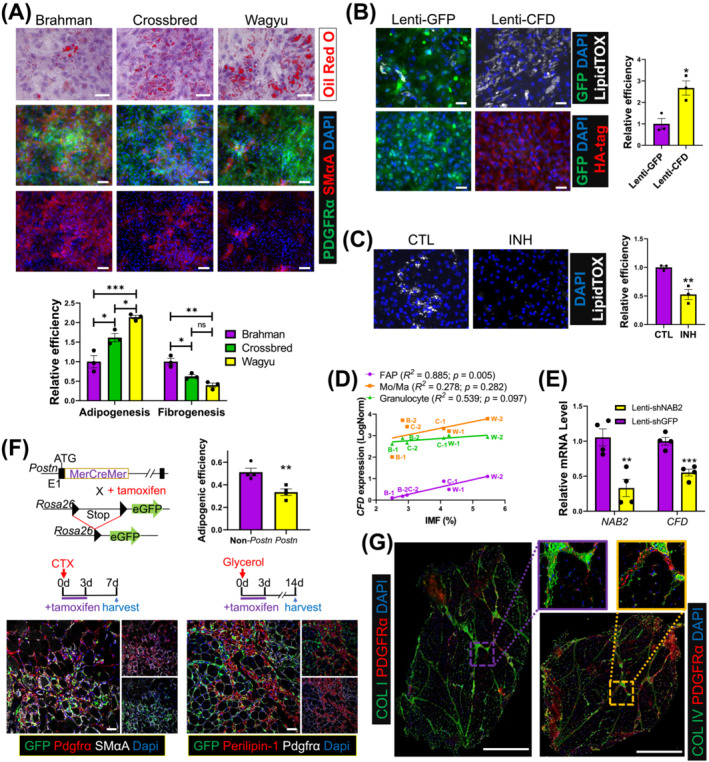
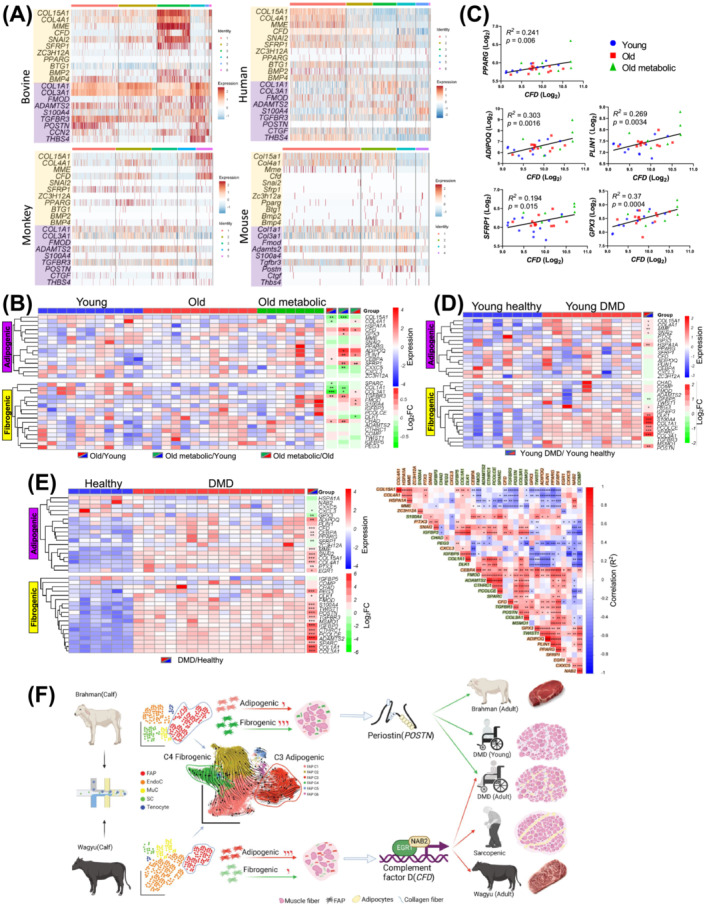
Results: A total of 32 708 cells and 21 clusters were identified, including fibro/adipogenic progenitor (FAP) and other resident and infiltrating cell types. We identified an endomysial adipogenic FAP subpopulation enriched for COL4A1 and CFD (log2FC = 3.19 and 1.92, respectively; P < 0.0001) and a perimysial fibrogenic FAP subpopulation enriched for COL1A1 and POSTN (log2FC = 1.83 and 0.87, respectively; P < 0.0001), both of which were likely derived from an unspecified subpopulation. Further analysis revealed more progressed adipogenic programming of Wagyu FAPs and more advanced fibrogenic programming of Brahman FAPs. Mechanistically, NAB2 drives CFD expression, which in turn promotes adipogenesis. CFD expression in FAPs of young cattle before the onset of intramuscular adipogenesis was predictive of IMF contents in adulthood (R2 = 0.885, P < 0.01). Similar adipogenic and fibrogenic FAPs were identified in humans and monkeys. In aged humans with metabolic syndrome and progressed Duchenne muscular dystrophy (DMD) patients, increased CFD expression was observed (P < 0.05 and P < 0.0001, respectively), which was positively correlated with adipogenic marker expression, including ADIPOQ (R2 = 0.303, P < 0.01; and R2 = 0.348, P < 0.01, respectively). The specificity of Postn/POSTN as a fibrogenic FAP marker was validated using a lineage-tracing mouse line. POSTN expression was elevated in Brahman FAPs (P < 0.0001) and DMD patients (P < 0.01) but not in aged humans. Strong interactions between vascular cells and FAPs were also identified.
Conclusions: Our study demonstrates the feasibility of beef cattle as a model for studying IMF and IMC. We illustrate the FAP programming during intramuscular adipogenesis and fibrogenesis and reveal the reliability of CFD as a predictor and biomarker of IMF accumulation in cattle and humans.
Keywords: Adipogenesis; Fibro/adipogenic progenitor; Fibrogenesis; Intramuscular adipose tissue; Single-cell RNAseq.
© 2023 The Authors. Journal of Cachexia, Sarcopenia and Muscle published by John Wiley & Sons Ltd on behalf of Society on Sarcopenia, Cachexia and Wasting Disorders.
Conflict of interest statement
The authors declare no conflict of interests.
Figures
Similar articles
-
Control of Muscle Fibro-Adipogenic Progenitors by Myogenic Lineage is Altered in Aging and Duchenne Muscular Dystrophy.Cell Physiol Biochem. 2019;53(6):1029-1045. doi: 10.33594/000000196. Cell Physiol Biochem. 2019. PMID: 31865646
-
The Role of Matrix Metalloproteinase-13 (MMP13) in TGFβ/BMP Pathway Regulation of Fibro-Adipogenic Progenitor (FAP) Differentiation.Cell Physiol Biochem. 2022 Dec 20;56(6):730-743. doi: 10.33594/000000596. Cell Physiol Biochem. 2022. PMID: 36537139
-
IL-1β- and IL-4-polarized macrophages have opposite effects on adipogenesis of intramuscular fibro-adipogenic progenitors in humans.Sci Rep. 2018 Nov 19;8(1):17005. doi: 10.1038/s41598-018-35429-w. Sci Rep. 2018. PMID: 30451963 Free PMC article.
-
Signaling pathways regulating the fate of fibro/adipogenic progenitors (FAPs) in skeletal muscle regeneration and disease.FEBS J. 2022 Nov;289(21):6484-6517. doi: 10.1111/febs.16080. Epub 2021 Jul 6. FEBS J. 2022. PMID: 34143565 Review.
-
Meat Science and Muscle Biology Symposium: manipulating mesenchymal progenitor cell differentiation to optimize performance and carcass value of beef cattle.J Anim Sci. 2013 Mar;91(3):1419-27. doi: 10.2527/jas.2012-5670. Epub 2012 Oct 16. J Anim Sci. 2013. PMID: 23100595 Review.
Cited by
-
Detection and characterization of copy number variation in three differentially-selected Nellore cattle populations.Front Genet. 2024 Apr 17;15:1377130. doi: 10.3389/fgene.2024.1377130. eCollection 2024. Front Genet. 2024. PMID: 38694873 Free PMC article.
-
Single-Cell Sequencing Technology in Ruminant Livestock: Challenges and Opportunities.Curr Issues Mol Biol. 2024 May 27;46(6):5291-5306. doi: 10.3390/cimb46060316. Curr Issues Mol Biol. 2024. PMID: 38920988 Free PMC article. Review.
-
Unraveling the genetic and epigenetic landscape governing intramuscular fat deposition in rabbits: Insights and implications.Food Chem (Oxf). 2024 Aug 30;9:100222. doi: 10.1016/j.fochms.2024.100222. eCollection 2024 Dec 30. Food Chem (Oxf). 2024. PMID: 39290671 Free PMC article. Review.
-
Identification of porcine fast/slow myogenic exosomes and their regulatory effects on lipid accumulation in intramuscular adipocytes.J Anim Sci Biotechnol. 2024 Jun 2;15(1):73. doi: 10.1186/s40104-024-01029-0. J Anim Sci Biotechnol. 2024. PMID: 38824596 Free PMC article.
-
Self-organization of vascularized skeletal muscle from bovine embryonic stem cells.bioRxiv [Preprint]. 2024 Mar 25:2024.03.22.586252. doi: 10.1101/2024.03.22.586252. bioRxiv. 2024. PMID: 38585777 Free PMC article. Preprint.
References
-
- Li W, Zheng Y, Zhang W, Wang Z, Xiao J, Yuan Y. Progression and variation of fatty infiltration of the thigh muscles in Duchenne muscular dystrophy, a muscle magnetic resonance imaging study. Neuromuscul Disord 2015;25:375–380. - PubMed
-
- Dubost A, Micol D, Picard B, Lethias C, Andueza D, Bauchart D, et al. Structural and biochemical characteristics of bovine intramuscular connective tissue and beef quality. Meat Sci 2013;95:555–561. - PubMed
Publication types
MeSH terms
Grants and funding
LinkOut - more resources
Full Text Sources
Molecular Biology Databases
Research Materials
Miscellaneous
