In silico-in vitro modeling to uncover cues involved in establishing microglia identity: TGF-β3 and laminin can drive microglia signature gene expression
- PMID: 37435046
- PMCID: PMC10330817
- DOI: 10.3389/fncel.2023.1178504
In silico-in vitro modeling to uncover cues involved in establishing microglia identity: TGF-β3 and laminin can drive microglia signature gene expression
Abstract
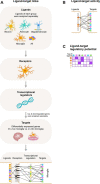
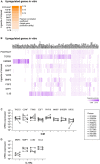
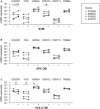
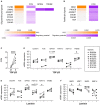
Microglia are the resident macrophages of the central nervous system (CNS) and play a key role in CNS development, homeostasis, and disease. Good in vitro models are indispensable to study their cellular biology, and although much progress has been made, in vitro cultures of primary microglia still only partially recapitulate the transcriptome of in vivo microglia. In this study, we explored a combination of in silico and in vitro methodologies to gain insight into cues that are involved in the induction or maintenance of the ex vivo microglia reference transcriptome. First, we used the in silico tool NicheNet to investigate which (CNS-derived) cues could underlie the differences between the transcriptomes of ex vivo and in vitro microglia. Modeling on basis of gene products that were found to be upregulated in vitro, predicted that high mobility group box 2 (HMGB2)- and interleukin (IL)-1β-associated signaling pathways were driving their expression. Modeling on basis of gene products that were found to be downregulated in vitro, did not lead to predictions on the involvement of specific signaling pathways. This is consistent with the idea that in vivo microenvironmental cues that determine microglial identity are for most part of inhibitory nature. In a second approach, primary microglia were exposed to conditioned medium from different CNS cell types. Conditioned medium from spheres composed of microglia, oligodendrocytes, and radial glia, increased the mRNA expression levels of the microglia signature gene P2RY12. NicheNet analyses of ligands expressed by oligodendrocytes and radial glia predicted transforming growth factor beta 3 (TGF-β3) and LAMA2 as drivers of microglia signature gene expression. In a third approach, we exposed microglia to TGF-β3 and laminin. In vitro exposure to TGF-β3 increased the mRNA expression levels of the microglia signature gene TREM2. Microglia cultured on laminin-coated substrates were characterized by reduced mRNA expression levels of extracellular matrix-associated genes MMP3 and MMP7, and by increased mRNA expression levels of the microglia signature genes GPR34 and P2RY13. Together, our results suggest to explore inhibition of HMGB2- and IL-1β-associated pathways in in vitro microglia. In addition, exposure to TGF-β3 and cultivation on laminin-coated substrates are suggested as potential improvements to current in vitro microglia culture protocols.
Keywords: HMGB2; IL-1β; NicheNet; TGF-β3; laminin; microglia identity; microglia signature genes; oligodendrocytes.
Copyright © 2023 Timmerman, Zuiderwijk-Sick, Baron and Bajramovic.
Conflict of interest statement
The authors declare that the research was conducted in the absence of any commercial or financial relationships that could be construed as a potential conflict of interest.
Figures


Similar articles
-
Transcriptome analysis reveals the contribution of oligodendrocyte and radial glia-derived cues for maintenance of microglia identity.Glia. 2022 Apr;70(4):728-747. doi: 10.1002/glia.24136. Epub 2021 Dec 28. Glia. 2022. PMID: 34961968
-
Culture shock: microglial heterogeneity, activation, and disrupted single-cell microglial networks in vitro.Mol Neurodegener. 2022 Mar 28;17(1):26. doi: 10.1186/s13024-022-00531-1. Mol Neurodegener. 2022. PMID: 35346293 Free PMC article.
-
Identification of a unique TGF-β-dependent molecular and functional signature in microglia.Nat Neurosci. 2014 Jan;17(1):131-43. doi: 10.1038/nn.3599. Epub 2013 Dec 8. Nat Neurosci. 2014. PMID: 24316888 Free PMC article.
-
The Kaleidoscope of Microglial Phenotypes.Front Immunol. 2018 Jul 31;9:1753. doi: 10.3389/fimmu.2018.01753. eCollection 2018. Front Immunol. 2018. PMID: 30108586 Free PMC article. Review.
-
Neuronal injury in chronic CNS inflammation.Best Pract Res Clin Anaesthesiol. 2010 Dec;24(4):551-62. doi: 10.1016/j.bpa.2010.11.001. Epub 2010 Nov 29. Best Pract Res Clin Anaesthesiol. 2010. PMID: 21619866 Review.
Cited by
-
IMMUNE AND MOLECULAR CORRELATES OF RESPONSE TO IMMUNOTHERAPY REVEALED BY BRAIN-METASTATIC MELANOMA MODELS.bioRxiv [Preprint]. 2024 Oct 9:2024.08.26.609785. doi: 10.1101/2024.08.26.609785. bioRxiv. 2024. PMID: 39372744 Free PMC article. Preprint.
References
LinkOut - more resources
Full Text Sources
Miscellaneous

