Hyperosmotic stress induces 2-cell-like cells through ROS and ATR signaling
- PMID: 37432066
- PMCID: PMC10481651
- DOI: 10.15252/embr.202256194
Hyperosmotic stress induces 2-cell-like cells through ROS and ATR signaling
Abstract
Mouse embryonic stem cells (ESCs) display pluripotency features characteristic of the inner cell mass of the blastocyst. Mouse embryonic stem cell cultures are highly heterogeneous and include a rare population of cells, which recapitulate characteristics of the 2-cell embryo, referred to as 2-cell-like cells (2CLCs). Whether and how ESC and 2CLC respond to environmental cues has not been fully elucidated. Here, we investigate the impact of mechanical stress on the reprogramming of ESC to 2CLC. We show that hyperosmotic stress induces 2CLC and that this induction can occur even after a recovery time from hyperosmotic stress, suggesting a memory response. Hyperosmotic stress in ESCs leads to accumulation of reactive-oxygen species (ROS) and ATR checkpoint activation. Importantly, preventing either elevated ROS levels or ATR activation impairs hyperosmotic-mediated 2CLC induction. We further show that ROS generation and the ATR checkpoint act within the same molecular pathway in response to hyperosmotic stress to induce 2CLCs. Altogether, these results shed light on the response of ESC to mechanical stress and on our understanding of 2CLC reprogramming.
Keywords: 2-cell-like cells; hyperosmotic stress; pluripotency; reprogramming; totipotency.
© 2023 The Authors. Published under the terms of the CC BY NC ND 4.0 license.
Conflict of interest statement
The authors declare that they have no conflict of interest.
Figures
- A
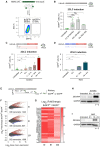
Experimental design. Top. Reporter cell line used for all experiments carrying a tbGFP‐PEST reporter driven by MERVL‐LTR. Rare population of cells expressing MERVL become green. Bottom. Example of FACS data sorting ESCs according to tbGFP expression.
- B–D
Percentage of 2‐cell‐like cells obtained after hyperosmotic treatments for 24 h (B) or the indicated time (C‐D). Shown are the mean ± s.d. from at least two replicates. Individual dots indicate measurement of an independent biological replicate by FACS. Unpaired two‐tailed t‐tests were performed.
- E
Experimental design. ESC are sorted according to tbGFP fluorescence before sorbitol treatment (t0), after 6 h of sorbitol (t6), or after 24 h of sorbitol treatment (t24). For each collection time, tbGFP‐ and tbGFP+ cells are collected and processed for RNA‐sequencing.
- F
MA plots displaying differentially expressed genes in tbGFP+ compared to tbGFP‐ cells for the indicated time points following sorbitol treatment, as indicated in E (t0, t6, and t24). n = 2 cell cultures in experiments performed on different days. Significantly DE genes are highlighted in red for upregulated transcripts and blue for downregulated transcripts (P.adj < 0.05; Log2FoldChange(tbGFP+/tbGFP−) > 1 or − 1).
- G
Heatmap depicting Log2FoldChange of 25 selected 2CLC markers. All genes displayed significative differential expression at t0, t6 and t24 sorbitol treatment in tbGFP+ cells compared to tbGFP− cells of related time point (P.adj < 0.01).
- H, I
Protein levels assessed by Western blotting in the indicated conditions. Shown is one representative image from two independent replicates.
- A
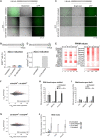
Representative images showing bright‐field and GFP fluorescence from ESCs incubated for 24 h with indicated hyperosmotic treatment. Red arrows indicate tbGFP‐positive 2CLCs. Scale bar: 100 μm.
- B
Percentage of 2CLCs obtained by FACS after the indicated sorbitol or NaCl treatments for 24 h. Shown are the mean from two replicates. Individual dots indicate measurement of an independent biological replicate by FACS.
- C
Representative image showing bright‐field and GFP fluorescence from ESCs incubated for 24 h with the indicated hyperosmotic treatment. Red arrows indicate tbGFP‐positive 2CLCs. Scale bar: 100 μm.
- D
Percentage of 2CLCs obtained by FACS after the indicated 0.2 M sorbitol treatment for 24 h. Shown are the mean from two replicates. Individual dots indicate measurement of an independent biological replicate by FACS.
- E
Heatmap depicting FPKM values of the 25 selected 2CLC markers from Fig 1G for all RNA‐sequencing conditions. All genes displayed significative differential expression at t0, t6 and t24 sorbitol treatment in tbGFP+ cells compared to tbGFP− cells of related time point (P.adj < 0.01).
- F, G
MA plots displaying differentially expressed genes in tbGFP+ from t6 compared to t0 or t24 compared to t0. Significantly DE genes are highlighted in red for up‐regulated transcripts and blue for downregulated transcripts (P.adj < 0.05; Log2FoldChange(tbGFP+/tbGFP−) > 1 or − 1).
- H, I
RT‐qPCR analysis of the indicated genes in ESC cultures treated with sorbitol or NaCl for the indicated time. Shown are the mean ± s.d. of three independent replicates for (G) or the mean of two independent replicates for H. Individual dots indicate fold‐change measurement for an independent biological replicate by qPCR.
- J
RT‐qPCR of the indicated genes in MEF control (untreated) and treated with sorbitol or NaCl for 24 h and compared with untreated ESCs. Oct4 is shown as comparison of a gene strongly and specifically expressed in ESCs. Shown are the mean ± s.d. of three independent replicates.
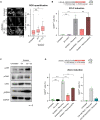
(Left) Representative single confocal z‐section of CellROX‐DeepRed fluorescence of ESC treated with 0.2 M sorbitol for the indicated time from two biological replicates. Scale bar: 10 μm. (Right) Quantification of CellROX‐DeepRed fluorescence intensity from single z‐sections from two biological replicates. Two‐tailed Mann–Whitney tests were performed. Boxes indicate the range between the first and third quartile, the line indicates the median and the whiskers display the spread from 5 to 95% of the data.
Percentage of 2CLCs obtained by FACS after the indicated sorbitol treatment with addition of ROS scavenger N‐AcetylCysteine (NAC) during either the sorbitol treatment or recovery time. Shown are the mean ± s.d. from at least two replicates. Individual dots indicate measurement of an independent biological replicate by FACS. Unpaired two‐tailed t‐tests were performed.
Protein levels assessed by Western blotting in the indicated conditions. Shown is one representative image from three independent replicates.
Percentage of 2CLCs obtained by FACS after the indicated hyperosmotic treatment with addition of ATR inhibitor during either the hyperosmotic stress or recovery time. Shown are the mean ± s.d. from at least two replicates. Individual dots indicate measurement of an independent biological replicate by FACS. Same untreated dots are shown. Two‐tail t‐tests were performed.
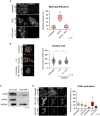
(Left) Representative single confocal z‐sections of CellROX‐DeepRed fluorescence of ESCs treated with either hydrogen‐peroxide (H2O2) with or without addition of the NAC ROS scavenger from two biological replicates. Scale bar: 10 μm. (Right) Boxplots showing quantification of CellROX‐DeepRed fluorescence intensity from single z‐sections. Boxes indicate the range between the first and third quartile, the line indicates the median and the whiskers display the spread from 5 to 95% of the data. Two‐tailed Mann–Whitney tests were performed. A total of 68, 44, and 51 nuclei were quantified in untreated, H2O2, H202 + NAC, respectively.
(Left) DAPI signal of representative single‐section of ESCs treated with 0.2 M sorbitol for the indicated time from two biological replicates. Nuclei segmentation is shown in red. Scale bar: 10 μm. (Right) The plot displays median (red line) area ± s.d. of nuclear area as determined by DAPI fluorescence. Each dot represents a single nucleus from 2 biological replicates. Two‐tail Mann–Whitney tests were performed. A total of 731, 236, and 465 nuclei were quantified in untreated, 6 h, 6 + 18 h sorbitol, respectively.
Western blot analysis for the indicated antibodies in ESCs treated with hydroxy‐urea (HU) with or without the ATR inhibitor. Shown is one representative image from two independent replicates. p, phosphorylated.
(Left) Representative single confocal z‐section of immunofluorescence for CHK1 and phosphoCHK1 (pCHK1) of ESCs treated with HU with or without ATR inhibitor from two biological replicates. Scale bar: 10 μm. (Right) Quantification of immunofluorescence intensities from single z‐sections. A total of 56, 65, and 46 nuclei were quantified in untreated, 2 mM HU, 2 mM HU + ATRi, respectively. Boxes indicate the range between the first and third quartile, the line indicates the median and the whiskers display the spread from 5 to 95% of the data.
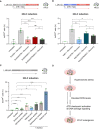
Percentage of 2CLCs obtained by FACS after the indicated sorbitol treatment with addition of ROS scavenger N‐AcetylCysteine (NAC) or ATR inhibitor. Shown are the mean ± s.d. from five replicates. Individual dots indicate measurement of an independent biological replicate by FACS. Unpaired two‐tailed t‐tests were performed.
Percentage of 2CLCs obtained by FACS after the indicated NaCl treatment with the addition of ROS scavenger N‐AcetylCysteine (NAC) or ATR inhibitor. Shown are the mean ± s.d. from at least two replicates. Individual dots indicate measurement of an independent biological replicate by FACS. Unpaired two‐tailed t‐tests were performed.
Percentage of 2CLCs obtained by FACS after the indicated treatments. Shown are the mean ± s.d. from at least two replicates. Individual dots indicate measurement of an independent biological replicate by FACS. Individual and combinatorial treatments performed with 0.2 M of sorbitol, 24 mM of sodium acetate, 2.5 nM of PlaB spliceosome inhibitor and 0.53 μM of retinoic acid. Unpaired two‐tailed t‐tests were performed. Unpaired two‐tailed t‐tests were performed against each individual treatment in the combinatorial experiments.
Proposed model of action of hyperosmotic‐mediated induction of 2CLCs.
Similar articles
-
Maternal Factor Dppa3 Activates 2C-Like Genes and Depresses DNA Methylation in Mouse Embryonic Stem Cells.Front Cell Dev Biol. 2022 Jun 3;10:882671. doi: 10.3389/fcell.2022.882671. eCollection 2022. Front Cell Dev Biol. 2022. PMID: 35721479 Free PMC article.
-
Retinoic acid signaling is critical during the totipotency window in early mammalian development.Nat Struct Mol Biol. 2021 Jun;28(6):521-532. doi: 10.1038/s41594-021-00590-w. Epub 2021 May 27. Nat Struct Mol Biol. 2021. PMID: 34045724 Free PMC article.
-
Chronic cypermethrin exposure alters mouse embryonic stem cell growth kinetics, induces Phase II detoxification response and affects pluripotency and differentiation gene expression.Eur J Histochem. 2020 Feb 17;64(1):3084. doi: 10.4081/ejh.2020.3084. Eur J Histochem. 2020. PMID: 32214279 Free PMC article.
-
Capturing Pluripotency and Beyond.Cells. 2021 Dec 16;10(12):3558. doi: 10.3390/cells10123558. Cells. 2021. PMID: 34944066 Free PMC article. Review.
-
Signaling pathways dictating pluripotency in embryonic stem cells.Int J Dev Biol. 2013;57(9-10):667-75. doi: 10.1387/ijdb.130064dd. Int J Dev Biol. 2013. PMID: 24307301 Review.
Cited by
-
The pluripotent-to-totipotent state transition in mESCs activates the intrinsic apoptotic pathway through DUX-induced DNA replication stress.Cell Mol Life Sci. 2024 Oct 26;81(1):440. doi: 10.1007/s00018-024-05465-z. Cell Mol Life Sci. 2024. PMID: 39460804 Free PMC article.
References
-
- Aquilano K, Filomeni G, di Renzo L, di Vito M, di Stefano C, Salimei PS, Ciriolo MR, Marfé G (2007) Reactive oxygen and nitrogen species are involved in sorbitol‐induced apoptosis of human erithroleukaemia cells K562. Free Radic Res 41: 452–460 - PubMed
-
- Chalut KJ, Paluch EK (2016) The Actin cortex: a bridge between cell shape and function. Dev Cell 38: 571–573 - PubMed
Publication types
MeSH terms
Substances
LinkOut - more resources
Full Text Sources
Molecular Biology Databases
Miscellaneous

