

Cellular senescence induction leads to progressive cell death via the INK4a-RB pathway in naked mole-rats
- PMID: 37431790
- PMCID: PMC10425838
- DOI: 10.15252/embj.2022111133
Cellular senescence induction leads to progressive cell death via the INK4a-RB pathway in naked mole-rats
Abstract
Naked mole-rats (NMRs) have exceptional longevity and are resistant to age-related physiological decline and diseases. Given the role of cellular senescence in aging, we postulated that NMRs possess unidentified species-specific mechanisms to prevent senescent cell accumulation. Here, we show that upon induction of cellular senescence, NMR fibroblasts underwent delayed and progressive cell death that required activation of the INK4a-retinoblastoma protein (RB) pathway (termed "INK4a-RB cell death"), a phenomenon not observed in mouse fibroblasts. Naked mole-rat fibroblasts uniquely accumulated serotonin and were inherently vulnerable to hydrogen peroxide (H2 O2 ). After activation of the INK4a-RB pathway, NMR fibroblasts increased monoamine oxidase levels, leading to serotonin oxidization and H2 O2 production, which resulted in increased intracellular oxidative damage and cell death activation. In the NMR lung, induction of cellular senescence caused delayed, progressive cell death mediated by monoamine oxidase activation, thereby preventing senescent cell accumulation, consistent with in vitro results. The present findings indicate that INK4a-RB cell death likely functions as a natural senolytic mechanism in NMRs, providing an evolutionary rationale for senescent cell removal as a strategy to resist aging.
Keywords: INK4a; cell death; cellular senescence; monoamine oxidase; naked mole-rat.
© 2023 The Authors.
Conflict of interest statement
The authors declare that they have no conflict of interest.
Figures
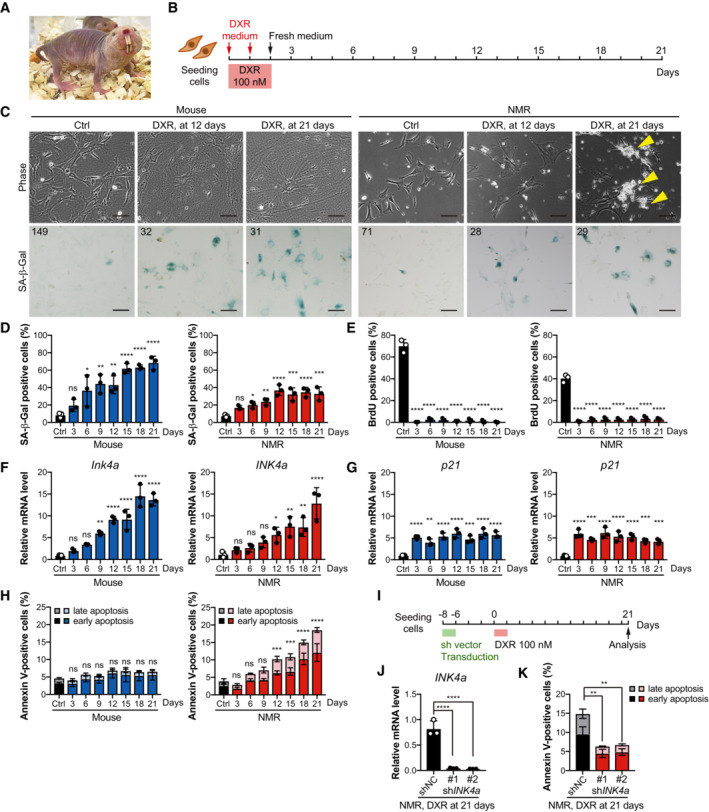
- A
Adult naked mole‐rats (NMRs).
- B
Scheme for doxorubicin (DXR) treatment and time‐course analysis.
- C
Cell morphology and SA‐β‐Gal activity of mouse or NMR fibroblasts 12 or 21 days after DXR treatment. Arrowheads indicate dying cells. The number in the upper left corner indicates Hoechst‐positive nuclei. Scale bar, 100 μm.
- D–H
Time‐course analysis of mouse or NMR fibroblasts after DXR treatment: quantification of SA‐β‐Gal‐positive cells (%) (D); quantification of BrdU‐positive cells (%) (E); qRT‐PCR analysis of the expression of INK4a (F) or p21 (G) normalized to ACTB mRNA levels; quantification of Annexin V‐positive cells (%) (Annexin V+/PI− as early apoptotic and Annexin V+/PI+ double‐positive as late apoptotic) (H).
- I
Scheme for DXR treatment after INK4a knockdown in NMR fibroblasts.
- J, K
qRT‐PCR analysis of the expression of INK4a (J) and quantification of Annexin V‐positive cells (%) (K) in shINK4a‐transduced NMR fibroblasts at 21 days after DXR treatment.
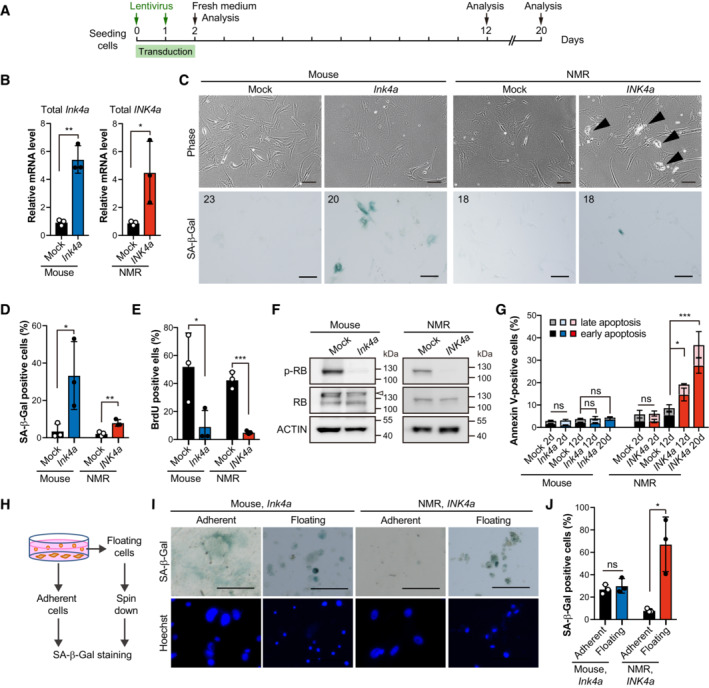
- A
Scheme for INK4a transduction.
- B
qRT‐PCR analysis of the expression of INK4a at 12 days after INK4a or mock transduction, normalized to ACTB mRNA levels.
- C
Cell morphology and SA‐β‐Gal activity of mouse or NMR fibroblasts 12 days after INK4a transduction. Arrowheads indicate dying cells. The number in the upper left corner indicates Hoechst‐positive nuclei. Scale bar, 100 μm.
- D, E
Quantification of SA‐β‐Gal‐positive cells (%) (D) and BrdU‐positive cells (%) (E) at 12 days after INK4a transduction.
- F
Western blot analysis of RB in mouse or NMR fibroblasts at 12 days after INK4a transduction (p, phospho‐specific antibody). ACTIN was used as a loading control. The arrowhead indicates a nonspecific band.
- G
Quantification of Annexin V/PI‐positive cells (%) (Annexin V+/PI− as early apoptotic and Annexin V+/PI+ double‐positive as late apoptotic) at 2, 12, or 20 days after INK4a transduction.
- H
Scheme for SA‐β‐Gal staining of adherent and floating cells.
- I
SA‐β‐Gal activity in the adherent living cell population and floating dead cell population in mouse or NMR fibroblast cultures at 12 days after INK4a transduction. Scale bar, 100 μm.
- J
Quantification of SA‐β‐Gal‐positive cells in the adherent living cell population and floating dead cell population after the same treatment as in (I).
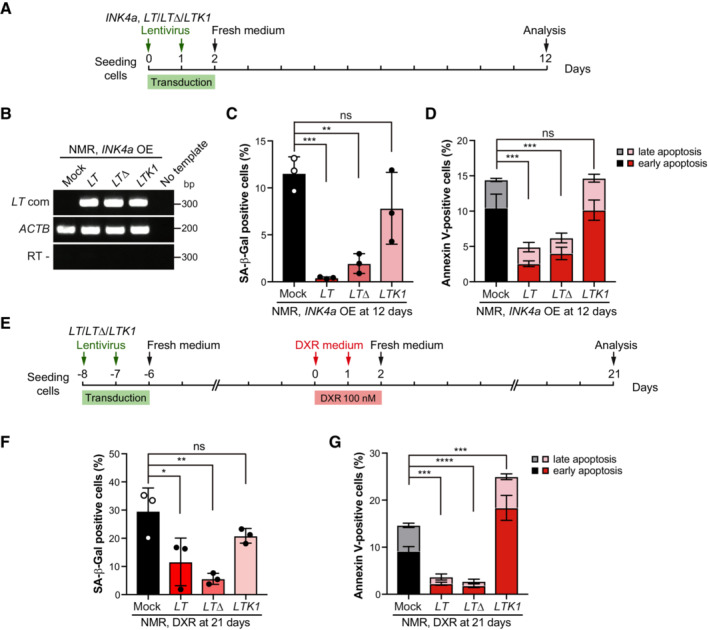
- A
Scheme for transduction of INK4a and different forms of SV40 Large T antigen (LT, LTΔ, and LTK1).
- B
RT‐PCR analysis of SV40 Large T expression in NMR‐fibroblasts transduced with different forms of SV40 Large T antigen (LT, LTΔ, and LTK1) and INK4a.
- C, D
Quantification of SA‐β‐Gal‐positive cells (%) (C) and Annexin V‐positive cells (%) (Annexin V+/PI− as early apoptotic and Annexin V+/PI+ double‐positive as late apoptotic) (D) in NMR‐fibroblasts transduced with different forms of SV40 Large T antigen (LT, LTΔ, and LTK1) and INK4a. OE; overexpression.
- E
Scheme for doxorubicin (DXR) treatment following transduction of different forms of SV40 Large T antigen (LT, LTΔ, and LTK1).
- F
Quantification of SA‐β‐Gal‐positive cells (%) at 21 days after DXR treatment in NMR‐fibroblasts transduced with different forms of SV40 Large T antigen (LT, LTΔ, and LTK1).
- G
Quantification of Annexin V‐positive cells after the same treatment as in (F). Annexin V+/PI− cells were counted as early apoptotic cells and Annexin V+/PI− cells as late apoptotic cells.

Venn diagram showing the differentially expressed genes (DEGs, > 1.5‐fold in INK4a‐transduced fibroblasts) identified from comparisons of mock‐transduced and INK4a‐transduced NMR fibroblasts 12 days after transduction. Data were obtained from n = 3 biological replicates.
Top 20 enriched gene ontology (GO) terms and KEGG pathways obtained using Metascape analysis of the 165 common genes in (A).
Quantification of PI‐positive cells in NMR and mouse fibroblasts 18 h after 6 h of treatment with the indicated doses of hydrogen peroxide (H2O2). Data are expressed as the mean ± SD from n = 3 biological replicates.
Levels of serotonin and 5‐hydroxyindoleacetic acid (5‐HIAA) measured by liquid chromatography–tandem mass spectrometry (LC–MS/MS) in mouse or NMR fibroblasts at 12 days after INK4a transduction. Data are expressed as the mean ± SD from two technical replicates for each fibroblasts culture (n = 3 biological replicates).

- A
Scheme for continuous cultivation after induction of contact inhibition (CI).
- B, C
Cell morphology (B) and SA‐β‐Gal staining (C) in mouse or NMR fibroblasts at 14 or 28 days after induction of CI. Scale bar, 100 μm. The number in the upper left corner indicates Hoechst‐positive nuclei.
- D, E
Quantification of SA‐β‐Gal‐positive cells (%) (D), and BrdU‐positive cells (%) (E) at 14 or 28 days after induction of CI.
- F
qRT‐PCR analysis of the expression of INK4a in mouse or NMR fibroblasts at 14 or 28 days after induction of CI, normalized to ACTB mRNA levels.
- G
Quantification of Annexin V‐positive (early apoptotic; Annexin V+/PI− and late apoptotic; Annexin V+/PI+ double‐positive) cells (%) at 14 or 28 days after induction of CI.
- H, I
qRT‐PCR analysis of the expression of INK4a normalized to ACTB mRNA levels (H), and quantification of Annexin V‐positive (early apoptotic; Annexin V+/PI− and late apoptotic; Annexin V+/PI+ double‐positive) cells (%) (I) in shINK4a‐transduced NMR‐fibroblasts at 21 days after induction of CI.
- J
Mouse fibroblasts were passaged 28 days after induction of CI and subjected to cell proliferation analysis.
- K
NMR fibroblasts were passaged 28 days after induction of CI and subjected to cell proliferation analysis.

Quantification of reactive oxygen species (ROS) using 2′,7′‐dihydrodichlorofluorescin diacetate (DCFH‐DA) in mock‐ or INK4a‐transduced NMR fibroblasts at 12 days after transduction. Data are expressed as the mean ± SD from n = 3 biological replicates.
Left, representative images of lipid peroxidation (green) staining in NMR fibroblasts at 12 days after INK4a‐transduction. Scale bar, 50 μm. Right, quantification of signal intensity of lipid peroxidation staining. Data are expressed as the mean ± SD from n = 3 biological replicates.
Quantification of PI‐positive cells in NMR fibroblasts treated for 24 h with N‐acetyl L‐cysteine (NAC), Trolox, or Tempol at 20 days after INK4a transduction (%). Data are expressed as the mean ± SD from n = 6 biological replicates except for Trolox and Tempol (n = 4).
Western blot of monoamine oxidase (MAO)‐A and MAO‐B in mouse or NMR fibroblasts at 20 days after INK4a transduction. ACTIN was used as a loading control. Numbers below the gel images indicate quantification of MAO‐A or ‐B/ACTIN intensity (n = 3 average).
Quantification of ROS using DCFH‐DA in INK4a‐transduced NMR fibroblasts at 20 days after transduction. Cells were treated with each inhibitor for 24 h prior to analysis; Clorgyline (MAO‐A inhibitor, 10 μM), Rasagiline (MAO‐B inhibitor, 10 μM), Phenelzine (inhibitor of both MAO‐A and MAO‐B, 50 μM). Data are expressed as the mean ± SD from n = 4 biological replicates.
Quantification of PI‐positive cells in NMR fibroblasts treated for 24 h with Clorgyline, Rasagiline, or Phenelzine at 20 days after INK4a transduction (%). Data are expressed as the mean ± SD from n = 3 biological replicates except for phenelzine (n = 5).
Western blot of MAO‐A and MAO‐B in mouse or NMR fibroblasts at 21 days after doxorubicin (DXR) treatment. ACTIN was used as a loading control. Numbers below the gel images indicate quantification of MAO‐A or ‐B/ACTIN intensity (n = 3 average).
Quantification of PI‐positive cells in NMR fibroblasts treated for 24 h with the indicated dose of Phenelzine (Phe) at 21 days after DXR treatment (%). Data are expressed as the mean ± SD from n = 3 biological replicates.
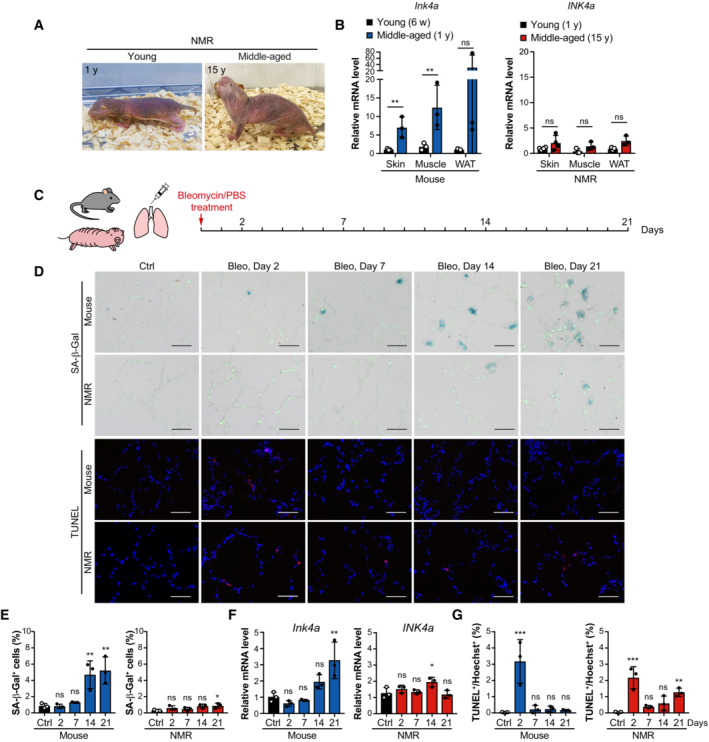
- A
Left, young NMR (one‐year‐old). Right, middle‐aged NMR (15‐year‐old).
- B
qRT‐PCR analysis of INK4a expression in the skin, muscle, and white adipose tissue (WAT) of 6‐week‐old mice (young; 6 w), 1‐year‐old mice (middle‐aged; 1 y), 1‐year‐old NMRs (young; 1 y), and 15‐year‐old NMRs (middle‐aged; 15 y).
- C
Scheme for bleomycin (Bleo) treatment.
- D
SA‐β‐Gal activity (SA‐β‐Gal, blue; nuclei, green) and TUNEL staining (TUNEL, red; nuclei, blue) in lungs of mice or NMRs at 2, 7, 14, and 21 days after Bleo administration.
- E–G
Time‐course analysis of mice or NMR lungs after Bleo administration: quantification of SA‐β‐Gal‐positive cells (%) (E); qRT‐PCR analysis of the expression of INK4a normalized to ACTB mRNA levels (F); quantification of TUNEL‐positive cells (%) (G).

- A
Scheme for bleomycin (Bleo) treatment and additional phenelzine (Phe) treatment. Mouse or NMR lungs were treated with Phe for 5 days starting at 16 days after Bleo administration.
- B
SA‐β‐Gal activity (SA‐β‐Gal, blue; nuclei, green) and TUNEL staining (TUNEL, red; nuclei, blue) in lungs of mice or NMRs at 21 days after Bleo administration, with or without Phe are shown.
- C–E
Quantification of SA‐β‐Gal‐positive cells (%) (C), qRT‐PCR analysis of INK4a expression normalized to ACTB mRNA levels (D), quantification of TUNEL‐positive cells (%) (E) in mouse or NMR lungs at 21 days after Bleo administration, with or without Phe.

Similar articles
-
INK4 locus of the tumor-resistant rodent, the naked mole rat, expresses a functional p15/p16 hybrid isoform.Proc Natl Acad Sci U S A. 2015 Jan 27;112(4):1053-8. doi: 10.1073/pnas.1418203112. Epub 2014 Dec 30. Proc Natl Acad Sci U S A. 2015. PMID: 25550505 Free PMC article.
-
Atg5-mediated autophagy controls apoptosis/anoikis via p53/Rb pathway in naked mole-rat fibroblasts.Biochem Biophys Res Commun. 2020 Jul 12;528(1):146-153. doi: 10.1016/j.bbrc.2020.05.083. Epub 2020 May 22. Biochem Biophys Res Commun. 2020. PMID: 32451084
-
Hypersensitivity to contact inhibition provides a clue to cancer resistance of naked mole-rat.Proc Natl Acad Sci U S A. 2009 Nov 17;106(46):19352-7. doi: 10.1073/pnas.0905252106. Epub 2009 Oct 26. Proc Natl Acad Sci U S A. 2009. PMID: 19858485 Free PMC article.
-
Cellular Senescence in Diabetes Mellitus: Distinct Senotherapeutic Strategies for Adipose Tissue and Pancreatic β Cells.Front Endocrinol (Lausanne). 2022 Mar 31;13:869414. doi: 10.3389/fendo.2022.869414. eCollection 2022. Front Endocrinol (Lausanne). 2022. PMID: 35432205 Free PMC article. Review.
-
DNA Homeostasis and Senescence: Lessons from the Naked Mole Rat.Int J Mol Sci. 2021 Jun 2;22(11):6011. doi: 10.3390/ijms22116011. Int J Mol Sci. 2021. PMID: 34199458 Free PMC article. Review.
Cited by
-
Comparative time-series multi-omics analyses suggest H1.2 involvement in anoxic adaptation and cancer resistance.PLoS Biol. 2024 Aug 23;22(8):e3002778. doi: 10.1371/journal.pbio.3002778. eCollection 2024 Aug. PLoS Biol. 2024. PMID: 39178313 Free PMC article.
-
Rapid evolution of genes with anti-cancer functions during the origins of large bodies and cancer resistance in elephants.bioRxiv [Preprint]. 2024 Feb 29:2024.02.27.582135. doi: 10.1101/2024.02.27.582135. bioRxiv. 2024. PMID: 38463968 Free PMC article. Preprint.
-
Emerging insights in senescence: pathways from preclinical models to therapeutic innovations.NPJ Aging. 2024 Nov 22;10(1):53. doi: 10.1038/s41514-024-00181-1. NPJ Aging. 2024. PMID: 39578455 Free PMC article. Review.
References
-
- Al‐Mohanna MA, Manogaran PS, Al‐Mukhalafi Z, Al‐Hussein A, Aboussekhra KA (2004) The tumor suppressor p16INK4a gene is a regulator of apoptosis induced by ultraviolet light and cisplatin. Oncogene 23: 201–212 - PubMed
-
- Andziak B, O'Connor TP, Buffenstein R (2005) Antioxidants do not explain the disparate longevity between mice and the longest‐living rodent, the naked mole‐rat. Mech Ageing Dev 126: 1206–1212 - PubMed
-
- Andziak B, O'Connor TP, Qi W, DeWaal EM, Pierce A, Chaudhuri AR, Van Remmen H, Buffenstein R (2006) High oxidative damage levels in the longest‐living rodent, the naked mole‐rat. Aging Cell 5: 463–471 - PubMed
-
- Aoshiba K, Tsuji T, Nagai A (2003) Bleomycin induces cellular senescence in alveolar epithelial cells. Eur Respir J 22: 436–443 - PubMed
Publication types
MeSH terms
Substances
LinkOut - more resources
Full Text Sources
Research Materials
