This is a preprint.
Incorporating physics to overcome data scarcity in predictive modeling of protein function: a case study of BK channels
- PMID: 37425916
- PMCID: PMC10327070
- DOI: 10.1101/2023.06.24.546384
Incorporating physics to overcome data scarcity in predictive modeling of protein function: a case study of BK channels
Update in
-
Incorporating physics to overcome data scarcity in predictive modeling of protein function: A case study of BK channels.PLoS Comput Biol. 2023 Sep 15;19(9):e1011460. doi: 10.1371/journal.pcbi.1011460. eCollection 2023 Sep. PLoS Comput Biol. 2023. PMID: 37713443 Free PMC article.
Abstract
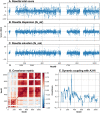
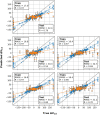
Machine learning has played transformative roles in numerous chemical and biophysical problems such as protein folding where large amount of data exists. Nonetheless, many important problems remain challenging for data-driven machine learning approaches due to the limitation of data scarcity. One approach to overcome data scarcity is to incorporate physical principles such as through molecular modeling and simulation. Here, we focus on the big potassium (BK) channels that play important roles in cardiovascular and neural systems. Many mutants of BK channel are associated with various neurological and cardiovascular diseases, but the molecular effects are unknown. The voltage gating properties of BK channels have been characterized for 473 site-specific mutations experimentally over the last three decades; yet, these functional data by themselves remain far too sparse to derive a predictive model of BK channel voltage gating. Using physics-based modeling, we quantify the energetic effects of all single mutations on both open and closed states of the channel. Together with dynamic properties derived from atomistic simulations, these physical descriptors allow the training of random forest models that could reproduce unseen experimentally measured shifts in gating voltage, ΔV 1/2 , with a RMSE ∼ 32 mV and correlation coefficient of R ∼ 0.7. Importantly, the model appears capable of uncovering nontrivial physical principles underlying the gating of the channel, including a central role of hydrophobic gating. The model was further evaluated using four novel mutations of L235 and V236 on the S5 helix, mutations of which are predicted to have opposing effects on V 1/2 and suggest a key role of S5 in mediating voltage sensor-pore coupling. The measured ΔV 1/2 agree quantitatively with prediction for all four mutations, with a high correlation of R = 0.92 and RMSE = 18 mV. Therefore, the model can capture nontrivial voltage gating properties in regions where few mutations are known. The success of predictive modeling of BK voltage gating demonstrates the potential of combining physics and statistical learning for overcoming data scarcity in nontrivial protein function prediction.
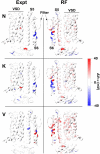
Author summary: Deep machine learning has brought many exciting breakthroughs in chemistry, physics and biology. These models require large amount of training data and struggle when the data is scarce. The latter is true for predictive modeling of the function of complex proteins such as ion channels, where only hundreds of mutational data may be available. Using the big potassium (BK) channel as a biologically important model system, we demonstrate that a reliable predictive model of its voltage gating property could be derived from only 473 mutational data by incorporating physics-derived features, which include dynamic properties from molecular dynamics simulations and energetic quantities from Rosetta mutation calculations. We show that the final random forest model captures key trends and hotspots in mutational effects of BK voltage gating, such as the important role of pore hydrophobicity. A particularly curious prediction is that mutations of two adjacent residues on the S5 helix would always have opposite effects on the gating voltage, which was confirmed by experimental characterization of four novel mutations. The current work demonstrates the importance and effectiveness of incorporating physics in predictive modeling of protein function with scarce data.
Conflict of interest statement
Figures


Similar articles
-
Incorporating physics to overcome data scarcity in predictive modeling of protein function: A case study of BK channels.PLoS Comput Biol. 2023 Sep 15;19(9):e1011460. doi: 10.1371/journal.pcbi.1011460. eCollection 2023 Sep. PLoS Comput Biol. 2023. PMID: 37713443 Free PMC article.
-
Emerging issues of connexin channels: biophysics fills the gap.Q Rev Biophys. 2001 Aug;34(3):325-472. doi: 10.1017/s0033583501003705. Q Rev Biophys. 2001. PMID: 11838236 Review.
-
Macromolecular crowding: chemistry and physics meet biology (Ascona, Switzerland, 10-14 June 2012).Phys Biol. 2013 Aug;10(4):040301. doi: 10.1088/1478-3975/10/4/040301. Epub 2013 Aug 2. Phys Biol. 2013. PMID: 23912807
-
Inner pore hydration free energy controls the activation of big potassium channels.Biophys J. 2023 Apr 4;122(7):1158-1167. doi: 10.1016/j.bpj.2023.02.005. Epub 2023 Feb 10. Biophys J. 2023. PMID: 36774534 Free PMC article.
-
Modulation of BK Channels by Small Endogenous Molecules and Pharmaceutical Channel Openers.Int Rev Neurobiol. 2016;128:193-237. doi: 10.1016/bs.irn.2016.03.020. Epub 2016 May 4. Int Rev Neurobiol. 2016. PMID: 27238265 Review.
References
-
- Hie BL, Yang KK. Adaptive machine learning for protein engineering. Current Opinion in Structural Biology. 2022. Feb 1;72:145–52. - PubMed
-
- Butler KT, Davies DW, Cartwright H, Isayev O, Walsh A. Machine learning for molecular and materials science. Nature. 2018. Jul;559(7715):547–55. - PubMed
-
- Wang Y, Lamim Ribeiro JM, Tiwary P. Machine learning approaches for analyzing and enhancing molecular dynamics simulations. Curr Opin Struct Biol. 2020. Apr;61:139–45. - PubMed
Publication types
Grants and funding
LinkOut - more resources
Full Text Sources
