. 2023 Jul 7;14(1):4038.
doi: 10.1038/s41467-023-39726-5.

Lateral membrane organization as target of an antimicrobial peptidomimetic compound

Affiliations

Lateral membrane organization as target of an antimicrobial peptidomimetic compound

Adéla Melcrová et al. Nat Commun. .

Abstract

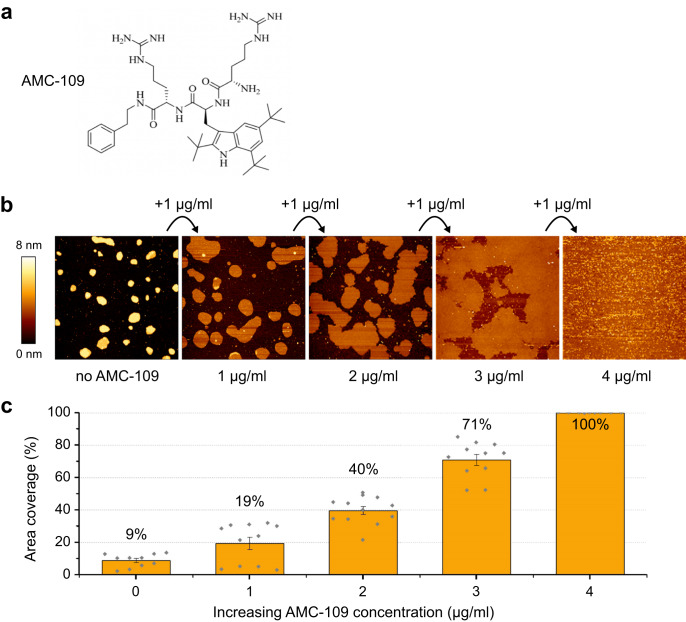
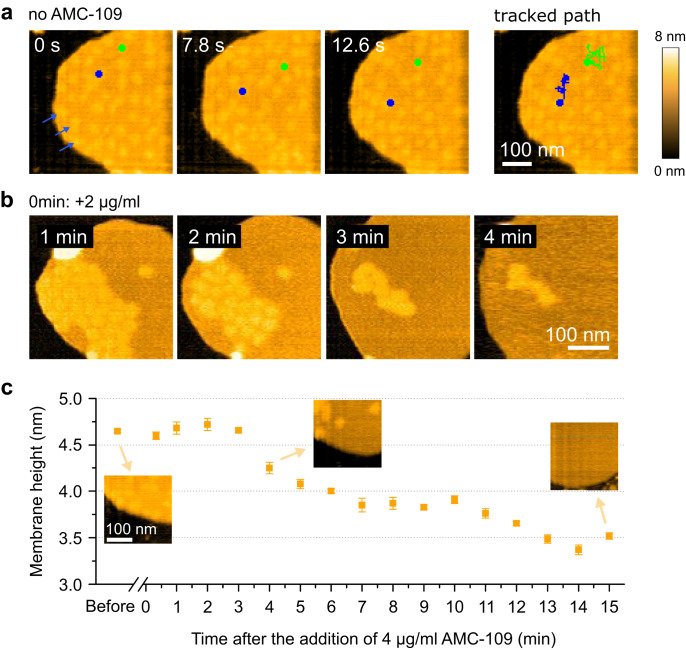
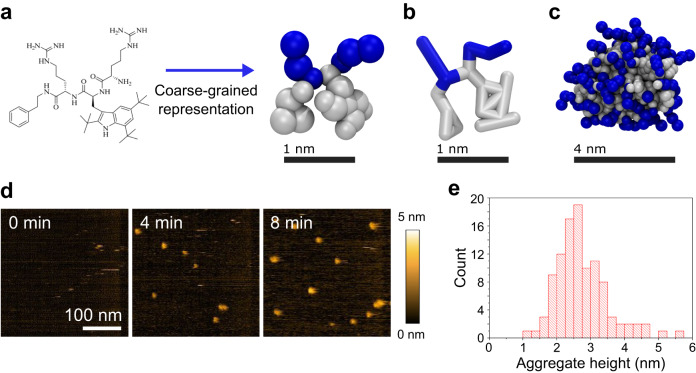
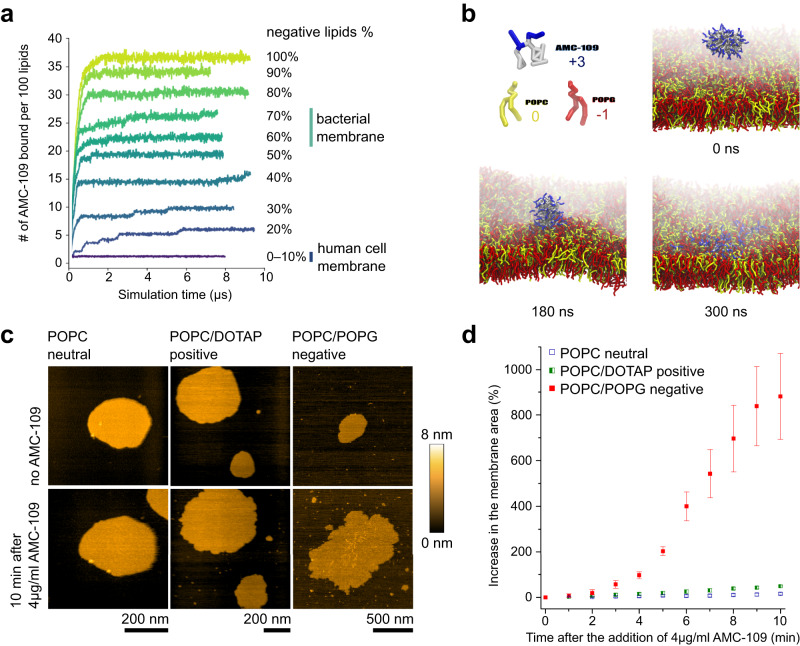
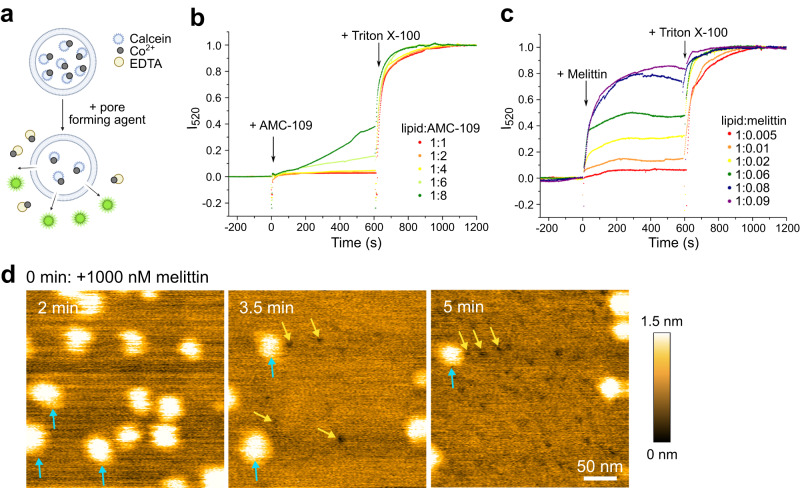
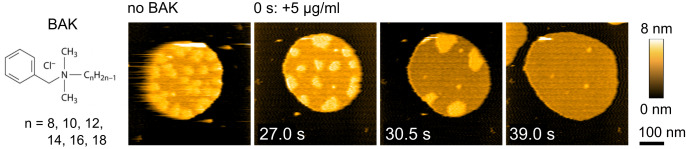
Antimicrobial resistance is one of the leading concerns in medical care. Here we study the mechanism of action of an antimicrobial cationic tripeptide, AMC-109, by combining high speed-atomic force microscopy, molecular dynamics, fluorescence assays, and lipidomic analysis. We show that AMC-109 activity on negatively charged membranes derived from Staphylococcus aureus consists of two crucial steps. First, AMC-109 self-assembles into stable aggregates consisting of a hydrophobic core and a cationic surface, with specificity for negatively charged membranes. Second, upon incorporation into the membrane, individual peptides insert into the outer monolayer, affecting lateral membrane organization and dissolving membrane nanodomains, without forming pores. We propose that membrane domain dissolution triggered by AMC-109 may affect crucial functions such as protein sorting and cell wall synthesis. Our results indicate that the AMC-109 mode of action resembles that of the disinfectant benzalkonium chloride (BAK), but with enhanced selectivity for bacterial membranes.


Conflict of interest statement

JSMS and WS are employed by Amicoat AS, the producer of AMC-109. The remaining authors declare no competing interests.

Figures

Fig. 1
Fig. 1. AFM imaging experiments reveal the effect of AMC-109 addition to S. aureus lipid membranes.
a AMC-109 chemical structure. b S. aureus lipid membranes upon treatment with AMC-109. Membranes are visualized untreated (left) and treated by subsequent additions of 1 µg/ml AMC-109 (0, 1, 2, 3, 4 μg/ml). Changes in the background colour originate from a combination of the membrane thinning and coverage of the mica by AMC-109. Representative of 3 independent experiments. c Area of the mica surface covered by the membrane upon subsequent additions of 1 µg/ml AMC-109. For each concentration, coverage of 10–12 areas in a 3×3 µm image size were evaluated. 3×3 µm images for area evaluation were gathered across 3 independent experiments (3–4 images for each AMC-109 concentration per experiment). Error bars represent standard error of the mean. Individual data points are depicted in grey. Source data for panel c are provided as a Source Data file.
Fig. 2
Fig. 2. HS-AFM imaging of the AMC-109 effects on S. aureus lipid membranes supported on mica.
a HS-AFM images of the untreated membrane showing the diffusion dynamics of lateral lipid domains (blue arrows). Dynamic path of two lateral domains (blue and green discs) were tracked in the 0.3 s per frame movie. Nanodomains diffusion was observed in 18 independent experiments. b HS-AFM images of the membrane in time after the addition of 2 μg/ml AMC-109. For an example of a 0 min frame see panel a. Lateral domains accumulate together, then gradually dissolve. This is followed by expansion and thinning of the membrane. Similar behavior was observed in 5 independent experiments. c Membrane thickness evolution over time after the addition of 4 μg/ml AMC-109. Measured from HS-AFM images at the continuous parts of the S. aureus lipid membrane surrounding the lateral lipid domains. Mean membrane height and standard errors of the mean are displayed. Data points are each the mean of N > 20 individual measurements (N = 363, 49, 22, 21, 74, 31, 52, 93, 37, 41, 71, 27, 35, 34, 27, 24, and 45, from left to right respectively. N represents number of point height measurements from the HS-AFM image at the specified time. Each height measurement is given as a difference between the height on top of the membrane and the height of the background.). Insets shows membrane details before the AMC-109 addition, and at t = 4 min and t = 15 min after. Average height before the AMC-109 addition is 4.65 ± 0.02 nm. At time 13–15 min the height settles around 3.5 nm. Source data for panel c are provided as a Source Data file.
Fig. 3
Fig. 3. Aggregation properties of AMC-109.
a AMC-109 chemical structure and its representation in Martini 3 coarse grained model. Cationic residues are depicted in blue, artificial hydrophobic residues mimicking phenyl-alanine (small triangle) and tryptophan with three tert-butyl groups (large planar structure) are depicted in grey. b Alternative representation of the AMC-109 molecule showing the connections between the interaction sites in the model. c Representative self-assembled aggregate of AMC-109 molecules formed after ∼0.5 μs of the MD simulation. d HS-AFM images of micellar aggregates adsorbed on mica after the addition of 5 µg/ml AMC-109. A representative of 2 independent experiments is shown. e Histogram of the measured aggregate height. Average aggregate height was evaluated as 2.75 ± 0.08 nm (N = 104). Source data for panel e are provided as a Source Data file.
Fig. 4
Fig. 4. Interaction of AMC-109 aggregates with model membranes.
a MD results on the number of AMC-109 molecules attached to the membrane per 100 lipids. An increase in a curve corresponds to the attachment of one or more aggregates into the membrane. The curves for 0 and 10% of negatively charged lipids both show no attachment of the AMC-109 aggregates. Levels of the negative charge corresponding to the membranes of human and bacterial cells are highlighted. b Interaction of a single AMC-109 aggregate with a symmetric POPG/POPC (60/40 mol%) membrane. The aggregate attaches to the membrane and gradually all the AMC-109 monomers dissolve in between the lipids. The simulation was run with multiple AMC-109 aggregates (Fig. S8). Other AMC-109 aggregates and water are hidden for clarity. Time stamps refer to the time of the simulated MD trajectory. c Representative HS-AFM images of the synthetic lipid membranes before and 10 min after the addition of 4 µg/ml AMC-109. Experiments were performed on neutral POPC, positively charged DOTAP/POPC (60/40 mol%), and negatively charged POPG/POPC (60/40 mol%). Growth of supported membranes deposited on mica was monitored in time after the addition of the AMC-109. d Quantitative analysis of the increase in the surface area of synthetic lipid membranes in time after treatment with 4 µg/ml AMC-109. Data correspond to representative images shown in panel c. Negatively charged membranes prove to be significantly more affected than neutral and positively charged ones. Averages and standard errors of the mean measured for each lipid composition for 3 individual experiments on 6–7 membrane patches are shown. Individual growth curves used for the displayed mean calculation are at Fig. S11. Source data for panels a, d are provided as a Source Data file.
Fig. 5
Fig. 5. Pore-forming activity of AMC-109 and melittin.
a Cobalt-calcein leakage assays principle. Non-fluorescent cobalt-calcein complex is trapped inside of the membrane liposomes. The addition of a perforating agent leads to their leakage out of the liposomes, where cobalt is extracted from the complex by EDTA resulting in an increased calcein fluorescence intensity. Schematics created in BioRender.com. b,c Calcein leakage induced by AMC-109 and melittin in POPG/POPC/POPE (60/30/10 mol%) liposomes. Arrows indicate the addition times of the antibiotic agent and detergent Triton X-100 to fully rupture the liposomes and obtain maximum fluorescence signal. 100 µg/ml liposomes were used for the experiments. b AMC-109 does not induce any leakage up to a ratio of 6 AMC-109 molecules per single lipid. c Melittin displays gradual leakage corresponding to its pore forming activity. d HS-AFM images of S. aureus lipid membranes after the addition of 1000 nM melittin. Blue arrows point at the lateral domains, visible as bright parts of the membrane. Yellow arrows point at the formed pores. Initially a lot of lateral domains are visible (left), pores start appearing after a few minutes of melittin exposure (middle), and gradually more pores are being formed (right). Representative of 3 independent experiments is shown. Source data for panels b and c are provided as a Source Data file.
Fig. 6
Fig. 6. Effects of the disinfectant benzalkonium chloride (BAK) on S. aureus lipid membranes.
Chemical structure of BAK and HS-AFM images of the membrane before and after the addition of 5 μg/ml BAK. The same effects were observed in 5 independent AFM or HS-AFM experiments.

Similar articles

Cited by

References

    1. Eriksen KR, Erichsen I. Resistance to methicillin, isoxazolyl penicillins, and cephalithin in Staphylococcus aureus. Acta Pathol. Microbiol. Scandinavica. 1964;62:255–275. doi: 10.1111/apm.1964.62.2.255. - DOI - PubMed
    1. Tacconelli E, et al. Discovery, research, and development of new antibiotics: the WHO priority list of antibiotic-resistant bacteria and tuberculosis. Lancet. Infect. Dis. 2018;18:318–327. doi: 10.1016/S1473-3099(17)30753-3. - DOI - PubMed
    1. Brogden KA. Antimicrobial peptides: Pore formers or metabolic inhibitors in bacteria? Nat. Rev. Microbiol. 2005;3:238–250. doi: 10.1038/nrmicro1098. - DOI - PubMed
    1. Divyashree M, et al. Clinical Applications of Antimicrobial Peptides (AMPs): Where do we Stand Now? Protein Pept. Lett. 2019;27:120–134. doi: 10.2174/0929866526666190925152957. - DOI - PubMed
    1. Dosler S. Antimicrobial peptides: Coming to the end of antibiotic era, the most promising agents. Istanbul J. Pharm. 2017;47:72–76. doi: 10.5152/IstanbulJPharm.2017.0012. - DOI

Publication types

MeSH terms