[Preprint]. 2024 Jun 4:2023.05.26.23290576.
doi: 10.1101/2023.05.26.23290576.

HIV-1 latency reversal agent boosting is not limited by opioid use

Affiliations

HIV-1 latency reversal agent boosting is not limited by opioid use

Tyler Lilie et al. medRxiv. .

Update in

Abstract

The opioid epidemic may impact the HIV-1 reservoir and its reversal from latency in virally suppressed people with HIV (PWH). We studied forty-seven PWH and observed that lowering the concentration of HIV-1 latency reversal agents (LRA), used in combination with small molecules that do not reverse latency, synergistically increases the magnitude of HIV-1 re-activation ex vivo, regardless of opioid use. This LRA boosting, which combines a Smac mimetic or low-dose protein kinase C agonist with histone deacetylase inhibitors, can generate significantly more unspliced HIV-1 transcription than phorbol 12-myristate 13-acetate (PMA) with ionomycin (PMAi), the maximal known HIV-1 reactivator. LRA boosting associated with greater histone acetylation in CD4+ T cells and modulated T cell activation-induced markers and intracellular cytokine production; Smac mimetic-based boosting was less likely to induce immune activation. We found that HIV-1 reservoirs in PWH contain unspliced and polyadenylated (polyA) virus mRNA, the ratios of which are greater in resting than total CD4+ T cells and can correct to 1:1 with PMAi exposure. Latency reversal results in greater fold-change increases to HIV-1 poly(A) mRNA than unspliced message. Multiply spliced HIV-1 transcripts and virion production did not consistently increase with LRA boosting, suggesting the presence of a persistent post-transcriptional block. LRA boosting can be leveraged to probe the mechanisms of an effective cellular HIV-1 latency reversal program.


Figures

Figure 1.
Figure 1.
HIV-1 reservoir size and intactness during opioid use. Quantifications were performed on participants who used (n=24) or did not use (n=12) opioids. (a) HIV-1 persistence measures in participants with (blue circles) and without (yellow circles) opioid use are shown. Statistical significance was assessed with Wilcoxon signed-rank tests. Data are displayed on a logarithmic y-axis scale; DNA and RNA was extracted from 5 million PBMC. Intact DNA was quantified with the IPDA assay. Mean values ± standard errors of the mean (SEM) are shown. (b) 5’ and 3’ genomic deletions as a function of opioid use, mean values ± 95% CIs are displayed, (c) Opioid subgroup analysis. The reservoir size of intact, 5’ deleted, and 3’ deleted or hypermutated regions are shown. (d) The proportion of intact genomes as a function of DNA copies and opioid use subgroup; Kruskal-Wallis testing adjusting for multiple comparisons was not significant. Cohort 1, injection opioid use; cohort 2, prescribed oral opioids for pain; cohort 3, methadone; cohort 4, suboxone; cohort 5, no opioid use.
Figure 2.
Figure 2.
HIV-1 latency reversal in OPHION participants. HIV-1 caRNA levels were quantified after 24-hour incubations, in the presence of tenofovir 2 μM and raltegravir 2 μM, using 5 million PBMC and compared to a no-drug DMSO-containing condition. Mean values and the 95% CIs are shown. (a) Combined data showing LRA responses in thirty-six total participants with (blue circles) or without (yellow circles) opioid use. Data from (a) was dichotomized by (b) opioid use, (c) sex (light purple circles, male; light grey circles, female), and (d) race (light green circles, Black and American Indian; dark green circles, white). Means and SEM are shown. Dotted horizontal line denotes a fold-change of 1. *p<0.05, ** p<0.01, *** p<0.001, and **** p<0.0001 for LRA combinations, corrected for multiple comparisons. αCD3/αCD28, anti-CD3 anti-CD28 superparamagnetic beads; RMD, romidepsin; PNB, panobinostat; R, RMD 20nM; P, PNB 30nM; B, bryostatin 1nM; A, AZD5582 100nM.
Figure 3.
Figure 3.
Immune activation and cytokine induction during ex vivo LRA boosting. (a) Example plots of OX40+PD-L1+, OX40+CD25+, and CD69+CD40L+ expression from gated live CD4+ T cells in PBMC samples incubated with DMSO control or an αCD3/αCD28 bead positive control for 18 hours, (b) Violin plots of surface activation-induced marker (AIM) response as a function of LRA. Results across three highly sensitive AIM assays for OPHION participants’ samples (n=36) are shown for comparison, (c) Quantification of LRA-induced surface CD69 expression in live total CD4+ T cells (n=36). Intracellular production of the cytokines TNF-α, IFN-γ, and IL-2 during LRA exposure in (d) live CD4+ and (e) CD8+ T cells (n=36). Violin plot median values are indicated by a solid black line; quartiles are shown with a dotted line. LRA conditions without visible bars represent values < 0.1% of cells. *p<0.05, *** p<0.001, and **** p<0.0001 for LRA combinations, corrected for multiple comparisons. RMD, romidepsin; PNB, panobinostat; R, RMD 20nM; P, PNB 30nM; B, bryostatin 1nM; A, AZD5582 100nM.
Figure 4.
Figure 4.
LRA boosting increases histone acetylation. (a) Violin plots showing the proportion of gated live total CD4+ T cells with acetylated histone H3, assessed by flow cytometry, (b) Violin plot of mean fluorescence intensity (MFI) of acetylated histone H3 per live CD4+ T cell. Scatter plots of acetylated histone H3 levels per CD4 as a function of HIV-1 transcription in response to RMD and PNB monotherapy (c), LRA boosting with HDACi and AZD5582 (d), and HDACi in combination with low-dose bryostatin (e) are shown. Acetylated histone levels and HIV-1 reactivation with the combinations of HDACi and bryostatin were moderately positively correlated (r=.25, p=.04). Violin plot median values are indicated by a solid black line; quartiles are shown with a dotted line.
Figure 5.
Figure 5.
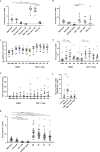
Comparative analysis of LRA boosting effects in PBMC and CD4+ T cells. Leukapheresis samples from HEAL cohort participants (n=11) were used to assess HIV-1 unspliced caRNA levels during (a) low-dose bryostatin-based and (b) AZD5582-based LRA boosting combinations in PBMC, when compared to PMA-ionomycin. Data are presented as means ± SEM. Circle color is used to denote a given HEAL participant across Figure panels. (c) Absolute HIV-1 unspliced caRNA levels in parallel PBMC and CD4+ T cell LRA exposures. PBMC and CD4 results are separated by a vertical dotted line. (d) Representation of the data in (c) as fold-change in HIV-1 caRNA levels. (e) Corresponding HIV-1 RNA levels from culture supernatants. (f) Multiply spliced HIV-1 RNA levels as determined in a modified TILDA assay, comparing RMD-bryostatin combinations at two bryostatin concentrations to PMA-ionomycin. (g) Combined OPHION and HEAL participant results (n=47) that summarize PBMC LRA boosting responses, for LRA conditions common to both datasets. Results from OPHION participant samples, carried over from Fig. 2a, are shown in grey circles. HEAL participant results are shown in color. *p<0.05, ** p<0.01, *** p<0.001, **** p<0.0001, corrected for multiple comparisons. NDC, no-drug control, contains 0.2% DMSO; PMAi, PMA with ionomycin; RMD, romidepsin; PNB, panobinostat; R, RMD 20nM; P, PNB 30nM; B, bryostatin 1nM; A, AZD5582 100nM.
Figure 6.
Figure 6.
Latency reversal polyadenylates pre-existing unspliced HIV-1 mRNA (a) Resting and total CD4+ T cell HIV-1 transcriptional profiles during PMA-ionomycin exposure. HEAL participant samples (n=10) were used to assess the effects of CD4+ T cell phenotype and cell culture density on fold-changes in HIV-1 unspliced and poly(A) transcripts during latency reversal with PMA-ionomycin. (b) Ratios of HIV-1 unspliced and poly(A) transcripts in resting and total CD4+ T cells isolated from PWH. The effects of PMA-ionomycin and cell density on HIV-1 latency reversal in (c) resting CD4+ T cells, (d) total CD4+ T cells, and (e) the specific ratios of HIV-1 caRNA production in rCD4 compared to tCD4 when plated at a density of 1 million cells/mL, are shown. A given HEAL participant is indicated by circle color. Ratios of HIV-1 caRNA are the ratios of unspliced HIV-1 caRNA to poly(A) HIV-1 mRNA. *p<0.05, ** p<0.01, corrected for multiple comparisons in panels a-d. Panel e was assessed with a Wilcoxon matched-pairs signed rank test. rCD4, resting (CD25-CD69-HLA-DR-) CD4+ T cells; tCD4, total CD4+ T cells; NDC, no drug control condition; PMA, PMA 50ng/mL with ionomycin 1μM; Poly-A, polyadenylated HIV-1 caRNA; unspliced, HIV-1 unspliced caRNA; 1m, 1million cells/mL culture media; 5m, 5 million cells/mL culture media.

Similar articles

References

    1. Chun TW, Engel D, Berrey MM, Shea T, Corey L, Fauci AS. Early establishment of a pool of latently infected, resting CD4(+) T cells during primary HIV-1 infection. Proceedings of the National Academy of Sciences of the United States of America. 1998;95(15):8869–73. - PMC - PubMed
    1. Whitney JB, Hill AL, Sanisetty S, Penaloza-MacMaster P, Liu J, Shetty M, et al. Rapid seeding of the viral reservoir prior to SIV viraemia in rhesus monkeys. Nature. 2014;512(7512):74–7. - PMC - PubMed
    1. Wong JK, Hezareh M, Gunthard HF, Havlir DV, Ignacio CC, Spina CA, et al. Recovery of replication-competent HIV despite prolonged suppression of plasma viremia. Science (New York, NY. 1997;278(5341):1291–5. - PubMed
    1. Chun TW, Stuyver L, Mizell SB, Ehler LA, Mican JA, Baseler M, et al. Presence of an inducible HIV-1 latent reservoir during highly active antiretroviral therapy. Proceedings of the National Academy of Sciences of the United States of America. 1997;94(24):13193–7. - PMC - PubMed
    1. Finzi D, Blankson J, Siliciano JD, Margolick JB, Chadwick K, Pierson T, et al. Latent infection of CD4+ T cells provides a mechanism for lifelong persistence of HIV-1, even in patients on effective combination therapy. Nature medicine. 1999;5(5):512–7. - PubMed

Publication types