. 2023 Jun 30;14(1):3867.
doi: 10.1038/s41467-023-39563-6.

Nuclear lamina strain states revealed by intermolecular force biosensor

Affiliations

Nuclear lamina strain states revealed by intermolecular force biosensor

Brooke E Danielsson et al. Nat Commun. .

Abstract

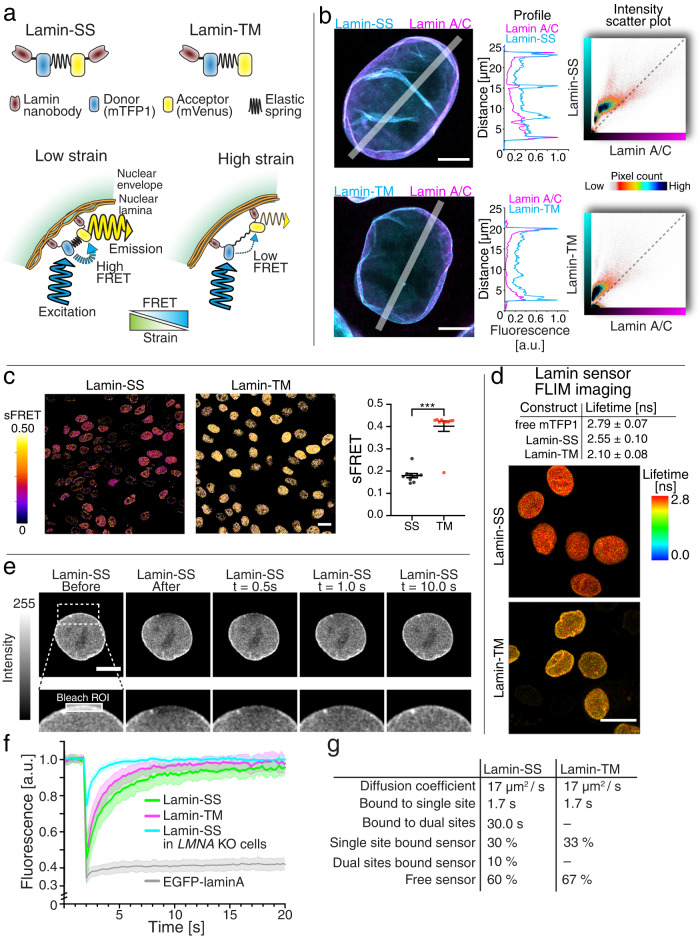
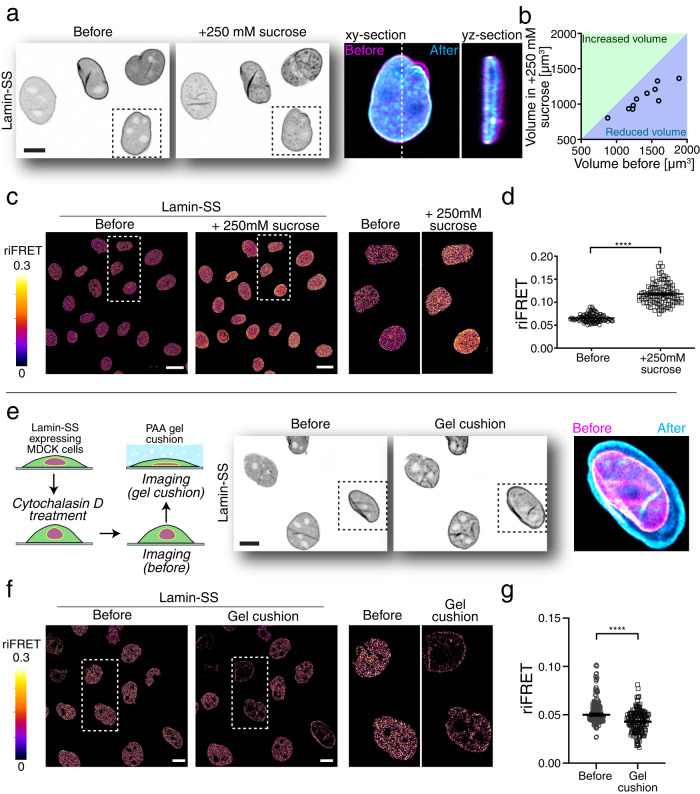
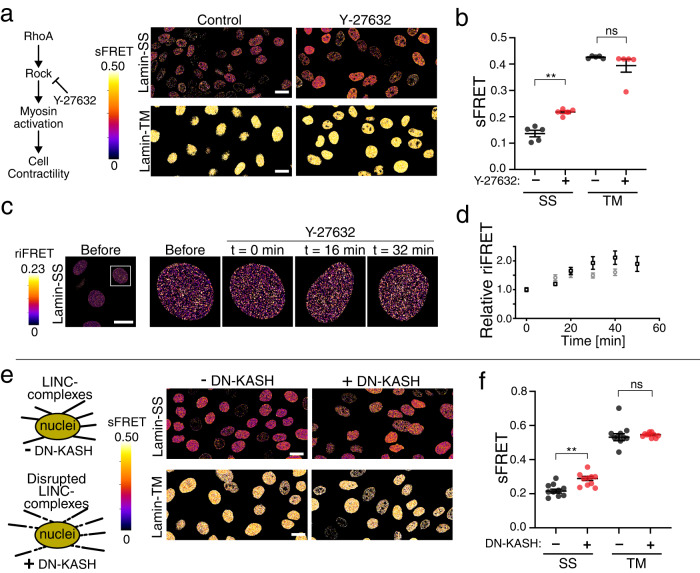
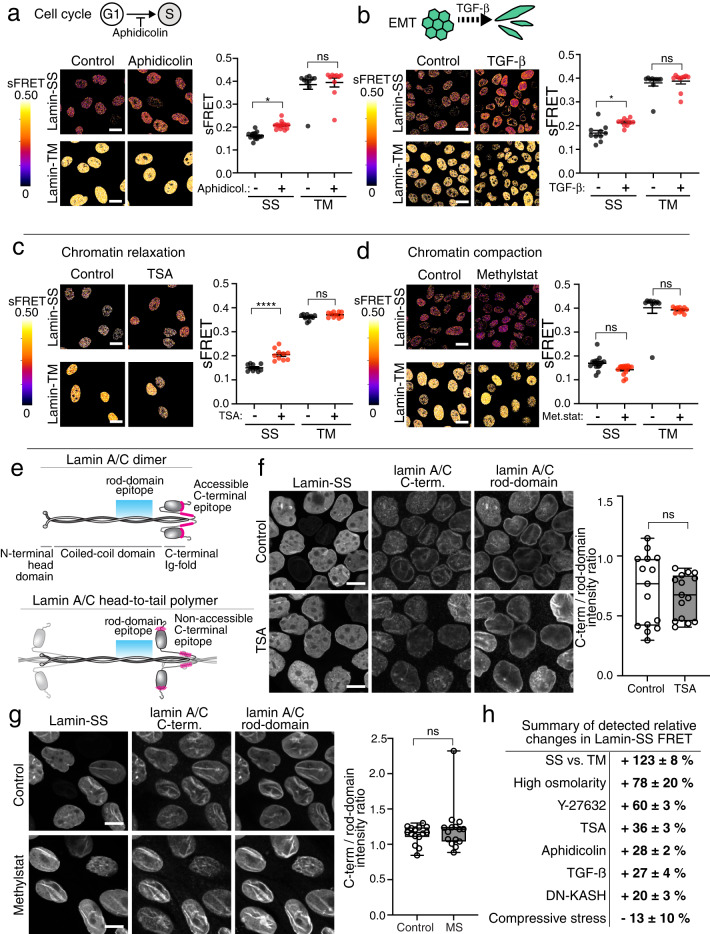
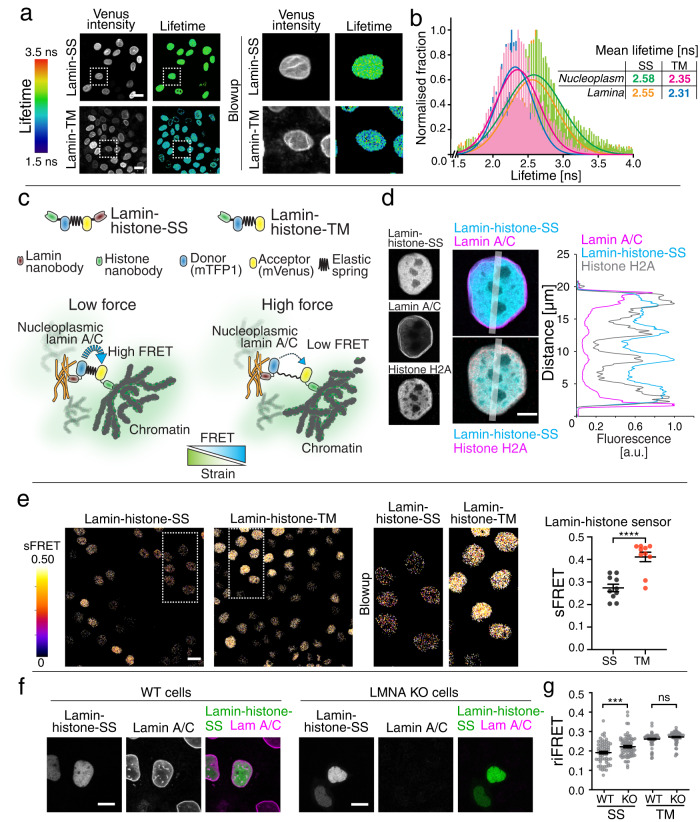
Nuclear lamins have been considered an important structural element of the nucleus. The nuclear lamina is thought both to shield DNA from excessive mechanical forces and to transmit mechanical forces onto the DNA. However, to date there is not yet a technical approach to directly measure mechanical forces on nuclear lamins at the protein level. To overcome this limitation, we developed a nanobody-based intermolecular tension FRET biosensor capable of measuring the mechanical strain of lamin filaments. Using this sensor, we were able to show that the nuclear lamina is subjected to significant force. These forces are dependent on nuclear volume, actomyosin contractility, functional LINC complex, chromatin condensation state, cell cycle, and EMT. Interestingly, large forces were also present on nucleoplasmic lamins, indicating that these lamins may also have an important mechanical role in the nucleus. Overall, we demonstrate that the nanobody-based approach allows construction of biosensors for complex protein structures for mechanobiology studies.


Conflict of interest statement

The authors declare no competing interests.

Figures

Fig. 1
Fig. 1. Development and characterization of the FRET based lamin A/C strain sensor.
a Schematic representation of the FRET -based lamin A/C strain sensor (Lamin-SS), truncated control sensor (Lamin-TM) and the working mechanism of the strain sensing. b Representative confocal Airyscan xy-sections of immunolabeled lamin A/C (magenta) together with Lamin-SS or Lamin-TM (cyan) and corresponding fluorescence line-profiles (n = 4 and n = 8 cells, respectively, two biological replicates). Scatter-plot showing correlation of fluorescence intensities between the Lamin-SS or Lamin-TM and lamin A/C. Scale bars, 5 µm. c sFRET efficiency images and quantified sFRET (mean ± SEM) of Lamin-SS and Lamin-TM sensors (n = 10 fields, two biological replicates). Scale bar 20 µm. Unpaired two-tailed Student’s t tests (***p < 0.0001, t = 8.8, df = 18, p = 0.0148). d Donor fluorescence lifetimes of free donor (mTFP1), Lamin-SS and Lamin-TM along with FLIM images of Lamin-SS and Lamin-TM expressing cells (n = 36, n = 43 and n = 42 cells, two biological replicates). Scale bar 20 µm. e Example of a FRAP experiment with Lamin-SS expressing cell. Bleached region of interest (ROI) is marked in the blow-up image. Scale bar 5 µm. f Quantified and normalized fluorescence recoveries (mean ± STDEV) of Lamin-SS (n = 18), Lamin-TM (n = 18), and EGFP-lamin A (n = 14) in WT MDCK cells and Lamin-SS recovery (n = 13) in LMNA KO cells showing differences in the recovery dynamics (all the FRAP data from 1 to 3 biological replicates). g Lamin-SS and Lamin-TM binding times and corresponding fractions based on the simulated recoveries.
Fig. 2
Fig. 2. The effect of nuclear deformation on lamin A/C strain state.
a Representative image of Lamin-SS expressing cells (left) subjected to hyper-osmotic conditions by adding medium containing 250 mM sucrose for 15 min before the imaging (middle). Single cell blow-up indicated the change in nuclear morphology before (magenta) and after (cyan) the osmotic shock (right). Scale bar 10 µm. b Scatterplot of quantified nuclei volumes indicating clear reduction of the nuclear volume. c riFRET efficiency images of osmotically stressed Lamin-SS expressing cells and blow-up images. Scale bars, 20 µm. d Quantified Lamin-SS riFRET (mean ± SEM; n = 304 cells, three biological replicates). Two-tailed Wilcoxon matched-pairs test (****p < 0.0001). Scale bar 20 µm. e Hydrogel cushion was used to impose compressive stress to Lamin-SS expressing cells. Schematic representation of the experimental workflow (left). Representative confocal images of the Lamin-SS expressing cells before (magenta) and under the gel cushion (cyan) (middle) and the subsequent change in the nuclear morphology (right). Scale bar 10 µm. f riFRET efficiency images of Lamin-SS expressing cells before and under the gel cushion together with representative blow-up images. Scale bars, 10 µm. g Quantified riFRET (mean ± SEM) in Lamin-SS expressing cells subjected to compressive stress (n = 164 cells, two biological replicates). Two-tailed Wilcoxon matched-pairs test (****p < 0.0001).
Fig. 3
Fig. 3. The effect of actomyosin contractility, actin cytoskeleton integrity and LINC complexes on nuclear force transduction.
a sFRET efficiency images of Lamin-SS and Lamin-TM after cell contractility inhibition (Y-27632, 50 µM, 1 h). Scale bars, 20 µm. b Quantified sFRET (mean ± SEM) of Lamin-SS and Lamin-TM sensors after ROCK-inhibition (n = 5 fields, 3 biological replicates). Ordinary one-way ANOVA Tukey’s multiple comparisons (for Lamin-SS (**) p = 0.005 and Lamin-TM (ns) p = 0.4132). c Lamin-SS riFRET imaging during ROCK-inhibition (Y-27632, 50 µM, added at time point 0 min). Scale bar 20 µm. d Quantified relative change (mean ± SEM) in Lamin-SS riFRET ratio during ROCK-inhibition (n = 152 cells, two biological replicates, black and gray). e Disruption of LINC complexes by dominant-negative KASH (DN-KASH) expression (induction for 24 h). sFRET efficiency images of Lamin-SS and Lamin-TM after LINC disruption. Scale bars, 20 µm. f Quantified sFRET (mean ± SEM) of Lamin-SS and Lamin-TM after LINC complex disruption (n = 10 fields, two biological replicates). Ordinary one-way ANOVA Tukey’s multiple comparisons (for Lamin-SS (**) p = 0.004 and Lamin-TM (ns) p = 0.1722).
Fig. 4
Fig. 4. The effect of cell cycle, EMT and chromatin organization on lamin A/C strain.
a Analysis of Lamin-SS and Lamin-TM sFRET (mean ± SEM) after cell cycle synchronization to early S-phase (Aphidicolin, 3 µg/mL, 24 h) (n = 10-15 fields, three biological replicates). Ordinary one-way ANOVA Tukey’s multiple comparisons (for Lamin-SS (*) p = 0.0229 and Lamin-TM (ns) p = 0.9619). b, Analysis of Lamin-SS and Lamin-TM sFRET (mean ± SEM) after EMT induction by growth factor treatment (TGF-β1, 2 ng/mL, 24 h) (n = 10 fields, two biological replicates). Ordinary one-way ANOVA Tukey’s multiple comparisons (for Lamin-SS (*) p = 0.0311 and Lamin-TM (ns) p = 0.9666). c Analysis of Lamin-SS and Lamin-TM efficiency (mean ± SEM) after treatment by histone deacetylase inhibitor (TSA, 200 nM, 4 h; n = 10 fields, three biological replicates). Ordinary one-way ANOVA Tukey’s multiple comparisons (for Lamin-SS (****) p < 0.0001 and Lamin-TM (ns) p = 0.4804. d Analysis of Lamin-SS and Lamin-TM (mean ± SEM) efficiency after treatment by histone demethylase inhibitor (methylstat, 2.5 µM, 48 h) of the cells (n = 10–15 fields, two biological replicates). Ordinary one-way ANOVA Tukey’s multiple comparisons (for Lamin-SS (ns) p = 0.2282 and Lamin-TM (ns) p = 0.9584). e Localization of epitopes for the used lamin A/C rod-domain and C-terminal antibodies. The C-terminal epitope accessibility depends on lamin filament organization. f Analysis of nuclear lamina organization in TSA-treated cells. Confocal microscopy maximum intensity projections (CM-MIP) of control (upper panels) and TSA-treated (600 nM, 4 h, lower panels) Lamin-SS expressing cells, immunolabeled against lamin A/C. Quantified fluorescence intensity ratio of lamin A/C labeling in control and TSA-treated cells (box from 25th to 75th percentile, median, whiskers from min to max, n = 15 fields, three biological replicates). Unpaired two-tailed Student’s t test ((ns) p = 0.6, t = 0.5, df=28). g Analysis of lamina organization in methylstat-treated cells. CM-MIP of control (upper panels) and methylstat -treated (2.5 µM, 48 h, lower panels) Lamin-SS expressing cells, immunolabeled against lamin A/C. Quantified fluorescence intensity ratio of lamin A/C labeling (box from 25th to 75th percentile, median, whiskers form min to max, n = 15 fields, 3 biological replicates). Unpaired two-tailed Student’s t test ((ns) p = 0.4, t = 0.9, df = 28). h Summary table of the relative changes in the quantified FRET changes in different conditions. Scale bars, ad 20 µm and fg 10 µm.
Fig. 5
Fig. 5. Mechanical strain in nucleoplasmic lamin A/C filaments.
a Representative acceptor (venus) intensity image together with donor (mTFP1) fluorescence lifetime microscopy images of Lamin-SS and Lamin-TM expressing cells. Scale bars, 20 µm. Blowup images show equal distribution of lifetimes throughout the nucleus. b Donor fluorescence lifetime histograms show highly similar lifetimes and thus FRET for nuclear rim and nucleoplasm, indicating similar strain in lamin A/C in the nuclear lamina and in the nuclear interior (n = 26 and n = 26 cells for Lamin-SS and Lamin-TM, respectively, two biological replicates). c Schematic representation of the FRET based lamin A/C - histone H2A strain sensor (Lamin-histone-SS), truncated control sensor (Lamin-histone-TM), and the working mechanism of the force sensing between lamins and chromatin. d Representative confocal Airyscan xy-sections of immunolabeled lamin A/C (top, magenta), histone H2A (magenta, bottom) and the expressed Lamin-histone-SS sensor (cyan) along with corresponding fluorescence line-profiles (n = 5 and n = 4 cells, respectively, two biological replicates). Scale bar 5 µm. e sFRET efficiency images and quantified sFRET efficiency (mean ± SEM) of Lamin-histone-SS and Lamin-histone-TM sensors (n = 10 fields, two biological replicates). Scale bar 20 µm. Unpaired two-tailed Student’s t test ((****) p < 0.0001, t = 5.14, df = 18). f WT and LMNA KO cells transiently transfected with Lamin-histone-SS. Scale bars 10 µm. g Quantified riFRET (mean ± SEM) of Lamin-histone-SS (n = 67 and n = 72 cells, respectively, two biological replicates) and Lamin-histone-TM (n = 67 and n = 78 cells, 2 biological replicates) in WT and LMNA KO cells. Ordinary one-way ANOVA Tukey’s multiple comparisons (for Lamin-histone-SS (***) p = 0.0003 and Lamin-histone-TM (ns) p = 0.4756).

Similar articles

Cited by

References

    1. Roca-Cusachs P, Conte V, Trepat X. Quantifying forces in cell biology. Nat. Cell Biol. 2017;19:742–751. doi: 10.1038/ncb3564. - DOI - PubMed
    1. Tajik, A. et al. Transcription upregulation via force-induced direct stretching of chromatin. Nat. Mater.10.1038/nmat4729 (2016). - PMC - PubMed
    1. Kirby, T. J. & Lammerding, J. Emerging views of the nucleus as a cellular mechanosensor. Nat. Cell Biol.20 373–381 (2018). - PMC - PubMed
    1. Osmanagic-Myers S, Dechat T, Foisner R. Lamins at the crossroads of mechanosignaling. Genes Dev. 2015;29:225–237. doi: 10.1101/gad.255968.114. - DOI - PMC - PubMed
    1. Dechat T, et al. Nuclear lamins: major factors in the structural organization and function of the nucleus and chromatin. Genes Dev. 2008;22:832–853. doi: 10.1101/gad.1652708. - DOI - PMC - PubMed

Publication types