. 2023 Jun 30;380(6652):1357-1362.
doi: 10.1126/science.adf5568. Epub 2023 Jun 29.

Stochastic motion and transcriptional dynamics of pairs of distal DNA loci on a compacted chromosome

Affiliations

Stochastic motion and transcriptional dynamics of pairs of distal DNA loci on a compacted chromosome

David B Brückner et al. Science. .

Abstract

Chromosomes in the eukaryotic nucleus are highly compacted. However, for many functional processes, including transcription initiation, the pairwise motion of distal chromosomal elements such as enhancers and promoters is essential and necessitates dynamic fluidity. Here, we used a live-imaging assay to simultaneously measure the positions of pairs of enhancers and promoters and their transcriptional output while systematically varying the genomic separation between these two DNA loci. Our analysis reveals the coexistence of a compact globular organization and fast subdiffusive dynamics. These combined features cause an anomalous scaling of polymer relaxation times with genomic separation leading to long-ranged correlations. Thus, encounter times of DNA loci are much less dependent on genomic distance than predicted by existing polymer models, with potential consequences for eukaryotic gene expression.


Conflict of interest statement

Competing interests: Authors declare that they have no competing interests.

Figures

Figure 1:
Figure 1:. Simultaneous tracking of DNA loci and transcriptional activity in living embryos.
(A) Typical surface view of a representative fly embryo, displaying fluorescent foci for MS2, parS, and PP7 in the corresponding blue (top), green (center), and red (bottom) channels. Top inset shows schematic with image location in the embryo; bottom inset shows a close-up. (B) Top: schematic of the gene cassettes used for three-color imaging. The endogenous eve locus (left) is tagged with MS2 stem-loops that are labeled via blue fluorescence. A reporter with an eve promoter driving PP7 transcription (labeled via red fluorescence) is integrated at a genomic separation s from the eve locus on the 2nd chromosome in the Drosophila genome. It includes a homie insulator sequence allowing loop formation through homiehomie pairing, and a parS sequence that is permanently labeled with green fluorescence. Seven such constructs were generated with varying genomic separation s (triangles). Bottom: sample inter-locus distance trajectories R(t) for six genomic separations, with standardized y-axis limits (0, 2 μm) and x-axis limits (0, 30 min), obtained following nucleus and locus segmentation, tracking, chromatic aberration, and motion correction (Methods Section 1). The sampling time interval is 28 s. (C) Trajectories of inter-locus distance R and transcriptional activity, with inferred topological states shown by the colored top bar (blue: Ooff, cyan: Poff, red: Pon; Methods Section 2). Inset: Schematic of the three topological states. (D) 200 examples of state trajectories sampled from a total set of N = 579 trajectories acquired in n = 30 embryos (genomic separation s = 149 kb). Colors as in (C); grey trajectory parts correspond to untrackable time points.
Figure 2:
Figure 2:. Scaling of interlocus distances and transcriptional activity across genomic separations.
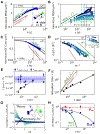
(A) Probability distributions of the inter-locus distances R. Distributions are separated by state, with paired states pooled across genomic separations, and individual distributions are shown for the open state. (B) Average inter-locus distances 〈R〉 for each of the three transcriptional states. Blue dashed line indicates a linear best fit to the Ooff data for the range of genomic separations 58–190 kb, with exponent 1/d = 0.31 ± 0.07. Dashed cyan and red lines are average values of the interlocus distances of the Poff and Pon states, respectively, with shaded areas indicating error of the mean. Solid dark green and red lines indicate predictions for ideal and crumpled polymers, respectively. (C) Survival curves S(t) of the transcriptionally active state Pon, giving the probability that transcription remains active after time t. Orange curve: data for no-homie constructs (s = 58 kb). Curves are estimated using the Kaplan-Meier estimator which accounts for censoring, which occurs if the trajectory begins or ends in the transcriptionally active state (81); shaded areas show 95% confidence intervals (Methods Section 2.4). (D) Median lifetime of the transcriptionally active state Pon as a function of genomic separation, using the Kaplan-Meier estimator (dots) and a maximum-likelihood estimator assuming exponential decay of the survival curves (triangles; Methods Section 2.4). (E) Probability of the paired on and off states conditioned on the system being in one of these two paired configurations. (F) Overall probability of the paired configurations Poff and Pon as a function of genomic separation. Grey line: best fit with exponent 0.9 ± 0.2. Green and dark red lines indicate predicted exponents for the contact probabilities of the ideal and crumpled chain polymer models.
Figure 3:
Figure 3:. Dynamics of DNA locus search and single-locus fluctuations.
(A) Single-cell inter-locus distance trajectories for the three topological states (s = 149 kb). For each state, 80 trajectories are shown, with one sample trajectory highlighted in bold. (B) Distance distributions (bar histogram) of the highlighted trajectory in panel (C) compared to the ensemble distribution obtained by averaging over all cells (line). (C) Single-cell inter-locus distance distributions (thin lines) of all trajectories in panel (C) for the three states compared to ensemble distributions in bold (s = 149 kb). Distributions are smoothed using Gaussian kernel density estimation with a width of 100 nm. Only trajectories with at least ten time points are included to ensure sufficient statistics for comparison. (D) Single-locus MSDs for all genomic separations (color code corresponds to Fig. 2A). Single-locus MSDs are calculated by estimating 3D MSDs from motion-corrected trajectories in the xy-plane of the system (Methods Section 3). Open data points correspond to a shorter imaging time interval Δt = 5.4 s (s = 149 kb). (E) Single-locus MSDs comparing enhancer (blue) and promoter (green) fluctuations (s = 149 kb). (F) Single-locus MSDs comparing fluctuations in the three states (s = 149 kb).
Figure 4:
Figure 4:. Joint dynamics of DNA locus pairs.
(A) Ideal chain Rouse prediction of the two-locus MSD M2(t) = 2Γt1/2(1−eτ/πt) + 2J erfc[(τ/πt)1/2] (26) (grey line), using best fit values Γ, J, β = 1/2, and τ = (J/Γ)2; compared to experiment (s = 595 kb). Green and red lines give expected scaling tβ for tτ for the generalized Rouse model for ideal and crumpled chains (Methods Section 5). (B) All experimental two-locus MSDs with relaxation times (dashed lines) and expected asymptotes 2〈R2〉 (solid lines; color code corresponds to Fig. 2A). (C) Scaling of the diffusion coefficients Γ from two-locus MSD fits (black dots), compared to single-locus diffusion coefficients obtained from single-locus MSDs (Fig. 3F–H). Dashed line: best fit to two-locus diffusivity with exponent 0.27 ± 0.03 (s = 58 − 595 kb); solid lines: average value of single locus diffusivities; shaded area shows error (std. calculated from total variance across separations). (D) Two-locus autocorrelation function (ACF) C2(t) = 〈R(t0) · R(t0 + t)〉t0 = 〈R2〉 − M2(t)/2 (grey) compared to data (s = 149 kb). Green and red curves indicate the power-law exponent λ = 2(1 − d)/(2 + d) of the correlation function C2(t) ~ tλ for ideal and crumpled chains for tτ, respectively (39). (E) Collapsed correlations C2 ~ C2(tsγ)/R2〉 with γ = 0.7. Inset: raw correlations C2(t) for varying genomic separation. Open data points correspond to data obtained with a higher sampling rate. (F) Scaling of inferred relaxation times compared to predicted ideal and crumpled chain exponents. Grey line: best fit with exponent γ = 0.7 ± 0.2. (G) Predicted velocity cross-correlation functions Cvv(δ)(t)=vi(δ)(t0)vj(δ)(t0+t)t0 for increasing values of the dimensionless ratio δ/τ (55). Velocities are calculated on a time-interval δ as v(δ)(t) = (x(t + δ) − x(t)). (H) Scaling of the zero-time velocity cross-correlation intercept normalized by the zero-time auto-correlation, Cvv(δ)(0)/Cv(δ)(0), for the Ooff (blue) and Pon (red) states; δ = 300 s. Green line: prediction based on ideal chain Rouse scaling of the relaxation times (γ = 2) with an intercept determined based on the 58 kb data-point; grey line: parameter-free prediction using the inferred anomalous relaxation time scaling (γ ≈ 0.7) (Methods Section 4.3); dashed red line: average correlation in the Pon state.

Update of

Similar articles

Cited by

References

    1. Walther. Flemming. Zellsubstanz, Kern Und Zelltheilung. Vogel, Leipzig, 1882.
    1. Milo R and Phillips R. Cell Biology by the Numbers. CRC Press, 2015.
    1. Stadhouders Ralph, Filion Guillaume J, and Graf Thomas. Transcription factors and 3D genome conformation in cell-fate decisions. Nature, 569(7756):345–354, 2019. - PubMed
    1. van Steensel Bas and Furlong Eileen E M. The role of transcription in shaping the spatial organization of the genome. Nature reviews. Molecular cell biology, 20(6):327–337, June 2019. - PMC - PubMed
    1. Levine Mike. Transcriptional enhancers in animal development and evolution. Current Biology, 20(17):R754–R763, 2010. - PMC - PubMed

LinkOut - more resources