MATR3-antisense LINE1 RNA meshwork scaffolds higher-order chromatin organization
- PMID: 37381832
- PMCID: PMC10398674
- DOI: 10.15252/embr.202357550
MATR3-antisense LINE1 RNA meshwork scaffolds higher-order chromatin organization
Abstract
Long interspersed nuclear elements (LINEs) play essential roles in shaping chromatin states, while the factors that cooperate with LINEs and their roles in higher-order chromatin organization remain poorly understood. Here, we show that MATR3, a nuclear matrix protein, interplays with antisense LINE1 (AS L1) RNAs to form a meshwork via phase separation, providing a dynamic platform for chromatin spatial organization. MATR3 and AS L1 RNAs affect the nuclear localization of each other. After MATR3 depletion, the chromatin, particularly H3K27me3-modified chromatin, redistributes in the cell nuclei. Topologically associating domains (TADs) that highly transcribe MATR3-associated AS L1 RNAs show decreased intra-TAD interactions in both AML12 and ES cells. MATR3 depletion increases the accessibility of H3K27me3 domains adjacent to MATR3-associated AS L1, without affecting H3K27me3 modifications. Furthermore, amyotrophic lateral sclerosis (ALS)-associated MATR3 mutants alter biophysical features of the MATR3-AS L1 RNA meshwork and cause an abnormal H3K27me3 staining. Collectively, we reveal a role of the meshwork formed by MATR3 and AS L1 RNAs in gathering chromatin in the nucleus.
Keywords: 3D genome; MATR3; amyotrophic lateral sclerosis; antisense LINE1; phase separation.
© 2023 The Authors. Published under the terms of the CC BY NC ND 4.0 license.
Conflict of interest statement
The authors declare that they have no conflict of interest.
Figures
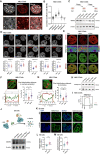
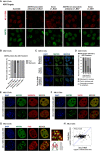
- A
Super‐resolution fluorescence microscopy images showing relative distribution between MATR3 and DAPI. Scale bars, 5 μm (Upper) or 0.5 μm (Lower). Arrows point to the representative MATR3/DAPI co‐staining regions.
- B
Coefficient of correlation between MATR3 and histone modification H3K9me3 (n = 105), H3K9me2 (n = 98), H3K27me3 (n = 107), H3K27ac (n = 97) and H3K4me3 (n = 99) in AML12 cells. Quantifications were performed on randomly selected ROIs in cell nuclei. Also see Fig EV1B. Each point represents one cell.
- C
(Upper) Schematic diagram of dox‐inducible shRNA system for MATR3 knockdown and MATR3 rescue in AML12 cells. (Lower) Western blotting detected the expression level of MATR3 after 3 days of Dox treatment (+Dox) and followed by 3 days of Dox removal (±Dox) in AML12 cells. Rep, replicate.
- D
(Upper) Representative cross‐section images showing the distribution of histone modifications upon Ctrl and MATR3 knockdown (+Dox). (Lower) Quantify the distribution pattern of histone modifications by Standard Deviation of Pixel Intensity in cell nuclei. For H3K9me3, n = 102 (Ctrl) or 84 (+Dox); for H3K9me2, n = 100 (Ctrl) or 101 (+Dox); for H3K27me3, n = 98 (Ctrl) or 98 (+Dox); for H3K27ac, n = 117 (Ctrl) or 124 (+Dox); for H3K27me3, n = 98 (Ctrl) or 98 (+Dox); for H3K4me3, n = 107 (Ctrl) or 97 (+Dox). Each point represents one cell. The P‐values were calculated using unpaired two‐tailed Student's t‐test; ns, not significant, *P < 0.05, ****P < 0.0001. Error bars indicate mean ± s.e.m.
- E
Representative cross‐section images showing nuclear localization of MATR3 and H3K27me3 upon Ctrl, MATR3 knockdown (+Dox) and MATR3 rescue (±Dox). Scale bars, 5 μm.
- F
Relative distribution of H3K27me3 and Lamin A/C. L0, region between nuclear membrane (position of nuclear membrane was determined by the X‐axis of the Lamin A/C pixel peaks on both sides). L1, region between two H3K27me3 pixel peaks that closest to the nuclear membrane. Quantify changes in H3K27me3 distribution adjacent to nuclear peripheral in Ctrl (n = 95), MATR3 knockdown (+Dox) (n = 92) and MATR3 rescue (±Dox) (n = 98) cells by formula of (L0‐L1)/2L0 (%). Scale bars, 5 μm. Each point represents one cell. The P‐values were calculated using unpaired two‐tailed Student's t‐test; ns, not significant, ****P < 0.0001. Error bars indicate mean ± s.e.m.
- G
Relative distribution of H3K27me3 and C23. N0, region between nucleolus membrane (position of nucleolus membrane was determined by the X‐axis of the half‐peaks on both sides). N1, region between two H3K27me3 pixel peaks that are closest to the nucleolus membrane. Quantify changes in H3K27me3 distribution adjacent to nucleolus in Ctrl (n = 91), MATR3 knockdown (n = 91) and MATR3 rescue (n = 92) cells by formula of (N1‐N0)/2N0 (%). Scale bars, 5 μm. Each point represents one cell. The P‐values were calculated using unpaired two‐tailed Student's t‐test; ns, not significant, ****P < 0.0001. Error bars indicate mean ± s.e.m.
- H
H3K27me3 modification level upon Ctrl and MATR3 knockdown (+Dox) as detected by western blotting. Rep, replication.
- I
Average enrichment of H3K27me3 ChIP‐seq signal at peaks regions with 5 kb upstream and downstream flanking regions in Ctrl and shMatr3 from AML12 cells.
- J
(Upper) Schematic diagram of IAA‐inducible rapid protein degradation system for MATR3 in ES cells. (Lower) Western blotting detection of the efficiency of MATR3 knockdown in ES cells after 6 h addiction of 500 μM IAA or equal volume of alcohol (−IAA). Rep, replication.
- K
Representative cross‐section images showing nuclear localization of H3K27me3 in ES cells after 6 h addiction of 500 μM IAA (+IAA 6 h) or equal volume of alcohol (−IAA). Middle: The zoom‐in view of H3K27me3 in one ES cell. The outer dotted line colocalizes with nuclear membrane; the inner dotted line has the 80% diameter of the outer dotted line. The average pixel intensity of regions within outer dotted line (ROI.o) and regions within inner dotted line (ROI.i) were measured separately for each cell. Scale bars, 5 μm.
- L
Statistics for relative intensity (ROI.o/ ROI.i) after 6 h addiction of 500 μM IAA (+IAA 6 h) (n = 46) or equal volume of alcohol (−IAA) (n = 38). Each point represents one cell. The P‐values were calculated using unpaired two‐tailed Student's t‐test; ****P < 0.0001. Error bars indicate mean ± s.e.m.
- M
Standard deviation of H3K27me3 pixel intensity after 6 h addiction of 500 μM IAA (+IAA 6 h) (n = 68) or equal volume of alcohol (−IAA) (n = 60). Each point represents one cell. The P‐values were calculated using unpaired two‐tailed Student's t‐test; ****P < 0.0001. Error bars indicate mean ± s.e.m.
- A
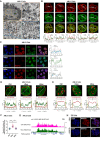
Immuno‐electron microscopy analysis of MATR3 protein distribution labeled by DAB in the AML12 cell. The solid arrows point to the individual DAB signal and the hallow arrows point to the clustered DAB signals, both of which represent MATR3 proteins. NM, nuclear membrane; Nu, nucleolus. Scale bars, (i): 2 μm; (ii): 0.5 μm; (iii), (iv): 0.2 μm.
- B
(Upper) Super‐resolution fluorescence microscopy images showing relative distribution between MATR3 and histone modifications (H3K9me3, H3K9me2, H3K27me3, H3K27ac and H3K4me3) in AML12 cells. (Lower) Line charts showing pixel intensity of each channel on the regions of interest (ROI). r, coefficient of correlation. Scale bars, 5 μm.
- C
(Left) Representative cross‐section images showing nuclear localization of MATR3 and H3K27me3 upon Ctrl, MATR3 knockdown (+Dox) and MATR3 rescue (±Dox). (Right) Line charts showing pixel intensity of each channel on the ROIs. Scale bars, 10 μm.
- D
Pixel intensity of ROIs showing relative distribution of H3K27me3 and Lamin A/C upon Ctrl, MATR3 knockdown (+Dox) and MATR3 rescue (±Dox). L0, region between nuclear membrane. L1, region between two H3K27me3 pixel peaks that closest to the nuclear membrane. Scale bars, 5 μm.
- E
Pixel intensity of ROIs showing relative distribution of H3K27me3 and C23. N0, region between nucleolus membrane (position of nucleolus membrane on X‐axis determined by C23 pixel half‐peaks on both sides). N1, region between two H3K27me3 pixel peaks that closest to the nucleolus membrane. Scale bars, 5 μm.
- F
Standard deviation of H3K27me3 pixel intensity of Ctrl (n = 98), MATR3 knockdown (+Dox) (n = 100) and MATR3 rescue (±Dox) (n = 94). The P‐values were calculated using unpaired two‐tailed Student's t‐test; *P < 0.05, ****P < 0.0001. Error bars indicate mean ± s.e.m.
- G
Genome browser of the H3K27me3 enriched region in Ctrl and MATR3 knockdown (+Dox) samples.
- H
Immunofluorescent detection of the efficiency of MATR3 knockdown in ES cells after 6 h addiction of 500 μM IAA or equal volume of alcohol (−IAA). Scale bars, 10 μm.
- A
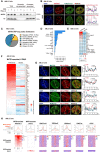
Western blotting showing the distribution of MATR3 proteins in chromatin‐non‐associated and chromatin‐associated extracts before and after DRB (75 μM for 12 h) or RNase A (pretreat with 0.05% Triton x‐100 for 30s, followed by 10 μg/ml RNase A for 1 h) treatment in AML12 cells. Representative of two independent replicates with similar results.
- B
(Left) The representative cross‐section image showing nuclear distribution of DAPI, MATR3 and H3K27me3 before and after 24 h treating of 75 μM DRB in AML12 cells. (Right) Line charts showing pixel intensity of each channel on the ROIs. r, coefficient of correlation. Scale bars, 5 μm.
- C
Pie chart showing the MATR3 RIP‐seq peaks in relation to the genomic features. For each MATR3 RIP‐seq peak, we found its overlap with the genomic features and annotated. The priority of features is TSS, UTR, exonic, intronic, repeats, intergenic and others.
- D
The number of MATR3 RIP‐seq peaks in repetitive elements (REs) from AML12 cells.
- E
Heatmap of MATR3 RIP‐seq sense and antisense signal of repetitive elements from AML12 cells. All RE copies with the RIP (MATR3 ‐IgG) count number ≥ 10 are kept. For each RE family, copies from antisense and sense of two replicates are merged. Then, compute the RIP (MATR3 ‐IgG) count number for RE copies and compute the mean count of RIP (MATR3 ‐IgG) of each sample. The color indicates the mean reads count of RIP (MATR3 ‐IgG) for each RE family.
- F
Heatmap of MATR3 RIP‐seq antisense and sense signal for MATR3 associated L1 subfamilies. L1 subfamilies are considered as MATR3 associated if the subfamily contains more than 50 copies. The copies with RIP (MATR3 ‐IgG) count number ≥ 10 are kept. L1 RNAs are ranked by antisense mean reads count. The color indicates the mean reads count of RIP (MATR3 ‐IgG) for each L1 subfamily.
- G
(Left) Representative cross‐section images showing relative distribution between AS L1 RNA with MATR3 and with histone modification marks (H3K27me3, H3K9me3 and H3K27ac) in AML12 cells. Probes for RNA FISH were designed toward the consensus sequence of antisense L1_Mus1 RNAs. (Right) Line charts showing pixel intensity of each channel on the ROIs. Scale bars, 5 μm. r, coefficient of correlation.
- H
Normalized average density of the marks (top) and heatmaps(bottom) for the two groups of L1 loci. The two groups are antisense L1 RNAs or sense L1 RNAs that interacted with MATR3. L1 loci with RIP (MATR3 ‐IgG) count number ≥ 10 of antisense RNA were identified as MATR3‐associated antisense L1, and the same cutoff for MATR3‐associated sense L1.
- A
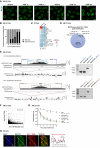
Representative cross‐section images showing distribution pattern for MATR3 in cell nuclei after 0, 1, 2, 6, 12, 24 h treating with 75 μM DRB. Scale bars, 10 μm.
- B
Statistics for MATR3 distribution pattern in cell nuclei after 0 (n = 500), 1 (n = 578), 2 (n = 560), 6 (n = 495), 12 (n = 489), 24 (n = 490) hours treating with 75 μM DRB.
- C
Heatmap of MATR3 RIP‐seq sense and antisense mean reads count in repetitive elements in ES cells. All RE copies with the RIP (MATR3 ‐IgG) count number ≥ 10 are kept. For each RE family, RE copies from antisense and sense of two replicates are merged. Then, compute the RIP (MATR3 ‐IgG) count number for RE copies and compute the mean count of RIP (MATR3 ‐IgG) of each sample.
- D
Genomic distribution of MATR3‐AS L1 RNAs loci in AML12 cells.
- E
(Left) Genome browser of the MATR3 RIP, RepeatMasker and Refseq genes. Targeting loci of the primers were noted on the screenshot. (Right) DNA gel images of RT–PCR of MATR3 RIP products (and input RNAs).
- F
Scatter plot of RIP‐seq antisense for MATR3‐associated L1 copies (AS L1) and host genes' expression. ASL1 copies that with RIP (MATR3 ‐IgG) count number ≥ 10 and located within gene body regions are kept. X‐axis: RIP (MATR3 ‐IgG) count of ASL1 copies. Y‐axis: the FPKM of ASL1's host genes as detected by RNA‐seq. Pearson correlation coefficient (PCC) between RIP (MATR3 ‐IgG) count number of ASL1 copies and FPKM of host genes.
- G
RNA decay curve for AS L1 RNAs, Neat1 RNA and Actb RNA after blocking transcription with 5 μg/ml actinomycin D before and after MATR3 depletion. RNA remaining was measured relative to 18 s RNA at 0 h by qPCR. The RNA decay assay was performed in three independent biological replicates (N = 3). Fit modeled by one‐phase decay using nonlinear least squares regression. Error bars indicate mean ± s.d.
- H
(Left) Representative cross‐section images showing relative distribution between AS L1 RNA with MATR3 in ES cells. (Right) Line charts showing pixel intensity of each channel on the ROIs. Scale bars, 5 μm.
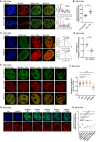
- A
Representative RNA FISH (with probes targeting antisense L1_Mus1 RNAs) and immunofluorescence images showing nuclear distribution of AS L1 RNAs and MATR3 after 24 h treating with different ASOs in AML12 cells. Scales bars, 10 μm.
- B
Statistical data for intracellular distribution of MATR3 proteins after 24 h treating with Scramble (n = 200), antisense L1_Mus1 (n = 198), sense L1_Mus1 (n = 195), antisense L1_MA7 (n = 200) and sense L1_MA7 (n = 200) in AML12 cells.
- C
The representative intracellular distribution of MATR3 proteins before and after treating with AS L1 ASOs in AML12 cells. Scales bars, 5 μm.
- D
Statistical data for intracellular distribution of MATR3 proteins after 0 h (n = 1,000), 6 h (n = 1,280), 12 h (n = 1,504) and 24 h (n = 1,430) treating with AS L1 ASOs in AML12 cells.
- E, F
The representative cross‐section image showing nuclear distribution of MATR3 and HNRNPU (E) and SAFB (F) before and after 24 h treating with antisense L1 ASOs in AML12 cells. Scales bars, 5 μm.
- G
(Left) The representative cross‐section image showing nuclear distribution of MATR3 and FUS before and after 24 h treating with antisense L1 ASOs in AML12 cells. (Right) The zoom‐in MERGE image showing relative distribution of MATR3 and FUS. Line charts showing pixel intensity of each channel on the ROIs. Scales bars, 5 μm.
- H
Scatter plot of antisense RNA expression changes in L1_Mus1 subfamily with genes expression of host between AS L1 ASO and scramble ASO treatment samples. Mus1 copies located within gene body regions are kept. X‐axis: antisense RNA expression fold changes log2(AS L1 ASO/scramble ASO) of Mus1 copies. Y‐axis: the FPKM fold changes in L1_Mus1's host genes. Pearson correlation coefficient (PCC) between antisense RNA expression changes in Mus1 copies and expression changes in host genes.
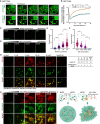
- A
(Left) The representative cross‐section image showing nuclear distribution of MATR3 and H3K27me3 before and after 12 h treating with antisense L1 ASOs in AML12 cells. (Right) Line charts showing pixel intensity of each channel on the ROIs. r, coefficient of correlation. Scale bars, 5 μm.
- B
Standard deviation of H3K27me3 pixel intensity before (n = 98) and after (n = 97) 12 h treating with antisense L1 ASOs in AML12 cells. The P‐values were calculated using unpaired two‐tailed Student's t‐test; ****P < 0.0001. Error bars indicate mean ± s.e.m.
- C
(Left) The representative cross‐section image showing nuclear distribution of H3K27me3 and AS L1 RNA before and after MATR3 knockdown (Dox treatment for 3d) in AML12 cells. (Right) The normal distribution curve for the AS L1 pixel intensity. Scale bars, 5 μm.
- D
Skewness of antisense L1 RNA pixel intensity in Ctrl (n = 63) and shMatr3 cells (n = 66). The P‐values were calculated using unpaired two‐tailed Student's t‐test; ns, ****P < 0.0001. Error bars indicate mean ± s.e.m.
- E
Representative images showing nuclear colocalization of AS L1 RNAs with wild‐type and truncated GFP‐MATR3 proteins in AML12 cells. Scale bars, 5 μm.
- F
Coefficient of correlation between AS L1 RNA with wild‐type and truncated GFP‐MATR3 proteins. WT (n = 98), ▵ZF1 (n = 83), ▵ZF2 (n = 89), ▵RRM1 (n = 91), ▵RRM2 (n = 94). The P‐values were calculated using unpaired two‐tailed Student's t‐test; *P < 0.05, ****P < 0.0001. Error bars indicate mean ± s.e.m.
- G
Representative cross‐section images showing nuclear localization of H3K27me3 upon Ctrl, MATR3 knockdown and exogenous GFP‐MATR3 (WT/▵ZF1/▵ZF2/▵RRM1/▵RRM2) overexpression in AML12 cells. Scale bars, 5 μm.
- H
Standard deviation of H3K27me3 pixel intensity upon Ctrl (n = 50), MATR3 knockdown (n = 50), GFP‐MATR3 (WT) rescue (n = 48), GFP‐MATR3 (▵ZF1) rescue (n = 47), GFP‐MATR3 (▵ZF2) rescue (n = 46), GFP‐MATR3 (▵RRM1) (n = 45) and GFP‐MATR3 (▵RRM2) rescue (n = 49). The P‐values were calculated using unpaired two‐tailed Student's t‐test; ns, not significant, **P < 0.01, ****P < 0.0001. Error bars indicate mean ± s.e.m.
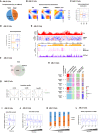
- A
Representative images of the GFP‐MATR3 (WT/▵RRM2) FRAP experiments in AML2 cells. Solid arrows indicate the bleached points. Scale bars, 5 μm.
- B
The fluorescence recovery curve of the GFP‐MATR3 (WT/▵RRM2) corrected for fluorescence decay. Data are expressed as the mean ± s.e.m. (WT, n = 11; ▵RRM2, n = 11).
- C
Representative images of droplet formation assays with different concentrations of GFP‐MATR3 proteins. NaCl concentration, 50 mM. Scale bars, 5 μm.
- D
Representative images of droplet formation assays with different NaCl concentrations. GFP‐MATR3 protein concentration, 3 μM. Scale bars, 5 μm.
- E
Areas of MATR3 protein droplets formed in different protein concentration (3 μM: n = 315; 2 μM: n = 196; 1 μM: n = 165; 0.5 μM: n = 50). The P‐values were calculated using unpaired two‐tailed Student's t‐test; ****P < 0.0001.
- F
Areas of MATR3 protein droplets formed in different NaCl concentration (50 mM: n = 248; 100 mM: n = 196; 400 mM: n = 127; 800 mM: none). The P‐values were calculated using unpaired two‐tailed Student's t‐test; ****P < 0.0001.
- G
(Left) Representative images of droplet formation assays by GFP‐MATR3 with different in vitro‐transcribed RNAs (Sense L1, Antisense L1, Sense B1, Antisense B1, MajSAT). RNA concentration, 200 nM. GFP‐MATR3 protein concentration, 3 μM. NaCl concentration, 50 mM. (Right) The table showing the nucleotide number and the number of MATR3‐binding motifs on the in vitro‐transcribed RNAs. Scale bars, 5 μm.
- H
Representative images of droplet formation assays by GFP‐MATR3 with different concentration (0, 5, 50, 200, 500 nM) of AS L1 RNAs. GFP‐MATR3 protein concentration, 3 μM. NaCl concentration, 50 mM. Scale bars, 5 μm.
- I
Schematic representation for MATR3‐MATR3 droplets formation and MATR3‐AS L1 RNA meshwork formation.
- A
Percentages of compartment status at unswitched A, unswitched B, B switched to A and A switched to B between Ctrl and shMatr3.
- B
Average contact enrichment between pairs of 100 kb loci in Ctrl, shMatr3 and the comparison between them. All the 100 kb loci are arranged by Ctrl PC1 values in decreasing order and divided into 50 quantiles. Average enrichment of PC1 values is calculated for each quantile.
- C
Changes in contacts between compartment regions from the same (AA or BB) and different (AB) type in Ctrl and shMatr3. Data are represented as boxplots based on log2(O/E‐shMatr3/O/E‐Ctrl) values per pair. The number of compartment A and B are 1,456 and 1,573. The box of the boxplot covers the 50% of the values between 1st quartile and 3rd quartile of each group; The horizontal line of box represents the median value of each group; Red dashed lines indicate the zero.
- D
Changes in contacts within A or B compartment regions between Ctrl and shMatr3. Data are represented as boxplots based on log2(O/E‐shMatr3/O/E‐Ctrl) values per compartment region. The box of the boxplot covers the 50% of the values between 1st quartile and 3rd quartile of each group; Boxplot whiskers represent the minimal and maximal values of each group; The horizontal line of box represents the median value of each group; Red dashed lines indicate the zero.
- E
Snapshot of an example region, showing Hi‐C, H3K27me3 ChIP‐seq and AS L1 in MATR3 RIP‐seq in Ctrl and/or shMatr3 samples, using HiCExplorer. The values on the y‐axis for Hi‐C contact and O/E heatmap are iced normalized read counts at 100 kb resolution. The values on the y‐axis for ChIP‐seq and RIP‐seq are average reads per million of mapped reads (RPM).
- F
Venn diagram shows the common and sample‐specific TADs between Ctrl and shMatr3 samples. The TADs that overlapped length/TAD length > 0.8 both in Ctrl and shMatr3 samples were identified as common TADs.
- G
Insulation strength at TAD boundaries within compartment A, B regions or AB boundaries.
- H
Heatmap showing six groups of TADs based on average enrichment of AS L1 MATR3 RIP‐seq signal and H3K27me3 ChIP‐seq signal from ctrl cells. Enrichment of AS L1 in MATR3 RIP‐seq classified into strong enriched (++), enriched (+) and none (−) levels. Enrichment of H3K27me3 classified into enriched (+) and none (−) levels. Average enrichment of intra‐TAD contact and PC1 is calculated for each TAD.
- I
Intra‐TAD contacts changes in TADs associated with MATR3‐AS L1 RNAs TADs and nonassociated TADs according to density of anti‐MATR3 RIP‐seq signal of AS L1 RNAs. The y‐axis showing log2 contacts changes between shMatr3 and ctrl cells. The contacts are the density of the observed contacts normalized by the density of the expected contacts. The number of TADs associated with MATR3‐AS L1 RNAs and nonassociated are 1,658 and 1,486. The box of the boxplot covers the 50% of the values between 1st quartile and 3rd quartile of each group; Boxplot whiskers represent the minimal and maximal values of each group; The horizontal line of box represents the median value of each group; Red dashed lines indicate the zero.
- J
Intra‐TAD contacts changes in TADs nonassociated with MATR3‐AS L1 RNAs and four quantile groups associated with MATR3‐AS L1 RNAs ranking by increasing in MATR3‐AS L1 RNAs density. The number of TADs nonassociated with MATR3‐AS L1 RNAs and associated four quantile groups is 1,486, 415, 415, 415, and 413. The box of the boxplot covers the 50% of the values between 1st quartile and 3rd quartile of each group; Boxplot whiskers represent the minimal and maximal values of each group; The horizontal line of box represents the median value of each group; Red dashed lines indicate the zero.
- K
Percentage of TADs located in compartment A or B regions from five TAD groups (same groups in [J]).
- L
Boxplot shows gene expression changes for TAD groups from (J). The number of genes in each group are 2,050, 2,094, 2,356, 2,071 and 1,605. The box of the boxplot covers the 50% of the values between 1st quartile and 3rd quartile of each group; Boxplot whiskers represent the minimal and maximal values of each group; The horizontal line of box represents the median value of each group; Red dashed lines indicate the zero.
- A
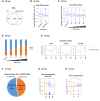
Venn diagram shows the common and sample‐specific TADs between Ctrl and MATR3‐AID samples from ES cells. The TADs that overlapped length/TAD length > 0.8 both in Ctrl and MATR3‐AID samples were identified as common TADs.
- B
Intra‐TAD contacts changes in MATR3‐AS L1 RNAs associated and nonassociated TADs from ESC cells. For each TAD, we calculate the density of the anti‐MATR3 RIP‐seq signal of AS L1 RNAs. TADs are grouped into “No AS L1” and “with AS L1” by density greater than 0 or not. The number of TADs associated with MATR3‐AS L1 RNAs and nonassociated are 2001 and 639. The box of the boxplot covers the 50% of the values between 1st quartile and 3rd quartile of each group; Boxplot whiskers represent the minimal and maximal values of each group; The horizontal line of box represents the median value of each group; Red dashed lines indicate the zero.
- C
Intra‐TAD contacts changes in TADs nonassociated with MATR3‐AS L1 RNAs and four quantile groups associated with MATR3‐AS L1 RNAs ranking by increasing in MATR3‐AS L1 RNAs density from ES cells. The number of TADs nonassociated with MATR3‐AS L1 RNAs and associated four quantile groups is 639, 500, 500, 500 and 501. The box of the boxplot covers the 50% of the values between 1st quartile and 3rd quartile of each group; Boxplot whiskers represent the minimal and maximal values of each group; The horizontal line of box represents the median value of each group; Red dashed lines indicate the zero.
- D
Percentage of TADs located in compartments A or B regions from five TAD groups (same groups in C) from ES cells.
- E
Insulation strength at TAD boundaries within compartment A, B regions or at AB boundaries of Ctrl and MATR3‐AID from ES cells.
- F
Percentages of compartment status at unswitched A, unswitched B, B switched to A and A switched to B between Ctrl and MATR3‐AID from ES cells.
- G
Changes in contacts between compartment regions from the same (AA or BB) and different (AB) type in Ctrl and MATR3‐AID from ES cells. The y‐axis showing log2 contacts changes between MATR3‐AID and ctrl cells. The contacts are the density of the observed contacts normalized by the density of the expected contacts. The box of the boxplot covers the 50% of the values between 1st quartile and 3rd quartile of each group; The horizontal line of box represents the median value of each group; Red dashed lines indicate the zero.
- H
Changes in contacts within A or B compartment regions between Ctrl and MATR3‐AID from ES cells. Data are represented as boxplots based on log2(O/E‐MATR3‐AID / O/E‐Ctrl) values per compartment region. The number of compartment A and B are 938 and 991. The box of the boxplot covers the 50% of the values between 1st quartile and 3rd quartile of each group; Boxplot whiskers represent the minimal and maximal values of each group; The horizontal line of box represents the median value of each group; Red dashed lines indicate the zero.
- A
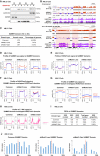
Representative Western blot on chromatin fractionation experiments of Ctrl and shMatr3 cells. Each fraction was loaded with the same number of cells. GAPDH, histone H3, Lamin A/C were used as positive controls for S1, S2 and S3, S4, respectively.
- B
Genome browser view of the SAMMY‐Seq and H3K27me3 ChIP‐seq in Ctrl and shMatr3 (replicate 1 and 2 merged) cells at a representative region. Gray boxes under each SAMMY‐seq track showing the SAMMY‐seq domains. The shadows showing the shMatr3 loss SAMMY‐seq domains.
- C
The genome coverage of SAMMY domains (S4. vs. S2) from AML12 cells. SAMMY domains are grouped into common, shMatr3‐lost and shMatr3‐gained domains by their genomic location between ctrl and shMatr3.
- D, E
Average SAMMY‐seq signal (S4 vs. S2) (D) and average H3K27me3 ChIP‐seq signal (E) around SAMMY domains (groups as in C) with 200 kb upstream and downstream flanking regions of ctrl and shMatr3 from AML12 cells.
- F, G
Average H3K27me3 ChIP‐seq signal (S4. vs. S2) (F) and average SAMMY‐seq signal (G) around H3K27me3 domains with 200 kb upstream and downstream flanking regions of ctrl and shMatr3 from AML12 cells. We calculate the overlapped region length between the H3K27me3 domains and three groups of SAMMY domains (same groups in [C]). For each H3K27me3 domain, the ratio of overlap regions (overlap length/H3K27me3 peak length) ≥ 0.6 was assigned to its overlapped SAMMY domains.
- H
Average MATR3 RIP‐seq sense and antisense signal at L1 loci around H3K27me3 domains (groups as in [F]) with 200 kb upstream and downstream flanking regions from AML12 cells.
- I
DEGs and the proportion of DEGs in relative to all genes in common, shMatr3‐lost and shMatr3‐gained SAMMY domains, respectively.
- J
Histogram plots showing the DEGs number in 100 kb bins around SAMMY domains boundaries. Y‐axis is the DEGs number in each bin.
- A
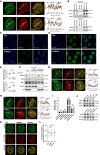
(Left) Representative cross‐section images showing relative distribution between MATR3 and PcG proteins BMI‐1 and EZH2. (Right) Line charts showing pixel intensity of each channel on the ROIs. r represents coefficient of correlation. Scale bar, 5 μm.
- B
(Upper) Western blotting of anti‐MATR3 immunoprecipitation (anti‐IgG IP as negative control) products hybridized with MATR3, EZH2 and BMI‐1 antibodies. (Lower) Western blot of anti‐EZH2 immunoprecipitation (anti‐IgG IP as negative control) products hybridized with EZH2 and MATR3 antibodies.
- C, D
The representative cross‐section image showing nuclear distribution of BMI‐1 (C) and EZH2 (D) in Ctrl and shMatr3 (+Dox 3d) cells. Scale bar, 10 μm.
- E
(Upper) Standard deviation of BMI‐1 pixel intensity upon Ctrl (n = 86) and shMatr3 (+Dox 3d) (n = 89) cells. ****P < 0.0001, Student's t‐test. Error bars represent SD. (Lower) Standard deviation of EZH2 pixel intensity upon Ctrl (n = 86) and shMatr3 (+Dox 3d) (n = 97) cells. The P‐values were calculated using unpaired two‐tailed Student's t‐test; ****P < 0.0001. Error bars indicate mean ± s.e.m.
- F
Western blotting showing the distribution of BMI‐1 and EZH2 proteins in chromatin‐non‐associated and chromatin‐associated extracts before and after MATR3 knockdown (+Dox 3d) in AML12 cells. Representative of two independent replicates with similar results.
- G, H
(Left) The representative cross‐section image showing nuclear distribution of BMI‐1 (G) and EZH2 (H), and colocalization with H3K27me3 upon Ctrl and MATR3 knockdown (+Dox 3d). (Right) Line charts showing pixel intensity of each channel on the ROIs. r, coefficient of correlation Scale bar, 5 μm.
- I
The RNA level of Gapdh, Malat1, Neat1 and Hnf1aos1 in anti‐EZH2 RIP products relative to that in anti‐IgG RIP products as detected by RT–qPCR. For each sample, the relative RNA level was normalized to Actb. The RIP–qPCR assay was performed in six independent biological replicates (n = 6). The P‐values were calculated using unpaired two‐tailed Student's t‐test; ns, not significant. Error bars indicate mean ± s.d.
- J
(Upper) Western blotting showing the protein level of MATR3 and BMI‐1 in shCtrl and shBmi‐1 cells; (Lower) Western blotting showing the protein level of MATR3 and EZH2 in shCtrl and shEzh2 cells.
- K
The representative images showing nuclear colocalization of MATR3 with AS L1 RNA in shCtrl, shBMI‐1 and shEZH2 AML12 cells. Scales bar, 5 μm.
- L
Coefficient of correlation between MATR3 and AS L1 RNA in shCtrl (n = 42), shBMI‐1 (n = 48) and shEZH2 (n = 46) AML12 cells. The P‐values were calculated using unpaired two‐tailed Student's t‐test; ns, not significant. Error bars indicate mean ± s.e.m.
- A
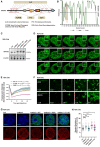
Schematic diagram of degenerative‐disease‐associated mutations on MATR3 protein.
- B
The order/disorder regions of MATR3 (WT/S85C/F115C) protein predicted by the PONDR algorithm.
- C
MATR3 knockdown and GFP‐tagged WT/S85C/F115C MATR3 protein replacement in N2A cells. The efficiency of endogenous MATR3 knockdown and exogenous GFP‐MATR3 (WT/S85C/F115C) overexpression as detected by western blotting. Representative of two independent replicates with similar results.
- D
Representative images of the GFP‐MATR3 (WT/S85C/F115C) FRAP experiments in N2A cells. Solid arrows point to the bleached points. Scale bars, 5 μm.
- E
The fluorescence recovery curve of the GFP‐MATR3 (WT/S85C/F115C) corrected for fluorescence decay in N2A cells. Data are expressed as the mean ± s.e.m. (n = 9).
- F
Representative images of droplet formation assays with different concentrations of GFP‐hMATR3 (WT/S85C) proteins. NaCl concentration, 50 mM. Scale bars, 3 μm.
- G
Representative cross‐section images showing nuclear localization of H3K27me3 upon Ctrl, MATR3 knockdown and exogenous MATR3 (WT/S85C/F115C) overexpression in N2A cells. Scale bars, 5 μm.
- H
Standard deviation of H3K27me3 pixel intensity upon Ctrl (n = 93), MATR3 knockdown (n = 100), GFP‐MATR3 (WT) rescue (n = 104), GFP‐MATR3 (S85C) rescue (n = 82) and GFP‐MATR3 (F115C) rescue (n = 120). The P‐values were calculated using unpaired two‐tailed Student's t‐test; ns, not significant, *P < 0.05, ****P < 0.0001. Error bars indicate mean ± s.e.m.

Similar articles
-
N-terminal sequences in matrin 3 mediate phase separation into droplet-like structures that recruit TDP43 variants lacking RNA binding elements.Lab Invest. 2019 Jul;99(7):1030-1040. doi: 10.1038/s41374-019-0260-7. Epub 2019 Apr 24. Lab Invest. 2019. PMID: 31019288 Free PMC article.
-
MATR3's Role beyond the Nuclear Matrix: From Gene Regulation to Its Implications in Amyotrophic Lateral Sclerosis and Other Diseases.Cells. 2024 Jun 5;13(11):980. doi: 10.3390/cells13110980. Cells. 2024. PMID: 38891112 Free PMC article. Review.
-
Matrin 3-dependent neurotoxicity is modified by nucleic acid binding and nucleocytoplasmic localization.Elife. 2018 Jul 17;7:e35977. doi: 10.7554/eLife.35977. Elife. 2018. PMID: 30015619 Free PMC article.
-
Replication study of MATR3 in familial and sporadic amyotrophic lateral sclerosis.Neurobiol Aging. 2016 Jan;37:209.e17-209.e21. doi: 10.1016/j.neurobiolaging.2015.09.013. Epub 2015 Sep 28. Neurobiol Aging. 2016. PMID: 26493020
-
Matrin 3 in neuromuscular disease: physiology and pathophysiology.JCI Insight. 2021 Jan 11;6(1):e143948. doi: 10.1172/jci.insight.143948. JCI Insight. 2021. PMID: 33427209 Free PMC article. Review.
Cited by
-
Hepatocellular carcinoma-specific epigenetic checkpoints bidirectionally regulate the antitumor immunity of CD4 + T cells.Cell Mol Immunol. 2024 Nov;21(11):1296-1308. doi: 10.1038/s41423-024-01215-0. Epub 2024 Sep 19. Cell Mol Immunol. 2024. PMID: 39300319
-
Liver matrin-3 protects mice against hepatic steatosis and stress response via constitutive androstane receptor.Mol Metab. 2024 Aug;86:101977. doi: 10.1016/j.molmet.2024.101977. Epub 2024 Jun 25. Mol Metab. 2024. PMID: 38936659 Free PMC article.
-
The role of Matrin-3 in physiology and its dysregulation in disease.Biochem Soc Trans. 2024 Jun 26;52(3):961-972. doi: 10.1042/BST20220585. Biochem Soc Trans. 2024. PMID: 38813817 Free PMC article. Review.
-
Matrin3 mediates differentiation through stabilizing chromatin loop-domain interactions and YY1 mediated enhancer-promoter interactions.Nat Commun. 2024 Feb 10;15(1):1274. doi: 10.1038/s41467-024-45386-w. Nat Commun. 2024. PMID: 38341433 Free PMC article.
-
Skipper analysis of eCLIP datasets enables sensitive detection of constrained translation factor binding sites.Cell Genom. 2023 May 4;3(6):100317. doi: 10.1016/j.xgen.2023.100317. eCollection 2023 Jun 14. Cell Genom. 2023. PMID: 37388912 Free PMC article.
References
-
- Berezney R, Coffey DS (1974) Identification of a nuclear protein matrix. Biochem Biophys Res Commun 60: 1410–1417 - PubMed
Publication types
MeSH terms
Substances
LinkOut - more resources
Full Text Sources
Medical
Research Materials
Miscellaneous

