Celastrol Combats Methicillin-Resistant Staphylococcus aureus by Targeting Δ1 -Pyrroline-5-Carboxylate Dehydrogenase
- PMID: 37381655
- PMCID: PMC10477891
- DOI: 10.1002/advs.202302459
Celastrol Combats Methicillin-Resistant Staphylococcus aureus by Targeting Δ1 -Pyrroline-5-Carboxylate Dehydrogenase
Abstract
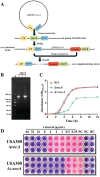
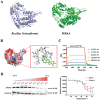
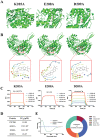
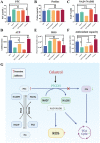
The emergence and rapid spread of methicillin-resistant Staphylococcus aureus (MRSA) raise a critical need for alternative therapeutic options. New antibacterial drugs and targets are required to combat MRSA-associated infections. Based on this study, celastrol, a natural product from the roots of Tripterygium wilfordii Hook. f., effectively combats MRSA in vitro and in vivo. Multi-omics analysis suggests that the molecular mechanism of action of celastrol may be related to Δ1 -pyrroline-5-carboxylate dehydrogenase (P5CDH). By comparing the properties of wild-type and rocA-deficient MRSA strains, it is demonstrated that P5CDH, the second enzyme of the proline catabolism pathway, is a tentative new target for antibacterial agents. Using molecular docking, bio-layer interferometry, and enzyme activity assays, it is confirmed that celastrol can affect the function of P5CDH. Furthermore, it is found through site-directed protein mutagenesis that the Lys205 and Glu208 residues are key for celastrol binding to P5CDH. Finally, mechanistic studies show that celastrol induces oxidative stress and inhibits DNA synthesis by binding to P5CDH. The findings of this study indicate that celastrol is a promising lead compound and validate P5CDH as a potential target for the development of novel drugs against MRSA.
Keywords: MRSA; P5CDH; celastrol; multi-omics; multiple pathways.
© 2023 The Authors. Advanced Science published by Wiley-VCH GmbH.
Conflict of interest statement
Shuguang Yuan is the cofounder of AlphaMol Science Ltd.
Figures


Similar articles
-
Structural determinants of oligomerization of δ(1)-pyrroline-5-carboxylate dehydrogenase: identification of a hexamerization hot spot.J Mol Biol. 2013 Sep 9;425(17):3106-20. doi: 10.1016/j.jmb.2013.05.027. Epub 2013 Jun 7. J Mol Biol. 2013. PMID: 23747974 Free PMC article.
-
Crystal structure of Thermus thermophilus Delta1-pyrroline-5-carboxylate dehydrogenase.J Mol Biol. 2006 Sep 22;362(3):490-501. doi: 10.1016/j.jmb.2006.07.048. Epub 2006 Jul 29. J Mol Biol. 2006. PMID: 16934832
-
Δ(1)-pyrroline-5-carboxylate/glutamate biogenesis is required for fungal virulence and sporulation.PLoS One. 2013 Sep 9;8(9):e73483. doi: 10.1371/journal.pone.0073483. eCollection 2013. PLoS One. 2013. PMID: 24039956 Free PMC article.
-
A Mechanistic Overview of Triptolide and Celastrol, Natural Products from Tripterygium wilfordii Hook F.Front Pharmacol. 2018 Feb 14;9:104. doi: 10.3389/fphar.2018.00104. eCollection 2018. Front Pharmacol. 2018. PMID: 29491837 Free PMC article. Review.
-
Novel sulfonamide derivatives as a tool to combat methicillin-resistant Staphylococcus aureus.Future Med Chem. 2024 Mar;16(6):545-562. doi: 10.4155/fmc-2023-0116. Epub 2024 Feb 13. Future Med Chem. 2024. PMID: 38348480 Review.
Cited by
-
Insights into small-molecule compound CY-158-11 antibacterial activity against Staphylococcus aureus.mSphere. 2024 Oct 29;9(10):e0064324. doi: 10.1128/msphere.00643-24. Epub 2024 Sep 23. mSphere. 2024. PMID: 39311583 Free PMC article.
-
Zidovudine in synergistic combination with nitrofurantoin or omadacycline: in vitro and in murine urinary tract or lung infection evaluation against multidrug-resistant Klebsiella pneumoniae.Antimicrob Agents Chemother. 2024 Oct 8;68(10):e0034424. doi: 10.1128/aac.00344-24. Epub 2024 Aug 28. Antimicrob Agents Chemother. 2024. PMID: 39194261 Free PMC article.
-
Reducing Peptidoglycan Crosslinking by Chemical Modulator Reverts β-lactam Resistance in Methicillin-Resistant Staphylococcus aureus.Adv Sci (Weinh). 2024 Jul;11(28):e2400858. doi: 10.1002/advs.202400858. Epub 2024 May 15. Adv Sci (Weinh). 2024. PMID: 38747156 Free PMC article.
-
Identification of isothiazolones analogues as potent bactericidal agents against antibiotic resistant CRE and MRSA strains.BMC Chem. 2023 Dec 16;17(1):183. doi: 10.1186/s13065-023-01100-3. BMC Chem. 2023. PMID: 38104171 Free PMC article.
References
Publication types
MeSH terms
Substances
Grants and funding
- 32072908/National Natural Science Foundation of China
- CARS-35/China Agriculture Research System of the MOF
- Shenzhen Key Laboratory of Computer-Aided Drug Discovery
- ZDSYS20201230165400001/Chinese Academy of Sciences, Shenzhen, Guangdong
- JCYJ20200109114818703/Chinese Academy of Sciences, Shenzhen, Guangdong
LinkOut - more resources
Full Text Sources
Medical
Miscellaneous
