. 2023 Aug 11;51(14):7288-7313.
doi: 10.1093/nar/gkad538.

CDK8 and CDK19: positive regulators of signal-induced transcription and negative regulators of Mediator complex proteins

Affiliations

CDK8 and CDK19: positive regulators of signal-induced transcription and negative regulators of Mediator complex proteins

Mengqian Chen et al. Nucleic Acids Res. .

Abstract

We have conducted a detailed transcriptomic, proteomic and phosphoproteomic analysis of CDK8 and its paralog CDK19, alternative enzymatic components of the kinase module associated with transcriptional Mediator complex and implicated in development and diseases. This analysis was performed using genetic modifications of CDK8 and CDK19, selective CDK8/19 small molecule kinase inhibitors and a potent CDK8/19 PROTAC degrader. CDK8/19 inhibition in cells exposed to serum or to agonists of NFκB or protein kinase C (PKC) reduced the induction of signal-responsive genes, indicating a pleiotropic role of Mediator kinases in signal-induced transcriptional reprogramming. CDK8/19 inhibition under basal conditions initially downregulated a small group of genes, most of which were inducible by serum or PKC stimulation. Prolonged CDK8/19 inhibition or mutagenesis upregulated a larger gene set, along with a post-transcriptional increase in the proteins comprising the core Mediator complex and its kinase module. Regulation of both RNA and protein expression required CDK8/19 kinase activities but both enzymes protected their binding partner cyclin C from proteolytic degradation in a kinase-independent manner. Analysis of isogenic cell populations expressing CDK8, CDK19 or their kinase-inactive mutants revealed that CDK8 and CDK19 have the same qualitative effects on protein phosphorylation and gene expression at the RNA and protein levels, whereas differential effects of CDK8 versus CDK19 knockouts were attributable to quantitative differences in their expression and activity rather than different functions.


Figures

Graphical Abstract
Graphical Abstract
Figure 1.
Figure 1.
Effects of CDK8 and CDK19 expression and kinase activity on protein expression of Mediator kinase module components. (A) Scheme of generating CDK8/19 single- and double-knockout and reconstitution derivatives in 293 cells. (B) Immunoblotting analysis of CDK8/19 derivatives in 293 cells for CDK8, CDK19, CCNC, MED12, MED13 and GADPH (normalization standard). (C) Parental (WT) and dKO cells were treated with 0.1% DMSO (Ctrl) or proteasome inhibitors (5 μM MG132, 5 μM MG115 or 5 μM Bortezomib (BTZ)) for 18 h and analyzed by immunoblotting for CDK8, CDK19, CCNC and GAPDH.
Figure 2.
Figure 2.
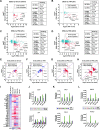
RNA-Seq analysis of the effects of CDK8 and CDK19 knockout and re-expression on gene expression. (A) Volcano plots of comparisons of gene expression between 293 dKO cells reconstituted with WT CDK8 or CDK19 relative to the corresponding vector-transduced dKO controls. Red dots: DEGs passing the selection criteria (FC > 1.5; FDR < 0.05). Black circles: high-confidence DEGs that pass the selection criteria (average FC > 1.5; FDR < 0.05 in both series of reconstitution derivatives, see Supplementary Figure S1A). (B) Volcano plots of comparisons of gene expression between parental 293 (WT) cells overexpressing wild-type CDK8 or CDK19 relative to the corresponding vector-transduced WT controls. (C, D) Volcano plots of comparisons of gene expression between 293 dKO (C) or WT cells (D) expressing kinase-inactive CDK8 (8M) or CDK19 (19M) mutants relative to the corresponding vector-transduced controls. (E) Heatmap of 429 high-confidence DEGs regulated by CDK8/19 reconstitution in dKO cells in 293 derivatives (hierarchical clustering). (F, G) Comparison of the effects of CDK8 versus CDK19 reconstitution in dKO cells on the high-confidence CDK8/19-regulated DEGs in two different series of reconstitution derivatives. (H) Overlap of DEGs affected by CDK8 or CDK19 reconstitution in dKO cells; P-value determined by hypergeometric test. (I) Comparison of the effects of kinase-inactive CDK8 versus kinase-inactive CDK19 expression in parental cells on the high-confidence CDK8/19-regulated DEGs. Slope and Pearson correlation coefficients (r) were calculated by linear regression and correlation analysis.
Figure 3.
Figure 3.
RNA-Seq analysis of the effects of CDK8/19 inhibitor treatment on gene expression. (A) Volcano plots of the effects of treatment with 1 μM Senexin B on gene expression in the parental (WT) cells (above) and their dKO derivative (below) for the indicated periods of time. Red dots: DEGs passing the selection criteria (FC > 1.5; FDR < 0.05). Black circles: high-confidence DEGs that pass the selection criteria (average FC > 1.5; FDR < 0.05 in all independently analyzed batches, see Supplementary Figure S1C). (B) Overlap of DEGs affected by Senexin B or by CDK8 or CDK19 expression. (C) Effects of 3-h Senexin B treatment on the expression of 46 high-confidence early-response DEGs in different batches of parental cells and the indicated derivatives. (D) Heatmap of 436 high-confidence DEGs regulated by Senexin B (at either 3, 24 or 72 h time points) at different timepoints of Senexin B treatment and in different 293 derivatives. (E, F) Comparison of the effects of CDK8 versus CDK19 reconstitution in dKO cells on the 436 high-confidence Senexin B-regulated DEGs in two different series of reconstitution derivatives. Slope and Pearson correlation coefficients (r) were calculated by linear regression and correlation analysis. (G) Heatmap of 429 DEGs regulated by CDK8/19 reconstitution in dKO cells at different timepoints of Senexin B treatment.
Figure 4.
Figure 4.
Effects of a CDK8/19-degrading PROTAC. (A) Chemical structure of the CDK8/19-degrading PROTAC SNX7886. (B) Immunoblotting analysis of CDK8, CDK19 and CCNC expression in 293 cells treated for 24 h with BI1347 or SNX7886 at the indicated concentrations. (C) Volcano plots of the effects of 72-hr treatment with 200 nM SNX7886 versus vehicle control (parental (WT) cells), 200 nM SNX7886 versus 200nM BI1347 (parental cells) and 200 nM SNX7886 versus vehicle control (dKO cells). (D) Overlap of DEGs affected by BI1347 or SNX7886 treatment. (E) Heatmap of 82 DEGs differentially affected by SNX7886 and BI1347 in WT cells under indicated conditions. (F) Heatmap of DEGs that are affected by Senexin B or CDK8/19 expression (see Supplementary Figure S4A) and regulated by SNX7886 under indicated conditions. (G) Overlap of DEGs affected by SNX7886 treatment or dKO. (H) Heatmap of the genes regulated by all CDK8/19 inhibitors or PROTAC but not by dKO under indicated conditions.
Figure 5.
Figure 5.
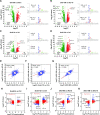
Transcriptomic analysis of the effects of Mediator kinases on signal-regulated gene expression. (A–D) RNA-Seq analysis of 293 cells treated with the indicated signals in the presence or in the absence of 1 μM Senexin B (SnxB), added 1 h before signal stimulation and maintained till the end of experiment. (A) Cells were serum starved for 48 h and then treated with serum (FBS added to 10% final concentration) for 30 min. (B–D) Cells were treated with TNF (10 ng/ml) for 2 h (B) or PMA (30 nM) for 2 h (C) or 24 h (D). The dot plots show the effects of Senexin B treatment on the signal-affected DEGs (FC > 1.5; FDR < 0.05). Red dots: Senexin B-affected DEGs. Blue dots: Senexin B-unaffected DEGs. The tables on the right show the number and percentage of signal-regulated DEGs affected by Senexin B treatment. (E–H) Comparison of effects of Senexin B on the expression of genes regulated by Senexin B either under basal conditions or upon signal stimulation. Red circles: signal-regulated genes. Blue circles: genes that are not regulated by signals. (I) Effects of different signals on the expression of 46 DEGs regulated by Senexin B at 3 h time point under basal conditions. (J–L) qPCR analysis of mRNA expression of the indicated genes in dKO derivatives with or without signal or Senexin B: serum stimulation (J), TNF (K), PMA (24 h) (L). Data are presented as mean ± SEM (n = 3). Asterisks: P < 0.01 (two-way ANOVA, Tukey's multiple comparisons test) for the differences between Senexin B-treated and untreated conditions.
Figure 6.
Figure 6.
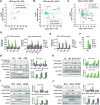
Effects of Mediator kinases on IFNγ-regulated gene expression and STAT1 S727 phosphorylation. (A, B) RNA-Seq analysis of 293 (A) and HAP1 cells (B) treated with 1 μM Senexin B (SnxB), 10 ng/ml IFNγ (4 h) or SnxB + IFNγ combination (in biological triplicates). The dot plots show the effects of Mediator kinase inhibition on the IFNγ-regulated DEGs (FC > 1.5; FDR < 0.05). Red dots: Senexin B-affected DEGs. Blue dots: Senexin B-unaffected DEGs. (C) Analysis of RNA-Seq data from (12) for the effects of cortistatin A (CA) on IFNγ-regulated genes in MEF cells, treated with 100 nM CA, 10 ng/ml IFNγ or CA/ IFNγ combination for 6 h (in biological replicates, n ≥ 2). The dot plots show the effects of CA on the IFNγ-regulated DEGs (FC > 1.5; FDR < 0.05). Red dots: CA-affected DEGs. Blue dots: CA-unaffected DEGs. (D, E) qPCR analysis of STAT1 RNA in 293 (D) or HAP1 (E) derivatives treated with or without 10 ng/ml IFNγ (4 h) or 1 μM Senexin B. Data are presented as mean ± SEM (n = 3). Asterisks: P < 0.01 (two-way ANOVA, Tukey's multiple comparisons test) for the differences between Senexin B-treated and untreated conditions. (F) Expression of STAT1 RNA in MEF cells treated with or without IFNγ (6 h) or CA, presented as mean ± SEM (n ≥ 2) based on TPM values of RNA-Seq data from (12). (G) Parental (WT) 293 and their 8KO and 19KO derivatives were treated with 1 μM Senexin B, 5 ng/ml IFNγ or Senexin B/IFNγ combination for 5 h and analyzed by immunoblotting for phosphorylated STAT1 (S727 or Y701), STAT1, CDK8, CDK19 and GADPH. (H) Parental (WT) 293, and their dKO, dKO-8 and dKO-19 derivatives were treated with 0, 1 and 5 ng/ml recombinant IFNγ for 5 h and analyzed as in (G). (I) dKO derivatives dKO-V, dKO-8 and dKO-8M were treated and analyzed as in (G). (J) dKO derivatives dKO-V, dKO-19 and dKO-19M were treated and analyzed as in (G). Bar diagrams on the right represent mean densitometry signals from duplicate experiments.
Figure 7.
Figure 7.
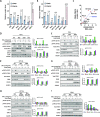
Expression of CDK8 and CDK19 proteins and effects of CDK8 and CDK19 knockout and re-expression on STAT1 S727 phosphorylation in different cell lines. (A) Relative protein levels of CDK8 and CDK19, normalized to CDK8 protein level in 293 cells, in different cell lines, determined as shown in Supplementary Figure S6. Data are presented as mean ± SEM of biological triplicates. Ratios of CDK8 to CDK19 for each cell line are shown on top of the bars. (B) RNA levels of CDK8 and CDK19 in different cell lines (RPKM, Reads Per Kilobase, per Million mapped reads) from RNA-Seq in this study (293 cells) and from CCLE database (all the other cell lines). (C) Correlation of CDK8:CDK19 ratios between RNA and protein levels among different cell lines. (D) HAP1 (WT) and their CDK8 or CDK19 single- or double-knockout derivatives (8KO, 19KO, dKO) were treated with 1 μM Senexin B, 10 ng/ml recombinant IFNγ, or Senexin B/IFNγ combination for 5 hrs before immunoblotting analysis for phosphorylated STAT1 (S727 or Y701), STAT1, CDK8, CDK19, CCNC and GADPH. (E) HeLa (WT) and their CDK8 or CDK19 single-knockout derivatives (8KO or 19KO) were treated with 1 μM Senexin B, 5 ng/ml recombinant IFNγ, or Senexin B + IFNγ combination for 5 hrs and analyzed as in (D). (F) HCT116 (WT) and their CDK8 or CDK19 single-knockout derivative (8KO or 19KO) were treated with 1 μM Senexin B, 10 ng/ml recombinant IFNγ, or Senexin B + IFNγ combination for 1 hr before Immunoblotting analysis. (G) HCT116-8KO and their reconstitution derivatives (8KO-8, 8KO-K19) were treated and analyzed as in (D). (H) HCT116-8KO and their reconstitution derivatives (8KO-8M, 8KO-19M) were treated and analyzed as in (D). (I) 22Rv1 (WT) and their CDK8 and CDK19 single- or double-knockout derivatives (8KO, 19KO, dKO) were treated with 1 μM Senexin B, 20 ng/ml recombinant IFNγ, or Senexin B/IFNγ combination for 5 h and analyzed as in (D). Bar diagrams on the right in (D–I) represent mean densitometry signals from duplicate experiments.
Figure 8.
Figure 8.
Effects of CDK8/19 inhibitor treatment and CDK8/19 knockout or expression on gene expression in different cell lines. (A) HCT116 (WT) cells and their 8KO, 8KO-8 and 8KO-19 derivatives were treated with or without 1 μM Senexin B for 5 h before RNA extraction and qPCR analysis of EGR1, KLF2 and CSRNP1 mRNA. (B) HAP1 (WT) cells and their 8KO, 19KO and dKO derivatives were treated with or without 1 μM Senexin B for 5 h before RNA extraction and qPCR analysis of MVD and ID3 mRNA. (C) 22Rv1 (WT) cells and their CDK8 8KO, 19KO and dKO derivatives were treated with or without 1 μM Senexin B for 24 hrs before RNA extraction and qPCR analysis of EGR1, JUN and BTG1 mRNA. Data are presented as mean ± SEM (n = 3). Asterisks: P < 0.01 (two-way ANOVA, Tukey's multiple comparisons test) for the differences between Senexin B-treated and untreated conditions.
Figure 9.
Figure 9.
Proteomic analysis of the effects of CDK8 and CDK19 kinase inhibition. Tandem Mass Tag (TMT) based proteomic analysis was carried out for the effects of CDK8 and CDK19 kinase inhibition across three TMT-11plex batches: dKO-8 vs dKO-8M, dKO-19 versus dKO-19M and parental 293 cells treated with DMSO (Ctrl), Senexin B (3 h) or Senexin B (72 h). (A) Comparison of the effects of CDK8 kinase domain mutation (dKO-8M versus dKO-8) on the RNA and protein levels for the genes differentially expressed at the protein level. Red dots: genes whose RNA expression levels differ <1.3-fold. Blue dots: genes whose RNA expression levels differ ≥1.3-fold. (B) Comparison of the effects of CDK19 kinase domain mutation (dKO-19M versus dKO-19) on the RNA and protein levels as in (A). (C) Comparison of the effects of CDK8 and CDK19 kinase domain mutations on the expression of proteins affected ≥1.3-fold at the RNA level. (D) Comparison of the effects of CDK8 and CDK19 kinase domain mutations on the expression of proteins affected <1.3-fold at the RNA level. (E) Comparison of the effects of 72-h treatment with Senexin B on the RNA and protein levels as in (A). (F) Comparison of the effects of 3- and 72-h Senexin B treatment for the proteins affected <1.3-fold at the RNA level. Slope and Pearson correlation coefficients (r) in were calculated by linear regression and correlation analysis for (A–F). (G) Heatmap of the effects of Senexin B treatment (3 or 72 h) and CDK8 or CDK19 kinase domain mutations on the protein and RNA levels for the genes regulated by CDK8/19 kinase activity at the post-transcriptional level and detected in all the protein batch comparisons. (H) The same heatmap for all the components of the kinase module and the core Mediator complex (grey: protein not detected). (I) Expression of the indicated proteins in parental 293 cells, untreated or treated with 1 μM Senexin B, Senexin C or 15w for 24 h and in untreated 293-dKO cells.
Figure 10.
Figure 10.
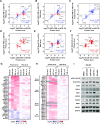
Phosphoproteomic analysis of the effects of CDK8 and CDK19 kinase inhibition. Tandem Mass Tag (TMT) based phosphoproteomic analysis was carried out for the effects of CDK8 and CDK19 kinase inhibition across the same three TMT-11plex batches as in Figure 9. (A–D) Volcano plots of phosphoepitope changes (left) and results of motif enrichment analysis (right) for the comparisons of dKO-8M versus dKO-8 (A), dKO-19M versus dKO-19 (B), 3-h Senexin B treatment versus control (C), and 72-h Senexin B treatment versus control (D). (E) Comparison of the effects of CDK8 kinase domain mutation and 72-h Senexin B treatment on protein phosphorylation. (F) Comparison of the effects of CDK19 kinase domain mutation and 72-h Senexin B treatment on protein phosphorylation. (G) Comparison of the effects of CDK8 and CDK19 kinase domain mutations on protein phosphorylation. (H–K) Comparisons of fold changes in the protein levels to changes in phosphorylation for differentially expressed phosphoepitopes after 3-h (H) or 72-h Senexin B treatment (I), in cells expressing kinase-inactive CDK8 mutant versus WT CDK8 (J) or kinase-inactive CDK19 mutant versus WT CDK19 (K). Red dots: phosphoproteins affected with FC < 1.3 at the protein level. Blue dots: phosphoproteins affected with FC ≥ 1.3 at the protein level in the same direction as phosphoprotein changes. Green dots: phosphoproteins affected with FC ≥ 1.3 at the protein level in the opposite direction to phosphoprotein changes (H–K).
Figure 11.
Figure 11.
Comparative phosphoproteomics analysis of the effects of Mediator kinase inhibition in 293 and HCT116 cells. (A) Heatmap of the 27 phosphoepitopes similarly affected by Mediator kinase inhibition in HCT116 (48) and 293 cells (this study). (B) Heatmap of 24 representative phosphoepitopes (discovered in at least three comparisons in 293 cells) that were not identified in HCT116 study (48). Enriched motif analysis of the downregulated phosphoepitopes is presented below the heatmaps.

Similar articles

Cited by

References

    1. Luyties O., Taatjes D.J.. The Mediator kinase module: an interface between cell signaling and transcription. Trends Biochem. Sci. 2022; 47:314–327. - PMC - PubMed
    1. Lynch C.J., Bernad R., Martinez-Val A., Shahbazi M.N., Nobrega-Pereira S., Calvo I., Blanco-Aparicio C., Tarantino C., Garreta E., Richart-Gines L.et al. .. Global hyperactivation of enhancers stabilizes human and mouse naive pluripotency through inhibition of CDK8/19 Mediator kinases. Nat. Cell Biol. 2020; 22:1223–1238. - PubMed
    1. Firestein R., Bass A.J., Kim S.Y., Dunn I.F., Silver S.J., Guney I., Freed E., Ligon A.H., Vena N., Ogino S.et al. .. CDK8 is a colorectal cancer oncogene that regulates beta-catenin activity. Nature. 2008; 455:547–551. - PMC - PubMed
    1. Alarcon C., Zaromytidou A.I., Xi Q., Gao S., Yu J., Fujisawa S., Barlas A., Miller A.N., Manova-Todorova K., Macias M.J.et al. .. Nuclear CDKs drive Smad transcriptional activation and turnover in BMP and TGF-beta pathways. Cell. 2009; 139:757–769. - PMC - PubMed
    1. Serrao A., Jenkins L.M., Chumanevich A.A., Horst B., Liang J., Gatza M.L., Lee N.Y., Roninson I.B., Broude E.V., Mythreye K.. Mediator kinase CDK8/CDK19 drives YAP1-dependent BMP4-induced EMT in cancer. Oncogene. 2018; 37:4792–4808. - PMC - PubMed

Publication types