Human Mesenchymal Stem Cells Modified with the NS5A Gene of Hepatitis C Virus Induce a Cellular Immune Response Exceeding the Response to DNA Immunization with This Gene
- PMID: 37372076
- PMCID: PMC10295215
- DOI: 10.3390/biology12060792
Human Mesenchymal Stem Cells Modified with the NS5A Gene of Hepatitis C Virus Induce a Cellular Immune Response Exceeding the Response to DNA Immunization with This Gene
Abstract
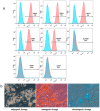
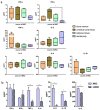
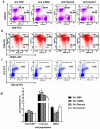
Hepatitis C virus (HCV) is one of the basic culprits behind chronic liver disease, which may result in cirrhosis and hepatocarcinoma. In spite of the extensive research conducted, a vaccine against HCV has not been yet created. We have obtained human mesenchymal stem cells (hMSCs) and used them for expressing the HCV NS5A protein as a model vaccination platform. Sixteen hMSC lines of a different origin were transfected with the pcNS5A-GFP plasmid to obtain genetically modified MSCs (mMSCs). The highest efficiency was obtained by the transfection of dental pulp MSCs. C57BL/6 mice were immunized intravenously with mMSCs, and the immune response was compared with the response to the pcNS5A-GFP plasmid, which was injected intramuscularly. It was shown that the antigen-specific lymphocyte proliferation and the number of IFN-γ-synthesizing cells were two to three times higher after the mMSC immunization compared to the DNA immunization. In addition, mMSCs induced more CD4+ memory T cells and an increase in the CD4+/CD8+ ratio. The results suggest that the immunostimulatory effect of mMSCs is associated with the switch of MSCs to the pro-inflammatory phenotype and a decrease in the proportion of myeloid derived suppressor cells. Thus, the possibility of using human mMSCs for the creation of a vaccine against HCV has been shown for the first time.
Keywords: DNA immunization; HCV vaccine; cellular immune response; genetically modified MSCs; hepatitis C virus (HCV); human mesenchymal stem cells (MSCs); memory T cells; myeloid derived suppressor cells (MDSCs); non-structural HCV NS5A protein.
Conflict of interest statement
The authors declare that they have no conflict of interest. The funders had no role in the design of the study; in the collection, analysis, or interpretation of data; in the writing of the manuscript; or in the decision to publish the results.
Figures


Similar articles
-
Genetically Modified Mouse Mesenchymal Stem Cells Expressing Non-Structural Proteins of Hepatitis C Virus Induce Effective Immune Response.Vaccines (Basel). 2020 Feb 2;8(1):62. doi: 10.3390/vaccines8010062. Vaccines (Basel). 2020. PMID: 32024236 Free PMC article.
-
Potent Anti-hepatitis C Virus (HCV) T Cell Immune Responses Induced in Mice Vaccinated with DNA-Launched RNA Replicons and Modified Vaccinia Virus Ankara-HCV.J Virol. 2019 Mar 21;93(7):e00055-19. doi: 10.1128/JVI.00055-19. Print 2019 Apr 1. J Virol. 2019. PMID: 30674625 Free PMC article.
-
[DNA immunization with a plasmid containing gene of hepatitis C virus protein 5A (NS5A) induces the effective cellular immune response].Mol Biol (Mosk). 2010 Mar-Apr;44(2):275-83. Mol Biol (Mosk). 2010. PMID: 20586188 Russian.
-
[Enhancement of cellular immune response to DNA vaccine encoding hepatitis C virus core and envelope 2 fusion antigen by murine Fms-like tyrosine kinase 3 ligand].Sheng Wu Gong Cheng Xue Bao. 2003 Mar;19(2):158-62. Sheng Wu Gong Cheng Xue Bao. 2003. PMID: 15966314 Chinese.
-
DNA-mediated immunization to the hepatitis B surface antigen. Activation and entrainment of the immune response.Ann N Y Acad Sci. 1995 Nov 27;772:64-76. doi: 10.1111/j.1749-6632.1995.tb44732.x. Ann N Y Acad Sci. 1995. PMID: 8546414 Review.
Cited by
-
The Role of Dental-derived Stem Cell-based Therapy and Their Derived Extracellular Vesicles in Post-COVID-19 Syndrome-induced Tissue Damage.Stem Cell Rev Rep. 2024 Nov;20(8):2062-2103. doi: 10.1007/s12015-024-10770-y. Epub 2024 Aug 16. Stem Cell Rev Rep. 2024. PMID: 39150646 Review.
References
-
- Wang Y., Rao H., Chi X., Li B., Liu H., Wu L., Zhang H., Liu S., Zhou G., Li N., et al. Detection of residual HCV-RNA in patients who have achieved sustained virological response is associated with persistent histological abnormality. eBioMedicine. 2019;46:227–235. doi: 10.1016/j.ebiom.2019.07.043. - DOI - PMC - PubMed
Grants and funding
LinkOut - more resources
Full Text Sources
Research Materials

