. 2023 Aug 26;32(17):2717-2734.
doi: 10.1093/hmg/ddad100.

Insights into energy balance dysregulation from a mouse model of methylmalonic aciduria

Affiliations

Insights into energy balance dysregulation from a mouse model of methylmalonic aciduria

Marie Lucienne et al. Hum Mol Genet. .

Abstract

Inherited disorders of mitochondrial metabolism, including isolated methylmalonic aciduria, present unique challenges to energetic homeostasis by disrupting energy-producing pathways. To better understand global responses to energy shortage, we investigated a hemizygous mouse model of methylmalonyl-CoA mutase (Mmut)-type methylmalonic aciduria. We found Mmut mutant mice to have reduced appetite, energy expenditure and body mass compared with littermate controls, along with a relative reduction in lean mass but increase in fat mass. Brown adipose tissue showed a process of whitening, in line with lower body surface temperature and lesser ability to cope with cold challenge. Mutant mice had dysregulated plasma glucose, delayed glucose clearance and a lesser ability to regulate energy sources when switching from the fed to fasted state, while liver investigations indicated metabolite accumulation and altered expression of peroxisome proliferator-activated receptor and Fgf21-controlled pathways. Together, these shed light on the mechanisms and adaptations behind energy imbalance in methylmalonic aciduria and provide insight into metabolic responses to chronic energy shortage, which may have important implications for disease understanding and patient management.


Figures

Figure 1
Figure 1
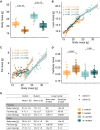
Mutant mice exhibit a shift in body composition. (A) Body weight measured at 3 months. Cohort 1: circles, Cohort 2: triangles. Significance determined by the Wilcoxon rank test. (B, C) Linear regression models: lean mass (B) and fat mass (C), determined by TD-NMR, in mutant versus control mice using body mass as a covariate. (D) Fat mass of body weight reported as the ratio of fat to relative body weight. Significance determined by the Wilcoxon rank test. (A–D) Each data point represents a single mouse. (E) Summary table of values of body composition parameters. Data are shown as mean ± SD. P-values were determined by linear model, gray areas in (B) and (C) represent confidence intervals. Cohort 1: n = 14 f.Mmut-ki/wt, n = 15 f.Mmut-ko/ki, n = 12 m.Mmut-ki/wt, n = 15 m.Mmut-ko/ki; cohort 2: n = 14 f.Mmut-ki/wt, n = 16 f.Mmut-ko/ki, n = 16 m.Mmut-ki/wt, n = 15 m.Mmut-ko/ki. (f. females, m. males, mutant: Mmut-ko/ki, control Mmut-ki/wt).
Figure 2
Figure 2
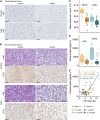
Whitening of BAT. (A) Perigonadal WAT H&E staining of representative control and 4-month-old mutant male and female mice. Scale bar represents 50 μm. (B) Interscapular BAT H&E and uncoupling protein 1 (UCP-1) staining of representative 4-month-old control and mutant male and female mice. Scale bar represents 50 μm. (C) Averaged body surface temperature in mice (3 months old). (D) Plasma leptin levels in mutant mice with littermate controls. (C, D) P-value determined by Wilcoxon rank test. (E) Plasma leptin levels plotted against fat mass measured through dual-energy X-ray absorptiometry in a linear model (4 months old). Each data point represents a single mouse. Correlation calculated by the Pearson method (f. females, m. males, mutant: Mmut-ko/ki, control: Mmut-ki/wt).
Figure 3
Figure 3
Reduced response to cold challenge. (A) Oxygen consumption, (B) respiratory exchange ratio (RER, ratio of volume of CO2 production and O2 consumption), (C) carbohydrate (CHO) oxidation, (D) lipid oxidation and (E) distance covered. Left images: values obtained following continuous measurement every 20 min. Right images: box plot for each mouse corresponding to residuals from linear correlation with body mass (see Supplementary Material, Fig. S3). Mice were housed at thermoneutrality (30°C) from 0 to 10 h and switched to colder temperature (16°C) from 11 to 21 h. Mice were 5 months old, fasted, water was provided ad libitum. n = 14 Mmut-ki/wt males and n = 16 Mmut-ki/wt females; n = 16 Mmut-ko/ki males and n = 15 Mmut-ko/ki females, aged 5 months. P-values determined by Wilcoxon rank test (f. females, m. males, mutant: Mmut-ko/ki, control: Mmut-ki/wt).
Figure 4
Figure 4
Reduced energy intake and expenditure. (A) Oxygen consumption, (B) respiratory exchange ratio (RER, ratio of volume of CO2 production and O2 consumption), (C) carbohydrate (CHO) oxidation, (D) lipid oxidation, (E) distance covered and (F) cumulative food intake (in grams). Left images: values obtained following continuous measurement every 20 min. Right images: box plot for each mouse corresponding to residuals from linear correlation with body mass (see Supplementary Material, Fig. S4). Mice were 3 months old and housed at room temperature (22°C) with food and water provided ad libitum over 21 h, with data separated according to light phase 1 (0–5 h), dark (5–17 h), and light phase 2 (17–21 h). n = 12 Mmut-ki/wt males and n = 14 Mmut-ki/wt females; n = 15 Mmut-ko/ki males and n = 15 Mmut-ko/ki females. P-values determined by Wilcoxon rank test (f. females, m. males, mutant: Mmut-ko/ki, control: Mmut-ki/wt). (F) corresponds to food intake presented in (12).
Figure 5
Figure 5
Mutant mice show signs of metabolic inflexibility accompanied by increased levels of Fgf21 when fed. Plasma levels of (A) glucose, (B) triglycerides, (C) cholesterol, (D) glycerol, (E) non-esterified fatty acids (NEFA) and (F) lactate. For all: each data point represents a single mouse, aged 5 months. P-values determined by Wilcoxon rank test (f. females, m. males, mutant: Mmut-ko/ki, control: Mmut-ki/wt).
Figure 6
Figure 6
Mutant mice display impaired glucose tolerance. (A) i.p. glucose tolerance test (ipGTT) curve (data shown as mean ± SD) with baseline glucose shown as a dotted line. (B) Area under the curve (AUC) of glucose excursion shown for time 0–120 min. n = 28 Mmut-ki/wt females, n = 31 Mmut-ko/ki females, n = 28 Mmut-ki/wt males, n = 30 Mmut-ko/ki males, 3 months old. (C) Glucose excursion after i.p. injection of insulin (i.p. insulin tolerance test, ipITT). Values are mean ± SD n = 15 Mmut-ki/wt females, n = 16 Mmut-ko/ki females, n = 17 Mmut-ki/wt males, n = 16 Mmut-ko/ki males, 4 months old. Each data point represents a single mouse. P-values determined by Wilcoxon rank test (f. females, m. males, mutant: Mmut-ko/ki, control: Mmut-ki/wt).
Figure 7
Figure 7
Mutant mice exhibit signs of liver damage. (A) Liver weight normalized to body weight, 5 months old. (B) Plasma levels of alanine-aminotransferase (ALAT/glutamic-pyruvic transaminase (GPT)), aspartate-aminotransferase (ASAT/glutamic-oxaloacetic transaminase (GOT)) and alkaline phosphatase (ALP), 5 months old. (C) Relative levels of propionyl-CoA, methylmalonyl-CoA, methylmalonate and 2-methylcitrate/methylisocitrate in whole liver of females, 6.5 months old. Data expressed in areas under the curve divided by total ion currents, normalization to the averaged control values. (D) MMA levels in whole liver of females, 6.5 months old. Each data point represents a single mouse. P-values determined by Wilcoxon rank test (f. females, m. males, mutant: Mmut-ko/ki, control: Mmut-ki/wt).
Figure 8
Figure 8
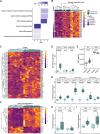
Altered expression of PPAR and electron transport chain-associated genes in mutant mouse liver. (A) WikiPathways gene set enrichment analysis. (B, C) Heat map of significantly changed genes in electron transport chain (B) and PPAR-signaling (C) pathways. (D) Confirmatory qRT-PCR of Fgf21, Hnf4a and Ppargc1a of the same samples. (E) Plasma levels of Fgf21 measured from ad libitum–fed and overnight-fasted mice. Males and females analyzed together since no sex differences were identified. For all, each data point represents a single mouse, aged 5 months. (F) Heat map of significantly changed genes encoding fatty acid degradation proteins. (G–I) Confirmatory qRT-PCR of fatty acid oxidation genes (G), rate limiting genes of gluconeogenesis (Pck1) and glycolysis (Pklr) (H) and ketone body synthesis (I). All samples derived from RNA from liver tissue of 9 Mmut-ki/wt and 10 Mmut-ko/ki 4-month-old male mice in the ad libitum–fed state. All P-values determined by the Wilcoxon rank test.

Similar articles

Cited by

References

    1. Smith, R.L., Soeters, M.R., Wüst, R.C.I. and Houtkooper, R.H. (2018) Metabolic flexibility as an adaptation to energy resources and requirements in health and disease. Endocr. Rev., 39, 489–517. - PMC - PubMed
    1. Kölker, S., Schwab, M., Hörster, F., Sauer, S., Hinz, A., Wolf, N.I., Mayatepek, E., Hoffmann, G.F., Smeitink, J.A.M. and Okun, J.G. (2003) Methylmalonic acid, a biochemical Hallmark of Methylmalonic acidurias but no inhibitor of mitochondrial respiratory chain. J. Biol. Chem., 278, 47388–47393. - PubMed
    1. Luciani, A., Denley, M.C.S., Govers, L.P., Sorrentino, V. and Froese, D.S. (2021) Mitochondrial disease, mitophagy, and cellular distress in methylmalonic acidemia. Cell. Mol. Life Sci., 78, 6851–6867. - PMC - PubMed
    1. Schwab, M.A., Sauer, S.W., Okun, J.G., Nijtmans, L.G.J., Rodenburg, R.J.T., van den Heuvel, L.P., Dröse, S., Brandt, U., Hoffmann, G.F., Ter Laak, H. et al. (2006) Secondary mitochondrial dysfunction in propionic aciduria: a pathogenic role for endogenous mitochondrial toxins. Biochem. J., 398, 107–112. - PMC - PubMed
    1. Okun, J.G., Hörster, F., Farkas, L.M., Feyh, P., Hinz, A., Sauer, S., Hoffmann, G.F., Unsicker, K., Mayatepek, E. and Kölker, S. (2002) Neurodegeneration in Methylmalonic aciduria involves inhibition of complex II and the tricarboxylic acid cycle, and synergistically acting Excitotoxicity. J. Biol. Chem., 277, 14674–14680. - PubMed

Publication types

MeSH terms

Supplementary concepts