. 2023 Jun 27;21(6):e3002160.
doi: 10.1371/journal.pbio.3002160. eCollection 2023 Jun.

Preservation of developmental spontaneous activity enables early auditory system maturation in deaf mice

Affiliations

Preservation of developmental spontaneous activity enables early auditory system maturation in deaf mice

Calvin J Kersbergen et al. PLoS Biol. .

Abstract

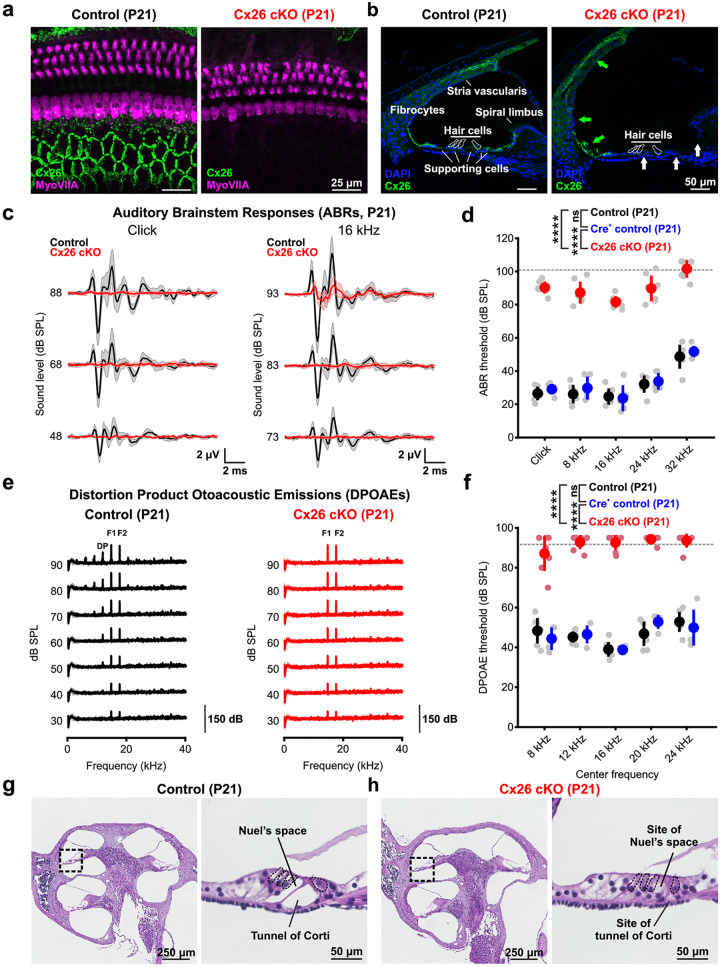
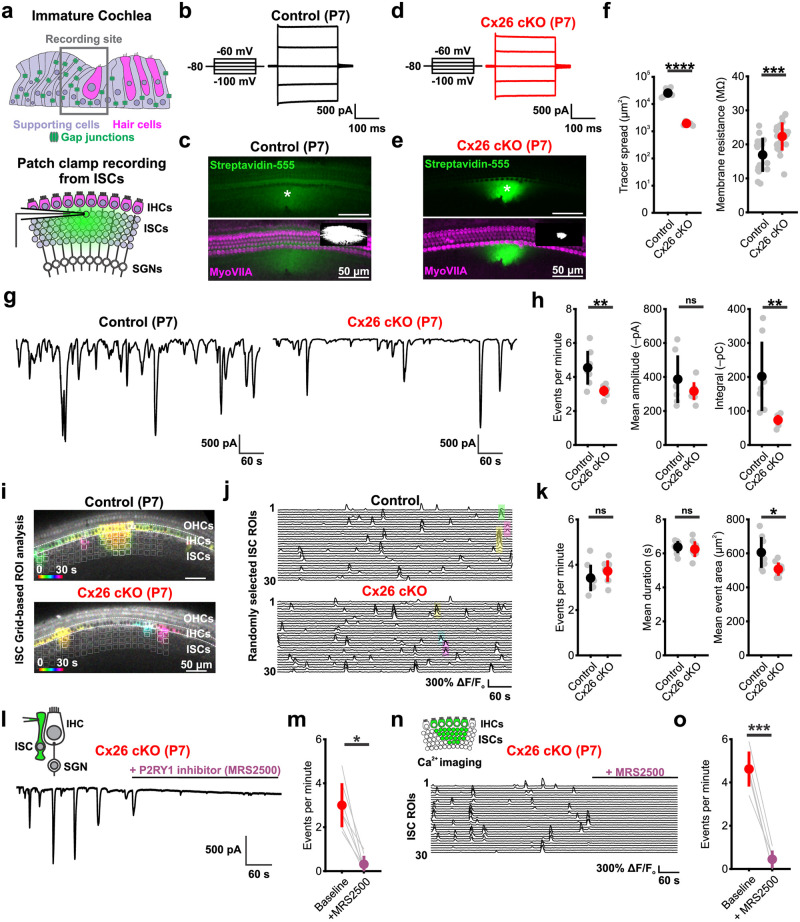
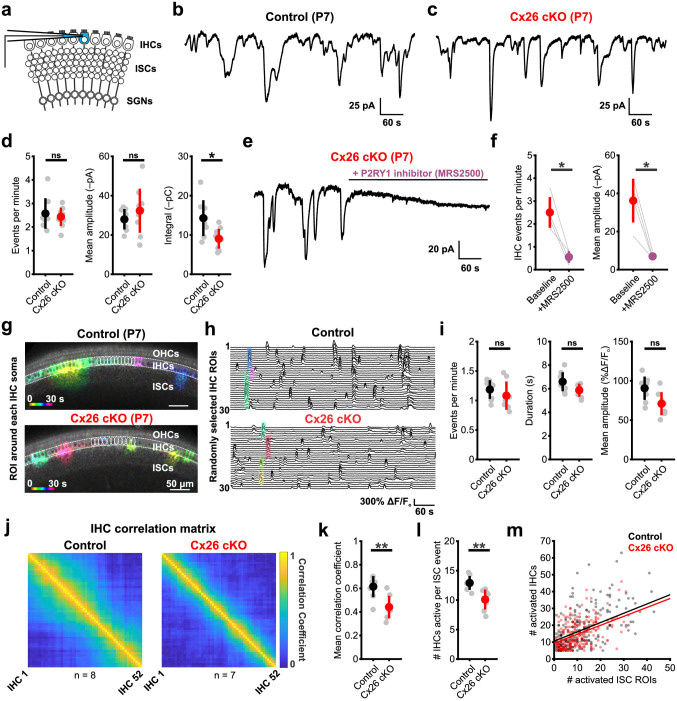
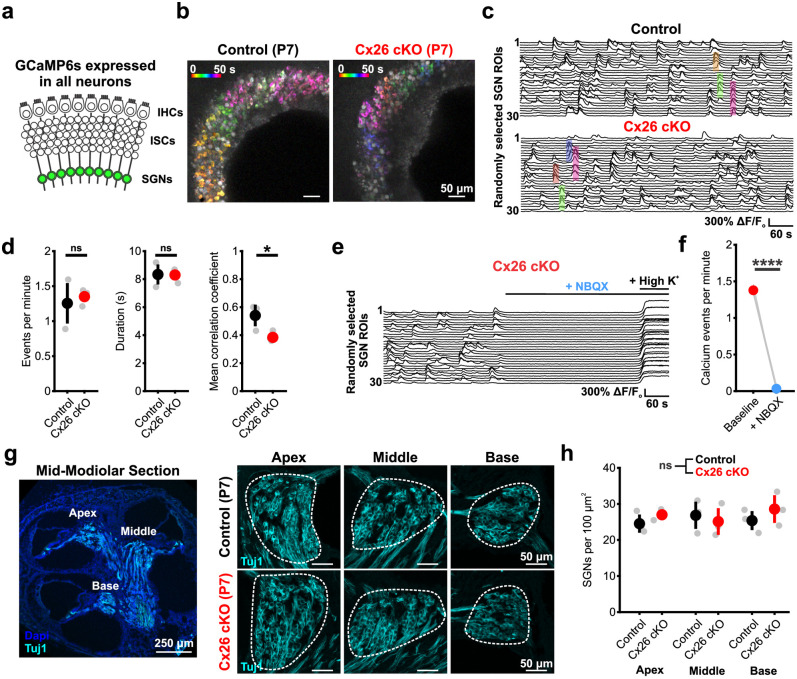
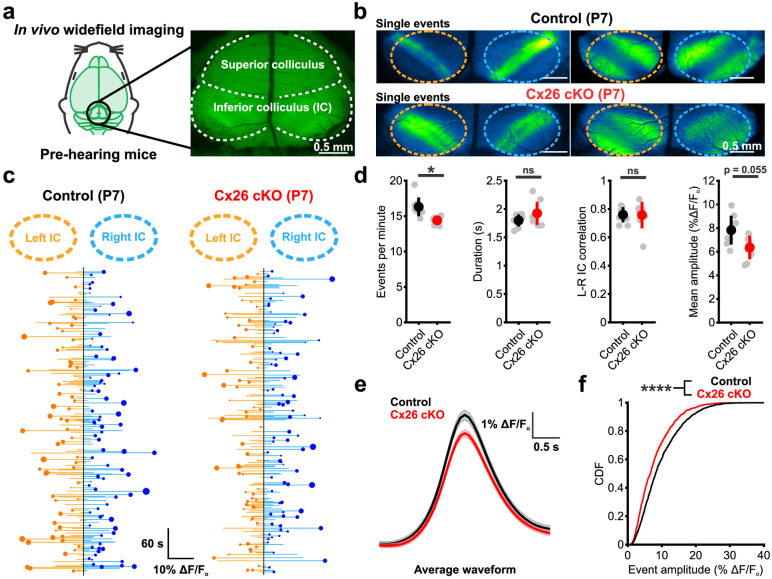
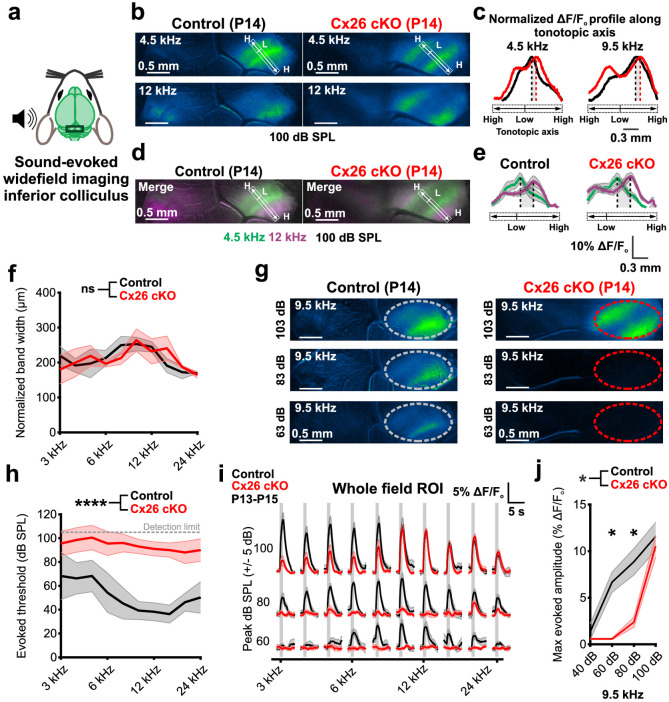
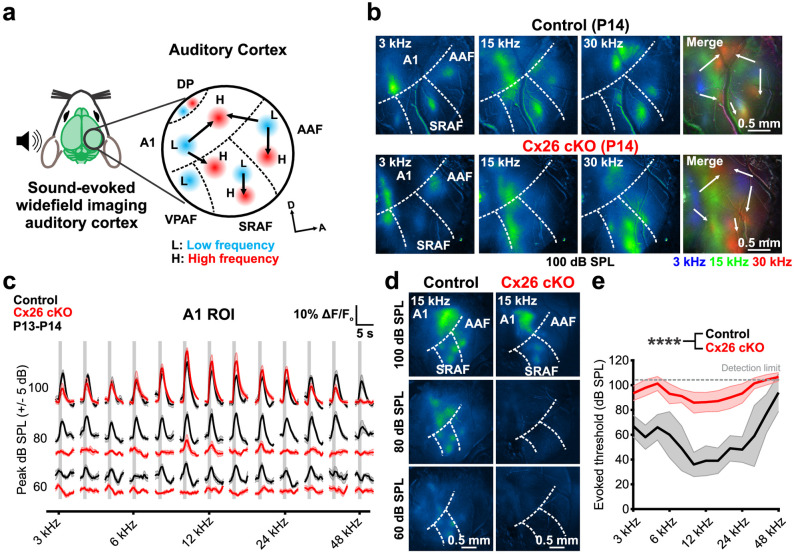
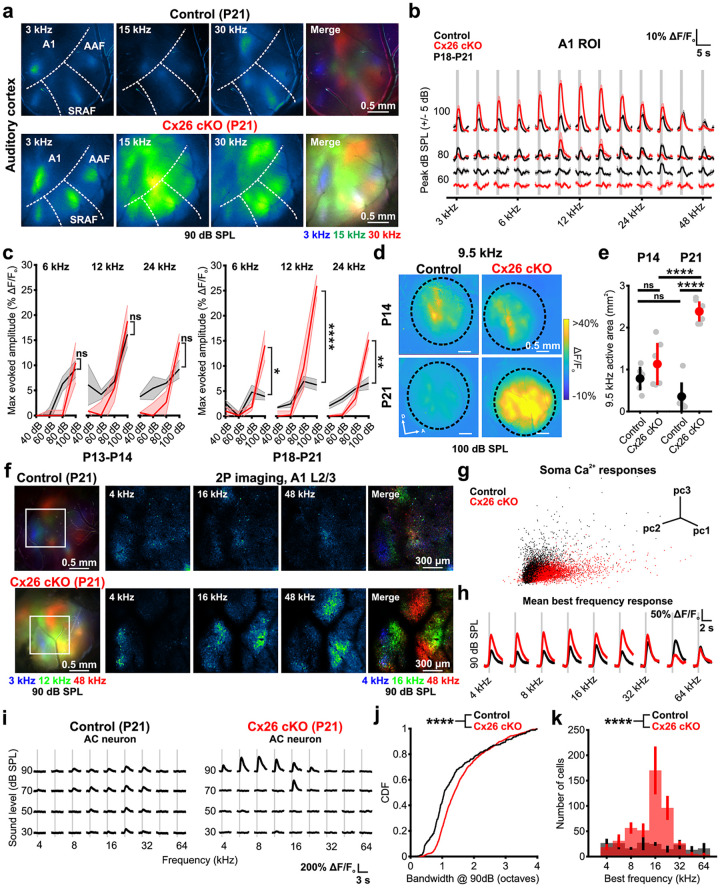
Intrinsically generated neural activity propagates through the developing auditory system to promote maturation and refinement of sound processing circuits prior to hearing onset. This early patterned activity is induced by non-sensory supporting cells in the organ of Corti, which are highly interconnected through gap junctions containing connexin 26 (Gjb2). Although loss of function mutations in Gjb2 impair cochlear development and are the most common cause of congenital deafness, it is not known if these variants disrupt spontaneous activity and the developmental trajectory of sound processing circuits in the brain. Here, we show in a new mouse model of Gjb2-mediated congenital deafness that cochlear supporting cells adjacent to inner hair cells (IHCs) unexpectedly retain intercellular coupling and the capacity to generate spontaneous activity, exhibiting only modest deficits prior to hearing onset. Supporting cells lacking Gjb2 elicited coordinated activation of IHCs, leading to coincident bursts of activity in central auditory neurons that will later process similar frequencies of sound. Despite alterations in the structure of the sensory epithelium, hair cells within the cochlea of Gjb2-deficient mice were intact and central auditory neurons could be activated within appropriate tonotopic domains by loud sounds at hearing onset, indicating that early maturation and refinement of auditory circuits was preserved. Only after cessation of spontaneous activity following hearing onset did progressive hair cell degeneration and enhanced auditory neuron excitability manifest. This preservation of cochlear spontaneous neural activity in the absence of connexin 26 may increase the effectiveness of early therapeutic interventions to restore hearing.


Conflict of interest statement

I have read the journal’s policy and the authors of this manuscript have the following competing interests: DEB is a paid consultant of Decibel Therapeutics.

Figures

Fig 1
Fig 1. Targeted deletion of Cx26 from the sensory epithelium leads to auditory dysfunction.
(a) Immunostaining for Connexin 26 (green) in whole mount apical cochlea from P21 control (Gjb2fl/fl, left) and Cx26 cKO (Tecta-Cre;Gjb2fl/fl, right) mice. Hair cells (magenta) are labeled by immunoreactivity against MyoVIIA. (b) Immunostaining for Connexin 26 (green) in mid-turn cochlea cross section at P21 from control (left) and Cx26 cKO (right) mice. Loss of Cx26 immunostaining is observed in the inner sulcus and supporting cells of the organ of Corti (white arrows) but not within lateral wall fibrocytes or the stria vascularis (green arrows). Hair cell bodies are outlined based on nuclei (DAPI) location. (c) Average ABR traces to broadband click (left) and 16 kHz tone pip (right) stimuli presented at multiple SPLs from control (Gjb2fl/fl, black, n = 6) and Cx26 cKO (Tecta-Cre;Gjb2fl/fl, red, n = 7) mice at P21. (d) Quantification of P21 ABR thresholds to click and pure tone stimuli in controls (Gjb2fl/fl, black, n = 6, Tecta-Cre;Gjb2fl/+, blue, n = 5) and Cx26 cKO (Tecta-Cre;Gjb2fl/fl, red, n = 7). Gray dashed line indicates maximum speaker output and detection limit. p = 3.4380e-13 (cKO vs. control), 1.2801e-9 (cKO vs. Cre+ control), 0.4774 (control vs. Cre+ control), linear mixed effects model. (e) Average recording of DPOAEs for a 16 kHz center frequency at multiple SPLs from control (Gjb2fl/fl, black, n = 7) and Cx26 cKO (Tecta-Cre;Gjb2 fl/fl, red, n = 7) mice at P21. F1; primary tone 1 (14.544 kHz), F2; primary tone 2 (17.440 khz), DP; distortion product. (f) Quantification of distortion product thresholds for 5 center frequencies in controls (Gjb2fl/fl, black, n = 7 and Tecta-Cre;Gjb2 fl/+, blue, n = 4) and Cx26 cKO (Tecta-Cre;Gjb2 fl/fl, red, n = 7). Gray dashed line indicates maximum speaker output and detection limit. p = 2.3326e-14 (control vs. cKO), 4.7233e-10 (Cre+ control vs. cKO), 0.9759 (control vs. Cre+ control), linear mixed effects model. (g) (Left) Hematoxylin and eosin stain of mid-modiolar section of a P21 control cochlea. Black square indicates site of high magnification. (Right) Magnified image of the organ of Corti, with the tunnel of Corti and Nuel’s space indicated. (h) (Left) Hematoxylin and eosin stain of mid-modiolar section of a P21 Cx26 cKO cochlea. Black square indicates site of high magnification. (Right) Magnified image of the organ of Corti, with site of the tunnel of Corti and Nuel’s space indicated. Analysis code, plotted figure panels, and statistical analysis can be found at: https://doi.org/10.5281/zenodo.7896212. ABR, auditory brainstem response; DPOAE, distortion product otoacoustic emission; SPL, sound pressure level.
Fig 2
Fig 2. ISCs generate spontaneous activity in the absence of Cx26.
(a) (Top) Schematic depicting cross section of the immature cochlea with targeted recording site for electrophysiology and calcium imaging from ISCs indicated. (Bottom) Schematic of whole cell patch clamp recording from ISCs in whole mount cochlea with an intercellular tracer within the pipette. IHC: inner hair cell; SGN: spiral ganglion neuron. (b) Current responses elicited by voltage steps within a P7 control (Gjb2fl/fl) ISC. (c) (Top) Visualization of intercellular Neurobiotin tracer spread from a P7 control ISC with fluorescent conjugated streptavidin (green). Asterisk indicates patched cell. (Bottom) Same as above, but with hair cells labeled by immunoreactivity to Myosin VIIa (magenta) and binarized tracer spread for quantification in inset. (d) Current responses elicited by voltage steps within a P7 Cx26 cKO (Tecta-Cre;Gjb2fl/fl) ISC. (e) Same as (c), but in a Cx26 cKO cochlea. (f) Quantification of spatial tracer spread (left) and membrane resistance (right) in ISCs. Tracer spread: n = 4 control, 6 Cx26 cKO cochleae; p = 2.1864e-8, two-sample t test. Membrane resistance: n = 17 control, 24 Cx26 cKO ISCs; p = 6.3712e-4, two-sample t test. (g) Whole cell voltage clamp recordings of spontaneous activity from control (left) and Cx26 cKO (right) ISCs. (h) Quantification of spontaneous event frequency, mean amplitude, and integral (charge transfer). N = 7 control, 8 Cx26 cKO ISCs; p = 0.0045, 0.2405, 0.0061 (frequency, amplitude, and integral), two-sample t test with unequal variances and Benjamini–Hochberg correction for multiple comparisons. (i) Temporally pseudocolored 30 s projection of spontaneous calcium transients in ISCs from isolated prehearing cochlea from P7 control (Tecta-Cre;Gjb2fl/+;R26-lsl-GCaMP3, top) and Cx26 cKO (Tecta-Cre;Gjb2fl/fl;R26-lsl-GCaMP3fl/+, bottom) mice. Grid-based ROI analysis is overlaid, with active grids during the 30 s window indicated in white. (j) Raster plot of ΔF/Fo signals from 30 randomly selected grid ROIs in control (top) and Cx26 cKO (bottom) cochleae. Highlighted transients correspond by color to those indicated in (f). (k) Quantification of ISC calcium event frequency (per 0.01 mm2), mean duration, and mean event area. n = 8 control, 9 Cx26 cKO; p = 0.3080, 0.5683, 0.0140 (frequency, duration, and area), two-sample t test with Benjamini–Hochberg correction. (l) Whole cell voltage clamp recording from a P7 Cx26 cKO ISC with addition of P2RY1 receptor antagonist MRS2500 (1 μM). (m) Quantification of spontaneous event frequency at baseline and following P2RY1 antagonist. N = 7 Cx26 cKO ISCs; p = 0.0156, paired Wilcoxon sign rank test. (n) Raster plot of calcium ΔF/Fo signals from 30 randomly selected ISC grid ROIs from a Cx26 cKO cochlea with addition of MRS2500. (o) Quantification of mean event frequency (per 0.01 mm2) at baseline and following P2RY1 antagonism. n = 5 Cx26 cKO cochlea; p = 3.0798e-4, paired t test. Analysis code, plotted figure panels, and statistical analysis can be found at: https://doi.org/10.5281/zenodo.7896212. ISC, inner supporting cell; ROI, region of interest.
Fig 3
Fig 3. ISCs coordinate excitation of IHCs despite absence of Cx26.
(a) Schematic of whole cell patch clamp recordings from IHCs. (b) Representative whole cell voltage clamp trace of spontaneous activity from a control (Gjb2fl/fl) IHC. (c) Representative whole cell voltage clamp trace of spontaneous activity from a Cx26 cKO (Tecta-Cre;Gjb2fl/fl) IHC. (d) Quantification of spontaneous inward current frequency, mean amplitude, and integral (charge transfer). N = 8 control, 9 Cx26 cKO IHCs; p = 0.9626, 0.3587, 0.0134 (frequency, amplitude, and integral), two-sample t test with Benjamini–Hochberg correction. (e) Whole cell voltage clamp recording from a Cx26 cKO IHC with addition of P2RY1 receptor antagonist MRS2500 (1 μM). (f) Quantification of spontaneous inward current frequency and mean amplitude in IHCs before and following addition of MRS2500. N = 4 Cx26 cKO IHCs; p = 0.0132, 0.0168 (frequency, amplitude), paired t test with Benjamini–Hochberg correction. (g) Temporally pseudocolored 30 s projection of spontaneous calcium transients in IHCs in isolated prehearing cochlea from control (Tecta-Cre; Gjb2fl/+;R26-lsl-GCaMP3, top) and Cx26 cKO (Tecta-Cre;Gjb2fl/fl;R26-lsl-GCaMP3, bottom) mice. Individual IHC oval ROIs are overlaid. (h) Raster plot of ΔF/Fo signals from 30 randomly selected IHCs in control (top) and Cx26 cKO (bottom) cochleae. Highlighted transients correspond by color to those indicated in (g). (i) Quantification of mean IHC calcium event frequency, duration, and amplitude. n = 8 control, 7 Cx26 cKO cochleae; p = 0.4634, 0.1158, 0.0648 (frequency, duration, and amplitude). Wilcoxon rank sum test (frequency) or two-sample t test (duration, amplitude) with Benjamini–Hochberg correction. (j) Mean correlation matrix of IHC ΔF/Fo signals in control (left) and Cx26 cKO (right) cochleae. (k) Quantification of mean correlation coefficient (80th percentile) between IHCs. n = 7 control, 7 Cx26 cKO cochleae; p = 0.0048, two-sample t test. (l) Quantification of mean number of IHCs active per supporting cell calcium event. N = 7 control, 7 Cx26 cKO cochleae; p = 0.0057, two-sample t test. (m) Scatter plot of activated ISC grid ROIs and activated IHCs during supporting cell calcium events in control (gray) and Cx26 cKO (pink) cochleae. Solid line indicates linear regression model of group data in control (black) and Cx26 cKO (red). Analysis code, plotted figure panels, and statistical analysis can be found at: https://doi.org/10.5281/zenodo.7896212. IHC, inner hair cell; ISC, inner supporting cell; ROI, region of interest.
Fig 4
Fig 4. Spontaneous synaptic activation of SGNs persists in the absence of supporting cell Cx26.
(a) Schematic of calcium imaging in SGNs in Snap25-T2A-GCaMP6s mice. (b) Temporally pseudocolored 50 s projection of coordinated spontaneous calcium transients in SGNs from isolated prehearing cochlea in control (Gjb2fl/fl;Snap25-T2A-GCaMP6s, top) and Cx26 cKO (Tecta-Cre;Gjb2fl/fl;Snap25-T2A-GCaMP6s, bottom). (c) Raster plot of ΔF/Fo signals from 30 randomly selected SGN ROIs in control (top) and Cx26 cKO (bottom) cochleae. Highlighted transients correspond by color to those indicated in b. (d) Quantification of spontaneous SGN calcium transient frequency, duration, and mean correlation coefficient. N = 3 control, 5 Cx26 cKO cochleae; p = 0.7857, 0.9345, 0.0114 (frequency, duration, and correlation), two-sample t test with Benjamini–Hochberg correction. (e) Raster plot of ΔF/Fo signals from 30 randomly selected SGN ROIs in a Cx26 cKO cochlea with addition of NBQX (50 μM). High potassium (High K+) aCSF is added following NBQX to ensure intact calcium responses. (f) Quantification of calcium event frequency within Cx26 cKO SGNs with addition of NBQX. N = 4 Cx26 cKO cochleae; p = 1.8187e-5, paired t test. (g) (Left) Low magnification image of SGNs labeled by immunoreactivity to Tuj1 (cyan) in mid-modiolar cross section of P7 cochlea. Labels indicate locations of apical, middle, and basal SGN counts. (Right) Representative high-magnification images of SGN soma in apical, middle, and basal cochlea from control (Gjb2fl/fl, top) and Cx26 cKO (Tecta-Cre;Gjb2fl/fl, bottom) at P7. Dashed lines indicate SGN compartment used for area measurement. (h) Quantification of SGN density in apical, middle, and basal cochlea at P7. N = 3 control, 3 Cx26 cKO; p = 0.5885, linear mixed effects model. Analysis code, plotted figure panels, and statistical analysis can be found at: https://doi.org/10.5281/zenodo.7896212. aCSF, artificial cerebrospinal fluid; ROI, region of interest; SGN, spiral ganglion neuron.
Fig 5
Fig 5. Spontaneous activity persists in the developing auditory system of Cx26 cKO mice.
(a) Schematic of in vivo widefield epi-fluorescent imaging paradigm to visualize prehearing neural activity in the IC. (b) Representative single calcium events in P7 IC from control (Gjb2fl/fl;Snap25-T2A-GCaMP6s, top) and Cx26 cKO (Tecta-Cre;Gjb2fl/fl;Snap25-T2A-GCaMP6s, bottom) mice occurring within isofrequency bands along the future tonotopic axis of the IC. (c) Trace of spontaneous calcium transients over 10 min in the right and left inferior colliculi from control (left) and Cx26 cKO (right) mice. Each line represents a calcium event, circles indicate which colliculus (right vs. left) exhibited a larger amplitude during bilateral events, with the size of the circle indicating the relative difference in amplitude between right and left, with larger circles representing more asymmetric bilateral events. (d) Quantification of spontaneous calcium event frequency, duration, degree of correlation between right and left colliculi, and mean event amplitude. n = 8 control, 8 Cx26 cKO mice; p = 0.0122, 0.2287, 0.9607, 0.0548 (frequency, duration, correlation, and amplitude), two-sample t test with Benjamini–Hochberg correction. (e) Waveform of the mean spontaneous event aligned to peak amplitude from control and Cx26 cKO mice. n = 1,315 events from 8 control mice, 1,161 events from 8 Cx26 cKO mice. (f) Cumulative distribution plot of peak event amplitude. n = 1,315 events from 8 control mice, 1,161 events from 8 Cx26 cKO mice; p = 2.8281e-11, two-sample Kolmogorov–Smirnov test. Analysis code, plotted figure panels, and statistical analysis can be found at: https://doi.org/10.5281/zenodo.7896212. IC, inferior colliculus.
Fig 6
Fig 6. Reduced acoustic sensitivity but retained midbrain tonotopic organization in Cx26 cKO mice.
(a) In vivo widefield imaging of tone-evoked IC neural activity in unanesthetized mice after hearing onset. (b) Suprathreshold tone-evoked neural calcium transients in IC from P14 control (Gjb2fl/fl;Snap25-T2A-GCaMP6s, left) and P14 Cx26 cKO (Tecta-Cre;Gjb2fl/fl;Snap25-T2A-GCaMP6s, right) mice. Rectangular ROIs were placed along the tonotopic axis of the contralateral IC (low (L) to high (H) frequency), perpendicular to pure tone evoked bands, to determine the peak response location for a pure tone. (c) Plot of tone-evoked normalized mean fluorescence along the tonotopic axis of the IC in control and Cx26 cKO mice. Dashed lines indicate location of peak pure tone response along tonotopic axis, gray shading indicates shift in peak response location for a given pure tone between control and Cx26 cKO mice. n = 4 control mice, 5 Cx26 cKO mice. (d) Pseudocolored tone-evoked calcium transients depicting spatial segregation of low and higher frequency stimuli along tonotopic axis. (e) Plot of tone-evoked mean fluorescence along the tonotopic axis of the IC in control (left) and Cx26 cKO (right) mice. Dashed lines indicate location of peak response along tonotopic axis, gray shading indicates spatial separation in peak response location for 4.5 (green) and 12 kHz (magenta) pure tones in control and Cx26 cKO mice. (f) Quantification of tone-evoked spatial activation (band width, 75th percentile) normalized to peak fluorescence response amplitude along the tonotopic axis of the IC at 100 dB SPL. n = 4 control, 5 Cx26 cKO mice; p = 0.7575, linear mixed effects model. (g) IC neural calcium transients to a 9.5 kHz stimulus from 103 to 63 dB SPL in a control and Cx26 cKO mouse. Circle in right IC depicts ROI for subsequent quantification of threshold and amplitude. (h) Quantification of tone-evoked thresholds. n = 4 control, 10 Cx26 cKO mice; p = 1.6305e-6, linear mixed effects model. (i) Quantification of tone-evoked fluorescence in IC across a range of frequency and sound level stimuli. Vertical gray bar indicates tone presentation. n = 6–7 control mice, 9–10 Cx26 cKO mice, mean ± SEM. (j) Rate-level functions characterizing maximum whole IC response amplitude at 9.5 kHz. Mean ± SEM, n = 6–7 control mice, 9–10 Cx26 cKO mice; p = 0.0166, linear mixed effects model with Sidák post hoc test. Analysis code, plotted figure panels, and statistical analysis can be found at: https://doi.org/10.5281/zenodo.7896212. IC, inferior colliculus; ROI, region of interest; SPL, sound pressure level.
Fig 7
Fig 7. Suprathreshold stimuli elicit tonotopically organized calcium responses in auditory cortex of immature Cx26 cKO mice.
(a) Schematic depicting tonotopic organization of mouse auditory cortex, adapted from [52,54]. L: low frequency, H: high frequency, A1: primary auditory cortex, AAF: anterior auditory field, SRAF: suprarhinal auditory field, VPAF: ventral posterior auditory field, DP: dorsal posterior. (b) Suprathreshold tone-evoked widefield neural calcium transients in AC from P14 control (Gjb2fl/fl;Snap25-T2A-GCaMP6s) and P14 Cx26 cKO (Tecta-Cre;Gjb2fl/fl;Snap25-T2A-GCaMP6s) mice. Merged image shows tonotopic segregation of pseudocolored pure tone responses from low (L) to high (H) frequency along tonotopic axes. (c) Quantification of tone-evoked fluorescence in A1 across a range of frequency and sound level stimuli in P13-P14 control and Cx26 cKO mice. Vertical gray bar indicates tone presentation. n = 5 control mice, 7 Tmem16a cKO mice, mean ± SEM. (d) AC neural calcium transients to a 15 kHz pure tone stimulus from 100 to 60 dB SPL in a control and Cx26 cKO mouse. (e) Quantification of tone-evoked thresholds. n = 5 control, 7 Cx26 cKO mice; p = 8.8449e-6, linear mixed effects model. Analysis code, plotted figure panels, and statistical analysis can be found at: https://doi.org/10.5281/zenodo.7896212. AC, auditory cortex; SPL, sound pressure level.
Fig 8
Fig 8. Rapid increases in central gain after hearing onset in Cx26 cKO mice.
(a) Suprathreshold widefield neural calcium transients in AC from P21 control (Gjb2fl/fl;Snap25-T2A-GCaMP6s) and P21 Cx26 cKO (Tecta-Cre;Gjb2fl/fl;Snap25-T2A-GCaMP6s) mice. Merged image shows tonotopic segregation of pseudocolored pure tone responses along tonotopic axes. (b) Quantification of tone-evoked fluorescence in A1 across a range of frequency and sound level stimuli in P18-P21 control and Cx26 cKO mice. Vertical gray bar indicates tone presentation. n = 7 control mice, 9 Tmem16a cKO mice, mean ± SEM. (c) Rate-level functions characterizing maximum A1 response amplitude at 6, 12, and 24 kHz at P13-P14 (left) and P18-P21 (right). Mean ± SEM, n = 7 P18-P21, 5 P13-P14 control mice, 9 P18-P21, 7 P13-P14 Cx26 cKO mice; P13-P14: p = 0.7551, 0.5816, 0.2418, Wilcoxon rank sum test (6 kHz) or two-sample t test (12 kHz, 24 kHz) with Benjamini–Hochberg correction. P18-P21: p = 0.0164, 2.1097e-7, 0.0026, Wilcoxon rank sum test (6 kHz) or two-sample t test (12 kHz, 24 kHz) with Benjamini–Hochberg correction. (d) Normalized fluorescence responses in auditory cortex (circled) of control and Cx26 cKO mice at P14 and P21 to a 9.5 kHz pure tone stimulus at 100 dB SPL. (e) Quantification of activated area in auditory cortex in response to a 9.5 kHz pure tone. n = 5 P13-P14, 6 P16-P21 control mice, 6 P13-P14, 7 P16-P21 Cx26 cKO mice; p = 5.8256e-8, one-way ANOVA with Tukey’s HSD post hoc comparisons. (f) (Left) Widefield macroscopic tonotopic maps of auditory cortex in a P21 control (top) and Cx26 cKO (bottom) at 90 dB SPL. White square indicates A1 region for two-photon imaging. (Right) Neuronal tone-evoked fluorescence at 90 dB SPL in layer II/III of A1 from mouse at left. (g) Principal component analysis of maximum tone-evoked fluorescence to a range of frequency (4–64 kHz) and sound intensity (30–90 dB SPL) stimuli. Each dot represents fluorescence signals of a single neural soma. n = 3 control, 3 Cx26 cKO mice. (h) Mean tone-evoked fluorescence at 90 dB SPL of all neurons sorted by their best frequency stimulus. (i) Tone-evoked fluorescence in a representative A1 neuron to a range of frequency and intensity stimuli in a control and Cx26 cKO mouse. (j) Cumulative distribution of neural tone-evoked frequency bandwidth at 90 dB SPL as measured by a Gaussian fit of maximum evoked fluorescence. n = 432 control cells (3 mice), 1,088 Cx26 cKO cells (3 mice); p = 1.8327e-14, two-sample Kolmogorov–Smirnov test. (k) Histogram of mean number of tone-responsive neurons binned by their best frequency. n = 567 control cells (3 mice), 1,379 Cx26 cKO cells (3 mice); p = 7.3571e-15, two-sample Kolmogorov–Smirnov test. Analysis code, plotted figure panels, and statistical analysis can be found at: https://doi.org/10.5281/zenodo.7896212. AC, auditory cortex; SPL, sound pressure level.

Similar articles

Cited by

References

    1. Monzack EL, Cunningham LL. Lead roles for supporting actors: Critical functions of inner ear supporting cells. Hear Res. 2013;303:20–29. doi: 10.1016/j.heares.2013.01.008 - DOI - PMC - PubMed
    1. Wan G, Corfas G, Stone JS. Inner ear supporting cells: Rethinking the silent majority. Semin Cell Dev Biol. 2013;24(5):448–459. doi: 10.1016/j.semcdb.2013.03.009 - DOI - PMC - PubMed
    1. Jagger DJ, Forge A. Compartmentalized and Signal-Selective Gap Junctional Coupling in the Hearing Cochlea. J Neurosci. 2006;26(4):1260–1268. doi: 10.1523/JNEUROSCI.4278-05.2006 - DOI - PMC - PubMed
    1. Kikuchi T, Kimura RS, Paul DL, Adams JC. Gap junctions in the rat cochlea: immunohistochemical and ultrastructural analysis. Anat Embryol. 1995;191(2):101–118. doi: 10.1007/BF00186783 - DOI - PubMed
    1. Santos-Sacchi J, Dallos P. Intercellular communication in the supporting cells of the organ of Corti. Hear Res. 1983;9(3):317–326. doi: 10.1016/0378-5955(83)90034-5 - DOI - PubMed

Publication types