Review
. 2023 Nov 27;15(6):mjad042.
doi: 10.1093/jmcb/mjad042.

Large-scale data-driven and physics-based models offer insights into the relationships among the structures, dynamics, and functions of chromosomes

Affiliations
Review

Large-scale data-driven and physics-based models offer insights into the relationships among the structures, dynamics, and functions of chromosomes

Cibo Feng et al. J Mol Cell Biol. .

Abstract

The organized three-dimensional chromosome architecture in the cell nucleus provides scaffolding for precise regulation of gene expression. When the cell changes its identity in the cell-fate decision-making process, extensive rearrangements of chromosome structures occur accompanied by large-scale adaptations of gene expression, underscoring the importance of chromosome dynamics in shaping genome function. Over the last two decades, rapid development of experimental methods has provided unprecedented data to characterize the hierarchical structures and dynamic properties of chromosomes. In parallel, these enormous data offer valuable opportunities for developing quantitative computational models. Here, we review a variety of large-scale polymer models developed to investigate the structures and dynamics of chromosomes. Different from the underlying modeling strategies, these approaches can be classified into data-driven ('top-down') and physics-based ('bottom-up') categories. We discuss their contributions to offering valuable insights into the relationships among the structures, dynamics, and functions of chromosomes and propose the perspective of developing data integration approaches from different experimental technologies and multidisciplinary theoretical/simulation methods combined with different modeling strategies.

Keywords: 4D genome; cell-fate decision; chromosome dynamics; data-driven model; physics-based model; structural changes; structure–function relationships.


Figures

Figure 1
Figure 1
Hierarchically organized 3D architectures of the genome and their rearrangements during cell development. Hi-C maps and illustrative chromosome structures at the TAD, compartment, and whole-genome scales are presented. Cell development processes are depicted by the motion of marbles, representing cell states, on a pictorial Waddington's landscape (Waddington, 1957). SMC, structural maintenance of chromosomes.
Figure 2
Figure 2
Models for constructing 3D chromosome structures. (A) Data-driven structure model. The data-driven model uses experimental measurements as input to build 3D structures that aim to accurately reproduce experimental data. The model and/or the associated parameters may be adjusted to achieve better agreements with experiments. (B) Physics-based structure model. The physics-based model, on the other hand, uses prior knowledge based on hypotheses to build 3D structures that aim to explain experimental observations and ultimately reproduce the data quantitatively. In this case, hypotheses and/or the associated parameters may be adjusted to achieve better agreements with experiments.
Figure 3
Figure 3
Data-driven dynamics model. During the cell-state transition, cells continuously change their identity, which is associated with specific 3D chromosome structure within the nucleus. Time-course Hi-C experiments are performed to generate ensemble-averaged contact maps at discrete time points of the cell-state transition process. Hi-C data are then converted into other forms of data, which can be linearly interpolated between the experimentally measured time points. Finally, 3D chromosome structural dynamics are built using data-restrained simulations. The figure is adapted from Di Stefano et al. (2020), an open access publication.
Figure 4
Figure 4
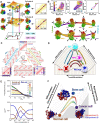
Physics-based dynamics model. (A) Landscape-switching model. Two landscapes and structural ensembles of the chromosomes at two cell states are generated by the data-driven structure model from Hi-C data. The cell-state transition is described as an energy excitation that switches from one landscape to another. The relaxation process on the post-switch landscape indicates the transition pathway. (B) Chromosome structural condensation and decondensation during the cell cycle. Principal axes (PA) are used as the reaction coordinates to describe chromosome geometrical condensation or decondensation. PA1 denotes the longest direction of the extension, while PA3 denotes the shortest direction of the extension. ‘I phase’ and ‘M phase’ stand for the interphase and mitotic phases, respectively. Individual trajectories are shown, with one typical pathway and the averaged pathway indicated by the grey line and cyan line, respectively. Typical chromosome structures during the cell cycle simulation trajectories are shown at the bottom. τ is the reduced unit of simulation time. (C) The chromosome contact probability evolving over time during the cell-state transition. The contact maps of ESCs, NPCs, fibroblasts, and neurons were derived from Hi-C data. The contact maps at 0.1 τ, 1 τ, 10 τ, and 100 τ of each transition are shown. The ideograms of the chromosome segment used in our study (chr14: 20.5–106.1 Mb) are annotated by the compartment status (red for compartment A and blue for compartment B) at the corresponding cell state. Fibro, fibroblast. (D) The pictorial Waddington's landscape of cell differentiation, reprogramming, and transdifferentiation among ESCs, fibroblasts, and neurons, based on the quantified chromosome structural reorganization pathways from simulations. (E) Changes in spatial distribution of chromosomal loci during cell cancerization. The difference in radial density of chromosomal loci during transition was calculated with respect to those in normal cells (brown), cancer cells (purple), and stem cells (blue). (F) The pictorial Waddington's landscape of carcinogenesis with illustrative chromosome structures colored by the compartment status. Panels A, C, and D are reprinted figures from Chu and Wang (2022c), with the permission from the American Physical Society; panel B is a reprinted figure from Chu and Wang (2020a), with the permission from the AIP Publishing; panels E and F are adapted from Chu and Wang (2021), an open access publication.

Similar articles

Cited by

References

    1. Abbas A., He X., Niu J. et al. (2019). Integrating Hi-C and FISH data for modeling of the 3D organization of chromosomes. Nat. Commun. 10, 2049. - PMC - PubMed
    1. Abramo K., Valton A.-L., Venev S.V. et al. (2019). A chromosome folding intermediate at the condensin-to-cohesin transition during telophase. Nat. Cell Biol. 21, 1393–1402. - PMC - PubMed
    1. Adli M. (2018). The CRISPR tool kit for genome editing and beyond. Nat. Commun. 9, 1911. - PMC - PubMed
    1. Anania C., Acemel R.D., Jedamzick J. et al. (2022). In vivo dissection of a clustered-CTCF domain boundary reveals developmental principles of regulatory insulation. Nat. Genet. 54, 1026–1036. - PMC - PubMed
    1. Anania C., Lupianez D.G. (2020). Order and disorder: abnormal 3D chromatin organization in human disease. Brief Funct. Genom. 19, 128–138. - PMC - PubMed

Publication types