. 2023 Jun 9:14:1179094.
doi: 10.3389/fimmu.2023.1179094. eCollection 2023.

Integrated multi-omics analyses reveal the altered transcriptomic characteristics of pulmonary macrophages in immunocompromised hosts with Pneumocystis pneumonia

Affiliations

Integrated multi-omics analyses reveal the altered transcriptomic characteristics of pulmonary macrophages in immunocompromised hosts with Pneumocystis pneumonia

Yawen Wang et al. Front Immunol. .

Abstract

Introduction: With the extensive use of immunosuppressants, immunosuppression-associated pneumonitis including Pneumocystis jirovecii pneumonia (PCP) has received increasing attention. Though aberrant adaptive immunity has been considered as a key reason for opportunistic infections, the characteristics of innate immunity in these immunocompromised hosts remain unclear.

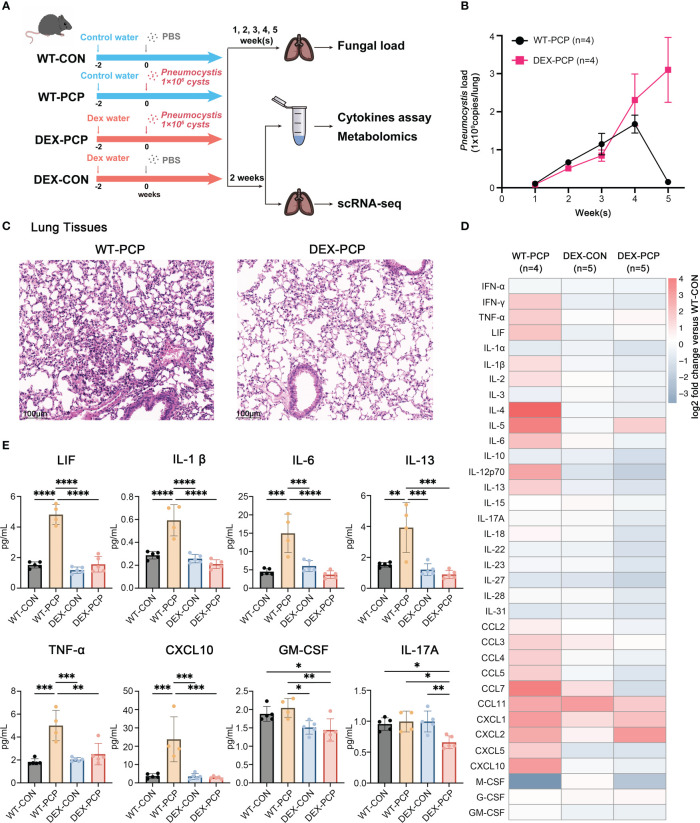
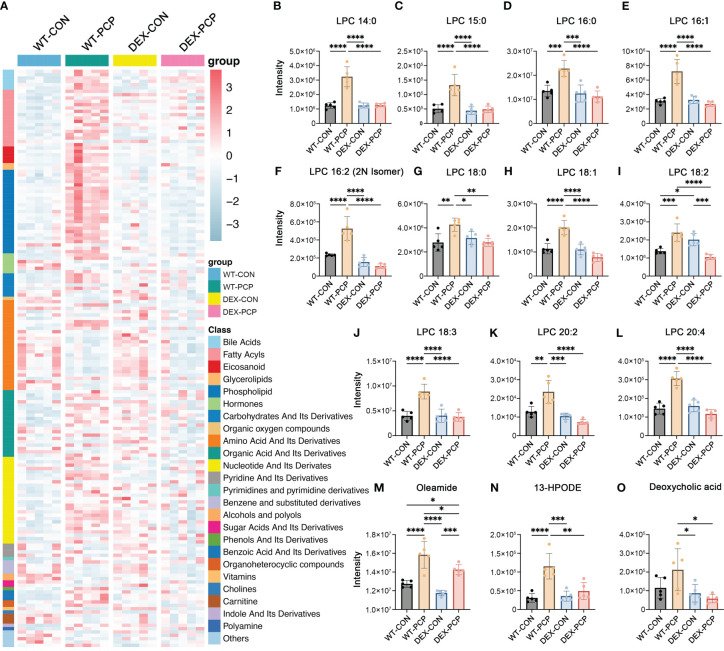
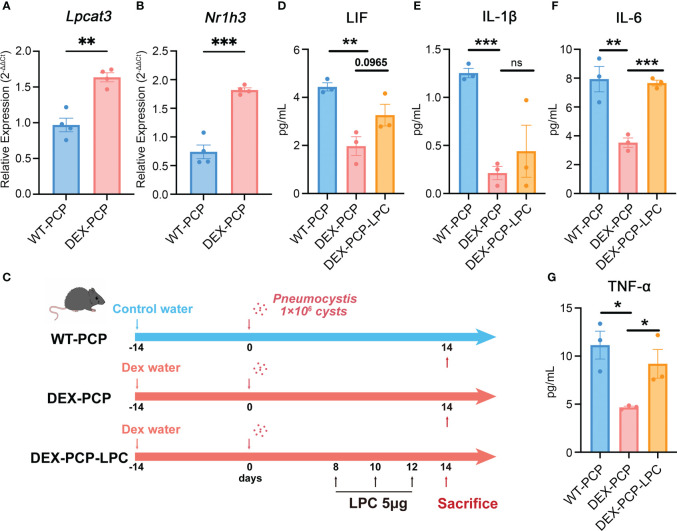
Methods: In this study, wild type C57BL/6 mice or dexamethasone-treated mice were injected with or without Pneumocystis. Bronchoalveolar lavage fluids (BALFs) were harvested for the multiplex cytokine and metabolomics analysis. The single-cell RNA sequencing (scRNA-seq) of indicated lung tissues or BALFs was performed to decipher the macrophages heterogeneity. Mice lung tissues were further analyzed via quantitative polymerase chain reaction (qPCR) or immunohistochemical staining.

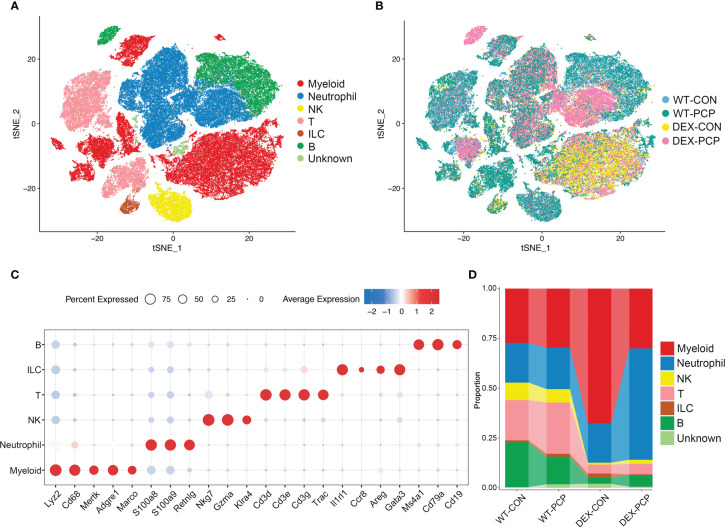
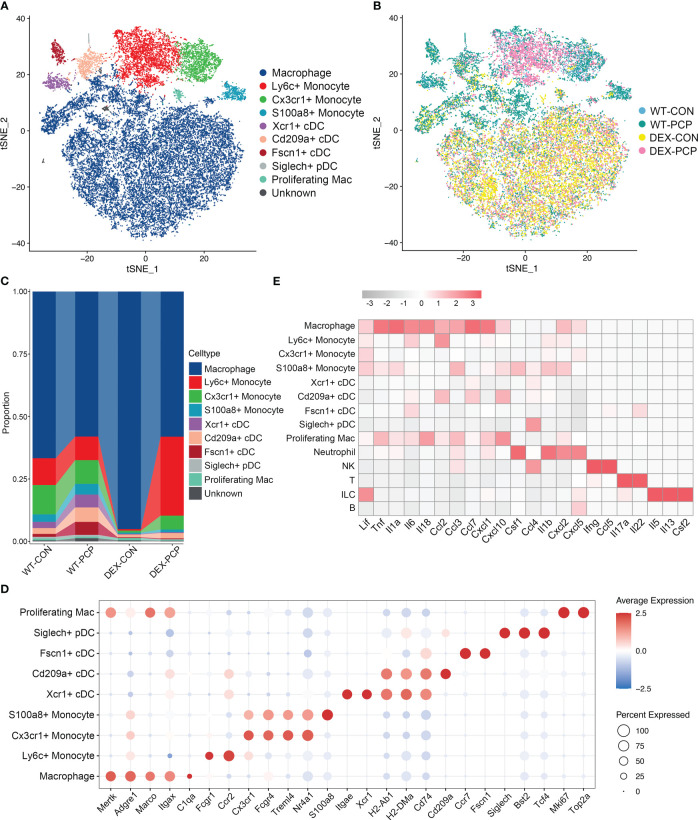
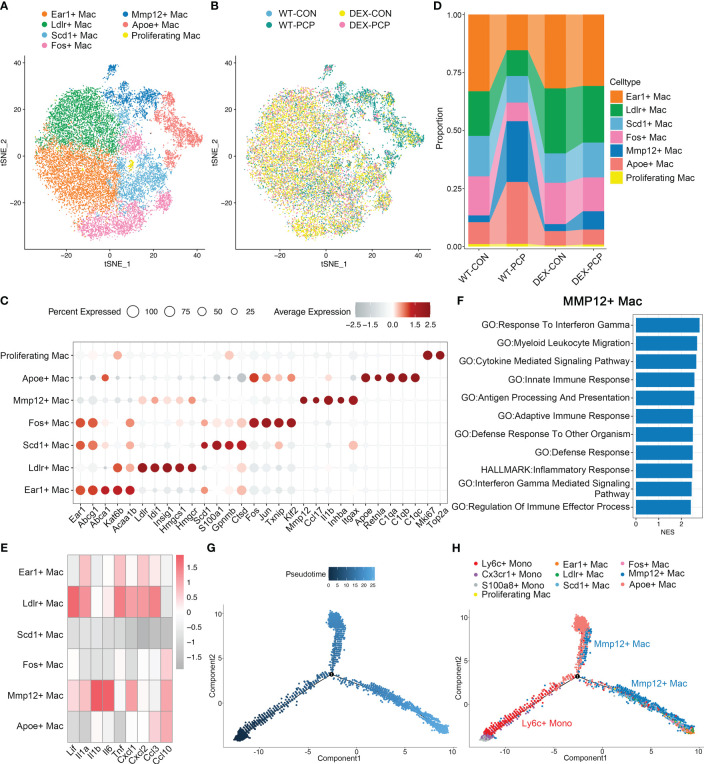
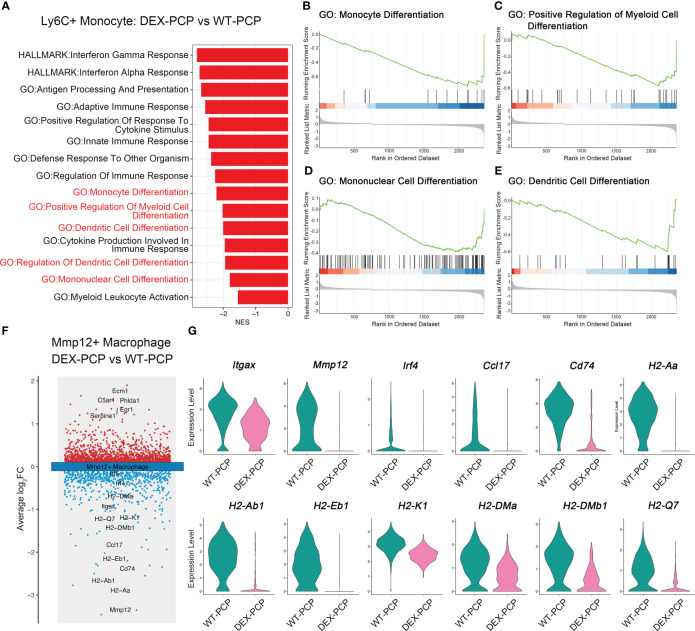
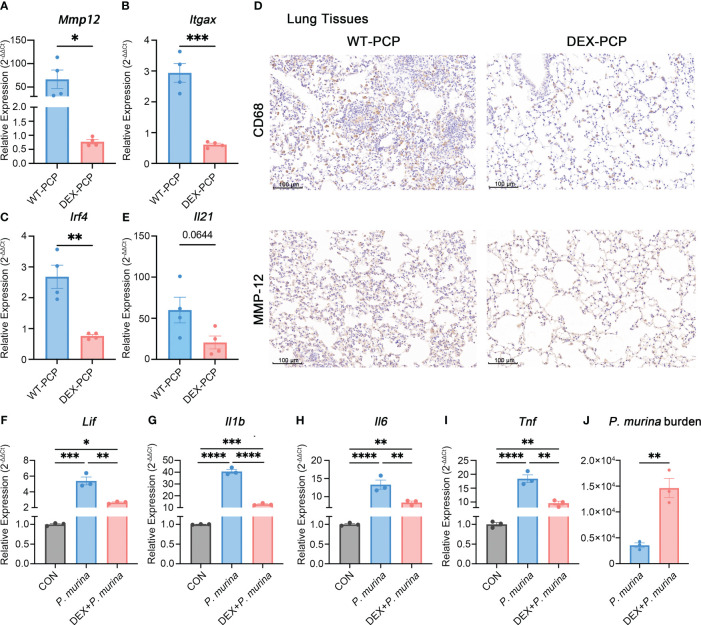
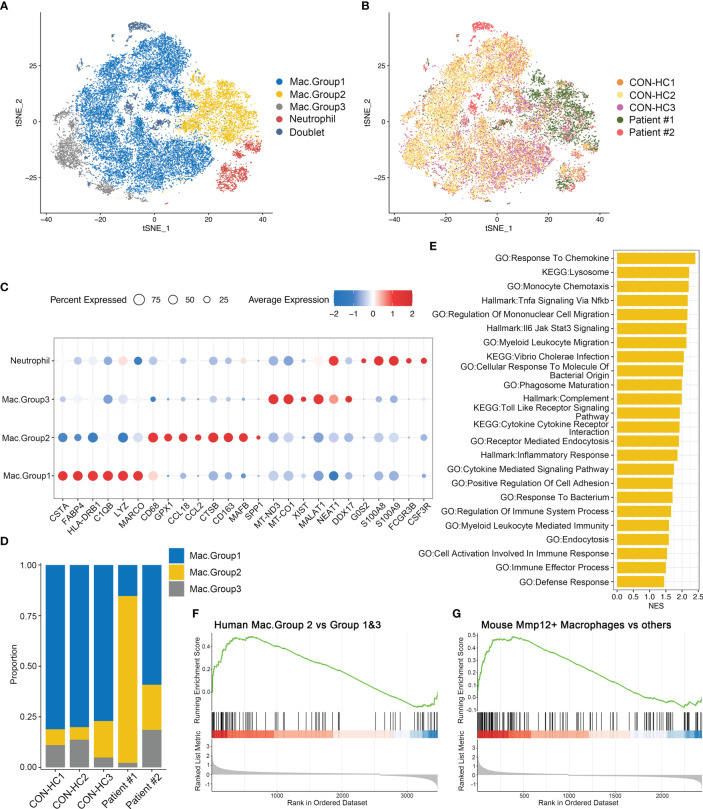
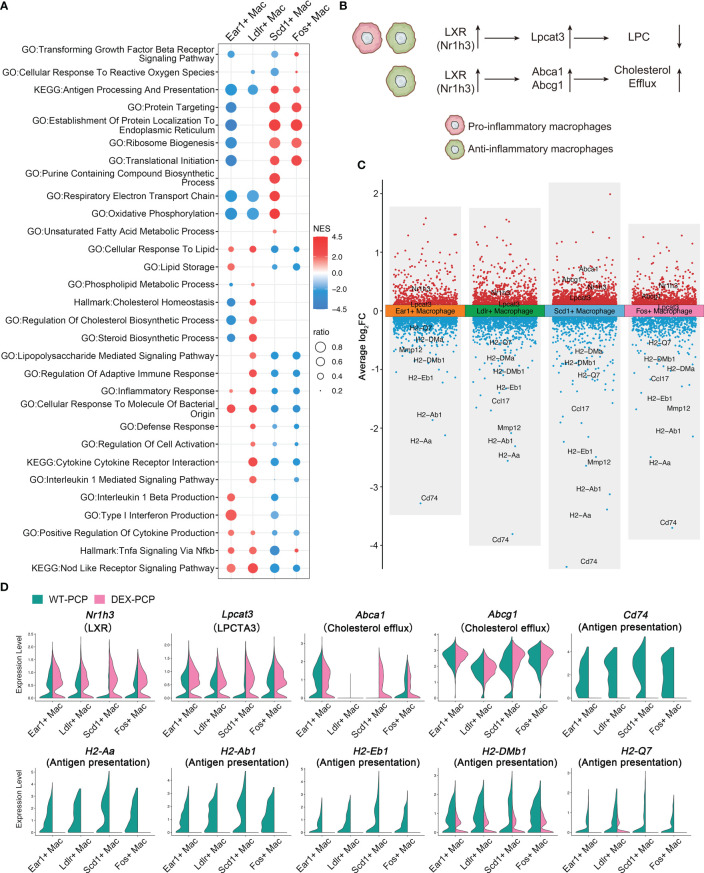
Results: We found that the secretion of both pro-inflammatory cytokines and metabolites in the Pneumocystis-infected mice are impaired by glucocorticoids. By scRNA-seq, we identified seven subpopulations of macrophages in mice lung tissues. Among them, a group of Mmp12+ macrophages is enriched in the immunocompetent mice with Pneumocystis infection. Pseudotime trajectory showed that these Mmp12+ macrophages are differentiated from Ly6c+ classical monocytes, and highly express pro-inflammatory cytokines elevated in BALFs of Pneumocystis-infected mice. In vitro, we confirmed that dexamethasone impairs the expression of Lif, Il1b, Il6 and Tnf, as well as the fungal killing capacity of alveolar macrophage (AM)-like cells. Moreover, in patients with PCP, we found a group of macrophages resembled the aforementioned Mmp12+ macrophages, and these macrophages are inhibited in the patient receiving glucocorticoid treatment. Additionally, dexamethasone simultaneously impaired the functional integrity of resident AMs and downregulated the level of lysophosphatidylcholine, leading to the suppressed antifungal capacities.

Conclusion: We reported a group of Mmp12+ macrophages conferring protection during Pneumocystis infection, which can be dampened by glucocorticoids. This study provides multiple resources for understanding the heterogeneity and metabolic changes of innate immunity in immunocompromised hosts, and also suggests that the loss of Mmp12+ macrophages population contributes to the pathogenesis of immunosuppression-associated pneumonitis.

Keywords: Pneumocystis pneumonia; glucocorticoids; immunosuppression; macrophages; single-cell RNA sequencing.


Conflict of interest statement

The authors declare that the research was conducted in the absence of any commercial or financial relationships that could be construed as a potential conflict of interest.

Figures

Figure 1
Figure 1
Dexamethasone impairs Pneumocystis clearance and cytokines secretion in mice. (A) Schematic diagram for the infection schedule and overall study design. Mice were exposed to DEX or not for 2 weeks and then were intratracheally instilled with Pneumocystis of 1×10⁶ cysts. These mice were sacrificed at different time points and lung tissues or BALFs were then collected for analysis of Pneumocystis burden, cytokines, metabolites or scRNA-seq. (B) Mice were incubated with Pneumocystis intratracheally and monitored for Pneumocystis burden in WT-PCP and DEX-PCP mice over the 5-week course of infection (n = 4 per group). (C) The pathological characteristics demonstrated by H&E staining in WT-PCP and DEX-PCP mice at 2 weeks post infection. (D) Heatmap for multiplex analysis of cytokines in BALFs at 2 weeks post infection for indicated groups of mice (n = 4 or 5 per group). Values represent log2 fold change versus the WT-CON group. (E) Bar plots showing selected differentially expressed cytokines in BALFs from (D). In (B), the results were presented as means ± SE of 4 mice per group in each experiment, performed in triplicate. In (E), the results were presented as means ± SD of 4 or 5 mice per group. Comparisons were evaluated by one-way ANOVA for multiple comparisons. *p < 0.05, **p < 0.01, ***p < 0.001, ****p < 0.0001.
Figure 2
Figure 2
Metabolomic features of BALFs derived from mice with Pneumocystis infection. (A) Heatmap showing the differentially expressed metabolites for WT-PCP versus WT-CON and DEX-PCP. The result showed significant changes in the levels of bile acids, fatty acyls, eicosanoid, glycerolipids and phospholipids. (B–L) Bar plots showing differentially expressed metabolites LPC belonging to phospholipids from (A). (M–O) Bar plots showing differentially expressed metabolites oleamide (fatty acyls), 13-HPODE (eicosanoid) and deoxycholic acid (bile acid) from (A). The results were presented as means ± SD of 5 mice per group. Comparisons were evaluated by one-way ANOVA for multiple comparisons. *p < 0.05, **p < 0.01, ***p < 0.001, ****p < 0.0001.
Figure 3
Figure 3
Single-cell analysis reveals aberrant immune cell composition in immunosuppressive Pneumocystis-infected mice. (A) t-SNE plot for 84149 immune cells, color-coded by cell types. (B) t-SNE plot for 84149 immune cells, color-coded by groups with 21861 cells from WT-CON group, 22822 cells from WT-PCP group, 14728 cells form DEX-CON group and 24738 cells from DEX-PCP group (n =3 per group). (C) Dot plot showing the average expression of canonical markers of each cell type. Data were colored based on the gene expression levels. (D) Stacked bar plot showing the average proportion of each immune cell type from each group.
Figure 4
Figure 4
Dissection of myeloid cells showing anti-microbial functions of macrophages during Pneumocystis infection. (A) t-SNE plot for 30150 myeloid cells, color-coded by cell types. (B) t-SNE plot for 30150 myeloid cells, color-coded by groups with 5963 cells from WT-CON group, 6776 cells from WT-PCP group, 9981 cells form DEX-CON group and 7430 cells from DEX-PCP group. (C) Stacked bar plot showing the average proportion of each myeloid cell type from each group, with macrophages accounting for a large proportion. (D) Dot plot of the average expression of canonical markers of each cell type. Data were colored based on the gene expression levels. (E) Heatmap of gene expression of GM-CSF and pro-inflammatory cytokines detected in BALFs in Figure 1 for each subtype from all samples.
Figure 5
Figure 5
Mmp12+ macrophages are enriched during Pneumocystis infection. (A) t-SNE plot for 21720 macrophages, color-coded by cell types. (B) t-SNE plot of 21720 macrophages, color-coded by groups with 3979 cells from WT-CON group, 3934 cells from WT-PCP group, 9490 cells form DEX-CON group and 4317 cells from DEX-PCP group. (C) Dot plot of the average expression of highly expressed genes for each subtype. Data were colored based on the expression levels. (D) Stacked bar plot showing the average proportion of each macrophage cell type from each group, with Mmp12+ macrophages varying obviously. (E) Heatmap of genes expression of pro-inflammatory cytokines detected in BALFs in Figure 1 for each macrophage subtype further suggesting the protective function of Mmp12+ macrophages. (F) GSEA analysis using DEGs of Mmp12+ macrophages versus other macrophages to explore the functions of Mmp12+ macrophages. (G, H). Differentiation trajectory inferred of Mmp12+ macrophage via Monocle2 using all monocytes and macrophages from WT-PCP group, colored by pseudotime in (G) and cell type in (H).
Figure 6
Figure 6
Dexamethasone impairs the differentiation of Mmp12+ macrophages from Ly6c+ monocytes. (A) GSEA analysis of DEGs of Ly6c+ monocytes from DEX-PCP versus WT-PCP group. (B–E) Selected enriched pathways in (A) were displayed. (F) Volcano plot showing the DEGs of Mmp12+ macrophages from DEX-PCP versus WT-PCP group, revealing genes responsive to GM-CSF were significantly downregulated in DEX-PCP mice. (G) Violin plots showing the expression level for selected genes esponsive to GM-CSF in Mmp12+ macrophages from DEX-PCP versus WT-PCP.
Figure 7
Figure 7
Dexamethasone treatment reduces the number of Mmp12+ macrophages and impairs the fungal killing capacity of macrophages. (A–C) Analysis of Mmp12, Itgax and Irf4 mRNA levels in WT-PCP and DEX-PCP mice lungs by qPCR. (D) Detection of CD68 and MMP-12 in lung tissue sections by immunohistochemistry. Representative images were shown. (E) Analysis of Il21 mRNA level in WT-PCP and DEX-PCP mice lungs by qPCR. In (A–C, E) data are presented as the means ± SE fold change in Mmp12, Itgax, Irf4 and Il21 mRNA levels normalized to the β-actin mRNA compared with WT-CON mice. Comparisons were evaluated by unpaired Student’s t test. (F–I) Analysis of Lif, Il1b, Il6 and Tnf mRNA levels in AM-like cells at 2 hr post P. murina incubation following DEX-treatment. Data are presented as means ± SE and multiple comparisons were evaluated by one-way ANOVA. (J) Detection of P. murina burden at 24 hr post P. murina incubation following DEX-treatment. Data are presented as means ± SE and comparisons were evaluated by unpaired Student’s t test. *p < 0.05, **p < 0.01, ***p < 0.001, ****p < 0.0001.
Figure 8
Figure 8
Group 2 macrophages in patients with PCP resemble Mmp12+ macrophages in mice. (A) t-SNE plot for 27118 myeloid cells and neutrophils, color-coded by cell types. (B) t-SNE plot for 27118 cells, color-coded by donors with 8888 cells from CON-HC1, 8880 cells from CON-HC2, 4032 cells from CON-HC3, 3853 cells from Patient #1 ((Non-glucocorticoids) and 1465 cells from Patient #2 (Glucocorticoids). (C) Dot plot of the average expression of highly expressed genes for each subtype. Data were colored based on the expression levels. (D) Stacked bar plot showing the average proportion of each macrophage group from each donor, with group 2 macrophage varying obviously. (E) GSEA analysis of DEGs of group 2 macrophages versus group 1&3 macrophages to explore the functions of group 2 macrophages. (F) GSEA analysis of DEGs of group 2 macrophages versus group 1&3 macrophages using signatures of Mmp12+ macrophages in mouse dataset. (G) GSEA analysis of DEGs of mouse Mmp12+ macrophages versus other macrophages using signatures of group 2 macrophages in human dataset.
Figure 9
Figure 9
Dexamethasone treatment leads to the dysfunction of four resident AMs subtypes. (A) Dot plot for enriched pathways via GSEA analysis of each resident AMs subtype versus other macrophages, showing two distinct gene expression patterns. (B) Schematic plot showing impacts DEX extered on different resident AMs subtypes. (C) Volcano plot showing the DEGs for each resident AMs subtype in DEX-PCP versus WT-PCP counterpart. (D) Violin plots showing expression levels of selected genes involved in LPCs, cholesterol efflux and responsive to GM-CSF in each resident AMs subtype from DEX-PCP and WT-PCP group.
Figure 10
Figure 10
LPC treatment partially rescues the pro-inflammatory cytokines expression in dexamethasone-treated mice. (A, B) Analysis of Lpcat3 and Nr1h3 mRNA levels in WT-PCP and DEX-PCP mice lungs by qPCR. (C) Schematic plot for the LPC exposure schedule and study design. DEX-treated immunosuppressive mice were challenged with Pneumocystis of 1×10⁶ cysts. Then these mice were intratracheally administered LPC 5 μg each time on day 8, day 10 and day 12 post infection. Mice were sacrificed on day 14 post infection and BALFs were collected to analyze the levels of cytokines. (D–G) Bar plots showing the levels of LIF, IL-1β, IL-6 and TNF-α in BALFs from indicated group of mice in (C) (n = 3 per group). In (A, B), data are presented as the means ± SE fold change in Lpcat3 and Nr1h3 mRNA level normalized to the β-actin mRNA compared with WT-CON mice. In (D–G), data are presented as the means ± SE. Comparisons were evaluated by unpaired Student’s t test. *p < 0.05, **p < 0.01, ***p < 0.001, ****p < 0.0001.

Similar articles

Cited by

References

    1. Kelly MN, Shellito JE. Current understanding of pneumocystis immunology. Future Microbiol (2010) 5(1):43–65. doi: 10.2217/fmb.09.116 - DOI - PMC - PubMed
    1. Salzer HJF, Schäfer G, Hoenigl M, Günther G, Hoffmann C, Kalsdorf B, et al. . Clinical, diagnostic, and treatment disparities between hiv-infected and non-Hiv-Infected immunocompromised patients with pneumocystis jirovecii pneumonia. Respiration (2018) 96(1):52–65. doi: 10.1159/000487713 - DOI - PubMed
    1. Martin-Garrido I, Carmona EM, Specks U, Limper AH. Pneumocystis pneumonia in patients treated with rituximab. Chest (2013) 144(1):258–65. doi: 10.1378/chest.12-0477 - DOI - PMC - PubMed
    1. Charpentier E, Ménard S, Marques C, Berry A, Iriart X. Immune response in pneumocystis infections according to the host immune system status. J Fungi (Basel Switzerland) (2021) 7(8):625–45. doi: 10.3390/jof7080625 - DOI - PMC - PubMed
    1. Rong H-M, Li T, Zhang C, Wang D, Hu Y, Zhai K, et al. . Il-10-Producing b cells regulate Th1/Th17-cell immune responses in pneumocystis pneumonia. Am J Physiol Lung Cell Mol Physiol (2019) 316(1):L291–301. doi: 10.1152/ajplung.00210.2018 - DOI - PubMed

Publication types

Grants and funding

This work was supported by the National Natural Science Foundation of China (82070005, 82270009, 82172278), the National Natural Youth Science Foundation of China (82100006), the National Key Research and Development Program of China (2021YFC0863600, 2023YFC0872500), the Beijing Natural Science Foundation (JQ22019), the Capital’s Funds for Health Improvement and Research (CFH2022-1-1061), the Beijing Scholars Program (No. 062), the Reform and Development Program of Beijing Institute of Respiratory Medicine.