. 2023 Jun 23;13(1):10204.
doi: 10.1038/s41598-023-37102-3.

Using macular velocity measurements to relate parameters of bone conduction to vestibular compound action potential responses

Affiliations

Using macular velocity measurements to relate parameters of bone conduction to vestibular compound action potential responses

Christopher J Pastras et al. Sci Rep. .

Abstract

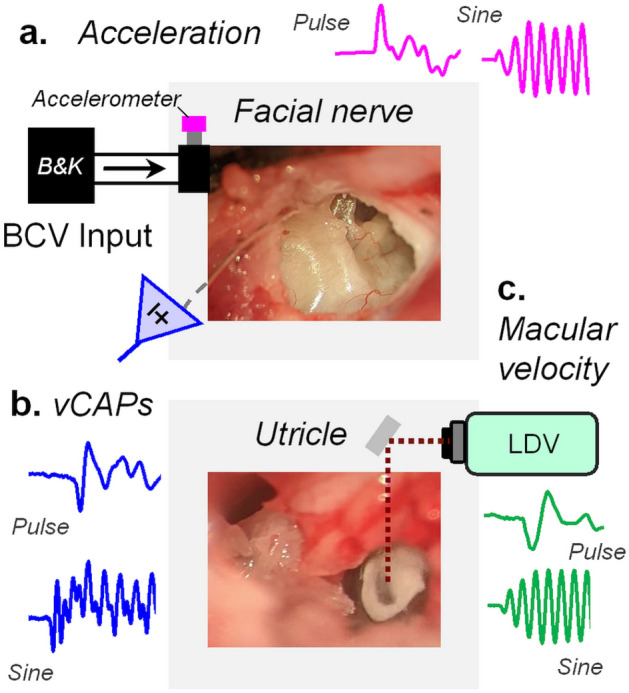
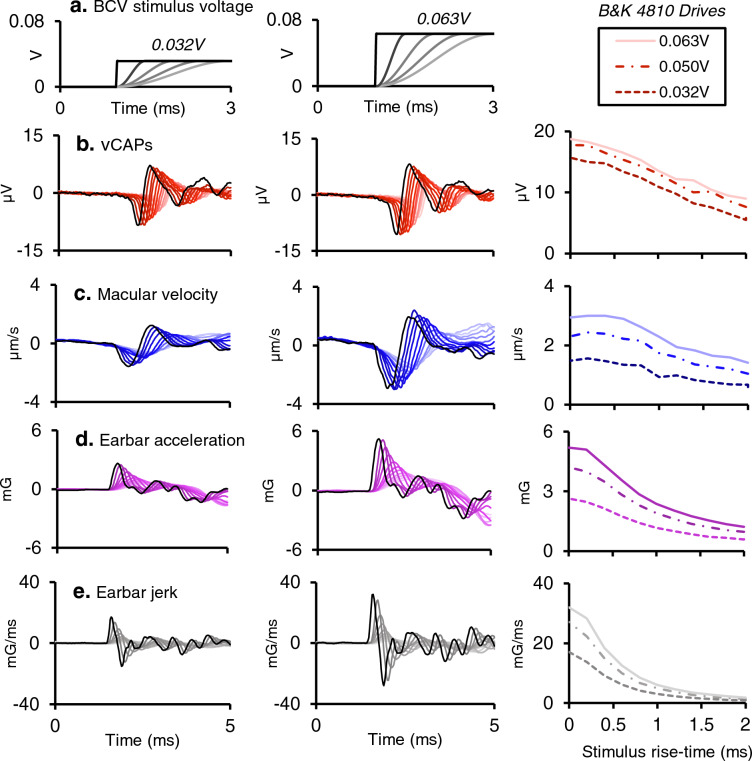
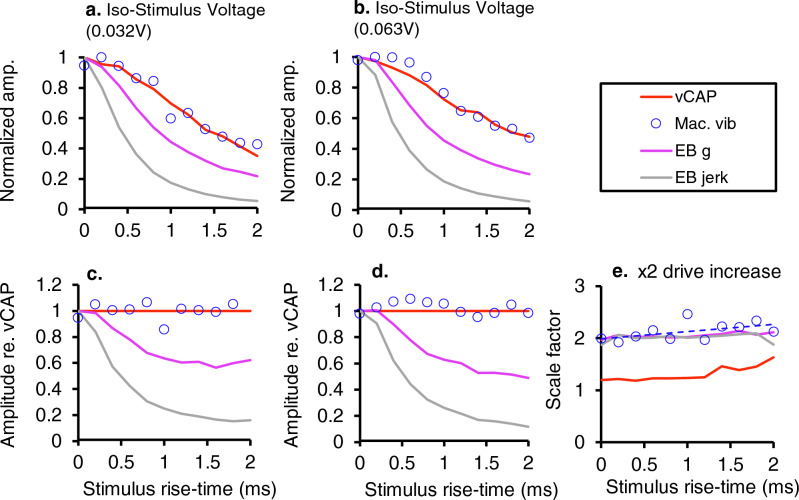
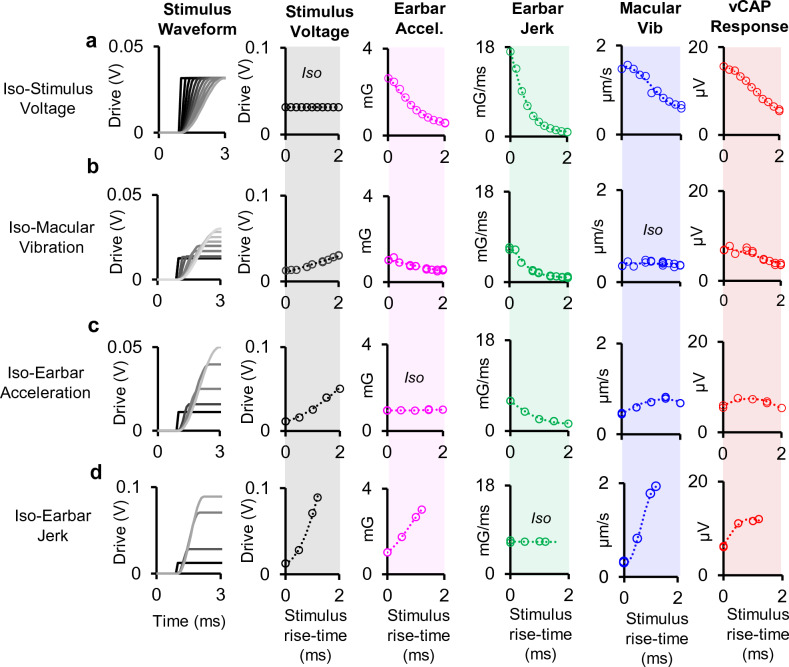
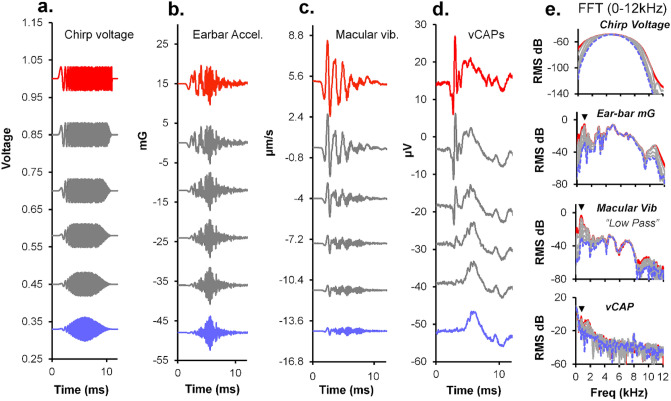
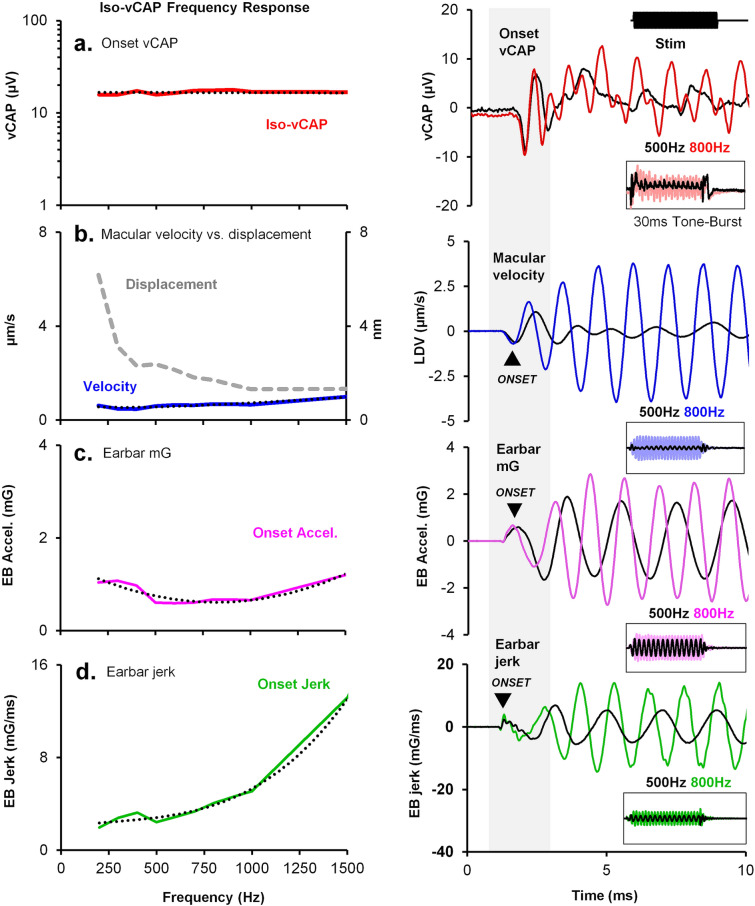
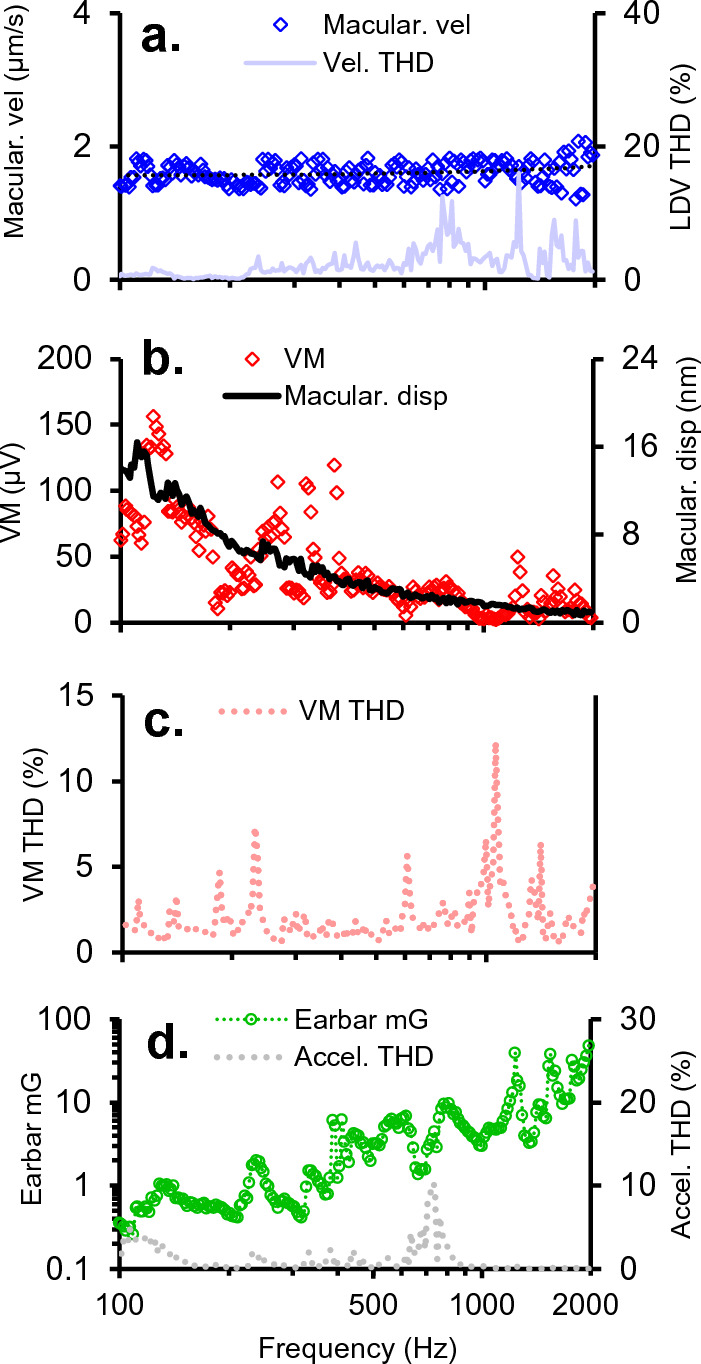
To examine mechanisms responsible for vestibular afferent sensitivity to transient bone conducted vibration, we performed simultaneous measurements of stimulus-evoked vestibular compound action potentials (vCAPs), utricular macula velocity, and vestibular microphonics (VMs) in anaesthetized guinea pigs. Results provide new insights into the kinematic variables of transient motion responsible for triggering mammalian vCAPs, revealing synchronized vestibular afferent responses are not universally sensitive to linear jerk as previously thought. For short duration stimuli (< 1 ms), the vCAP increases magnitude in close proportion to macular velocity and temporal bone (linear) acceleration, rather than other kinematic elements. For longer duration stimuli, the vCAP magnitude switches from temporal bone acceleration sensitive to linear jerk sensitive while maintaining macular velocity sensitivity. Frequency tuning curves evoked by tone-burst stimuli show vCAPs increase in proportion to onset macular velocity, while VMs increase in proportion to macular displacement across the entire frequency bandwidth tested between 0.1 and 2 kHz. The subset of vestibular afferent neurons responsible for synchronized firing and vCAPs have been shown previously to make calyceal synaptic contacts with type I hair cells in the striolar region of the epithelium and have irregularly spaced inter-spike intervals at rest. Present results provide new insight into mechanical and neural mechanisms underlying synchronized action potentials in these sensitive afferents, with clinical relevance for understanding the activation and tuning of neurons responsible for driving rapid compensatory reflex responses.


Conflict of interest statement

The authors declare no competing interests.

Figures

Figure 1
Figure 1
The experimental approach to record vestibular afferent and vibration responses. The guinea pig was mounted in custom-made ear bar frames, and surgery was performed to access the tympanic bulla and sensory end-organs of the labyrinth using a ventral approach. (a) Transient pulsatile or sinusoidal tone burst BCV stimuli (magenta) were used to evoke, (b) synchronized vestibular Compound Action Potentials (vCAPs) (blue) recorded from the facial nerve canal in anesthetized guinea pigs. (c) Simultaneous measurements of macular vibration (green) were measured from reflective microbeads placed on the basal epithelial surface of the utricle via Laser Doppler Vibrometry (LDV).
Figure 2
Figure 2
Simultaneous recordings of vCAPs, macular velocity, earbar acceleration and earbar jerk during Iso-Stimulus Voltage to the minishaker at different intensities, between 0.032 and 0.063 V. (a) The BCV voltage drive to the minishaker was kept constant whilst the stimulus rise fall-time was varied between 0 and 2 ms (0–50% stimulus waveform) for a 4 ms BCV monophasic pulse for 0.032 V (Left panel) and 0.063 V (Middle panel). Simultaneously measured responses include (b) vestibular compound action potentials (vCAPs) (red), (c) Laser Doppler vibrometry (LDV) measurements of utricular macular velocity recorded from a reflective microbead from the basal epithelial surface, (blue), (d) linear acceleration (magenta), and its derivative, (e) linear jerk (grey) recorded from a triaxial accelerometer coupled to the earbar near the skull. Responses in the left and middle panel correspond to the lowest (0.032 V) and highest (0.063 V) stimulus intensity, respectively. Peak-peak amplitudes for vCAPs, macular velocity, earbar acceleration, and earbar jerk are displayed in the right panel associated with changes in drive and stimulus rise-time.
Figure 3
Figure 3
Normalized amplitudes and comparative scaling of vCAPs, macular velocity, earbar acceleration, and earbar jerk during BCV Iso-Stimulus Voltage (a, b). When the stimulus voltage to the minishaker was fixed (Iso-Stimulus Voltage) and rise-time was altered, vCAPs scaled closely with macular velocity. In terms of earbar kinematics, vCAPs scaled most closely with linear acceleration, rather than the first derivative, earbar jerk, for pulsatile BCV (c, d). Response parameter amplitudes normalized to vCAPs further emphasise macular velocity closely follows vCAP scaling during BCV across changes in stimulus rise-times, and vCAPs are more sensitive to acceleration rather than jerk (e). Response scaling associated with a doubling in BCV drive associated with changes in stimulus rise-time reveals vestibular afferents driving vCAPs have a compressive nonlinear scaling, whereas macular and earbar macromechanics have a passive and linear scaling.
Figure 4
Figure 4
Multi-parametric comparisons of macular responses and input drives with changes in stimulus rise-time. Simultaneous measurements of stimulus voltage (grey), earbar acceleration (magenta), earbar jerk (green), macular velocity (blue), and vCAPs (red) associated with (a). Fixed peak voltage to minishaker (changes in rise time) or Iso-Stimulus Voltage. (b) Fixed peak macular velocity or Iso-Macular Velocity. (c) Fixed peak temporal bone acceleration or Iso-Linear Acceleration, and (d) Fixed peak temporal bone jerk or Iso-Linear Jerk.
Figure 5
Figure 5
vCAP and macular sensitivity to broadband BCV chirps with changes in stimulus rise-time. (a) The rise-time of a 10 ms BCV Up-sweep chirp was varied from 0 and 5 ms (0–50% stimulus waveform) and simultaneous measurements of (b) linear acceleration, (c) macular velocity, and (d) vCAPs were recorded. (e) Associated FFT spectra (Hanning window) for waveforms displayed in a-d. Arrowheads show relevant frequency characteristics for generating synchronized vCAPs (spectra below 2 kHz).
Figure 6
Figure 6
The relationship between chirp direction, vCAP response generation and latency. (a) Up-sweep versus down-sweep BCV chirps generated (b) vCAPs with similar amplitudes but with largely different latencies, which were temporally synced to the low-frequency component of the broadband stimulus. (c) Simultaneously measured skull jerk, and (d) skull acceleration recordings reveal the bandlimited onset or offset of the up- or down-sweep acceleration waveform is the relevant stimulus component to generate vCAPs, and not the higher-frequency components. Inset: Chirp stimulus power spectrum (Hanning window).
Figure 7
Figure 7
Iso-vCAP frequency response tuning curve. Left panel. (a) Onset vCAPs were kept constant during a 30 ms BCV tone burst (0 ms rise-time) across frequency (up to 1.5 kHz), with simultaneous measurements of (b) macular velocity, (c) linear acceleration, and d. its kinematic derivative, linear jerk. For a flat vCAP amplitude across frequency (Iso-vCAP), macular velocity also remained relatively flat, suggesting the primary afferents generating vCAPs are sensitive to macular velocity and not macular displacement for BCV tone-burst stimuli. In terms of cranial sensitivity, earbar acceleration changed by approximately a factor of ~ 0.3x, whereas earbar jerk changed by ~ 7x, suggesting vestibular afferent sensitivity is more likely to occur when acceleration is the main determinant, rather than kinematic jerk. Right panel. Representative waveform comparisons for the onset vCAP, macular velocity, linear acceleration, and linear jerk associated with a 500 Hz (black) and 800 Hz (coloured) tone-burst, respectively (10 ms window). Inset: Entire 50 ms time-domain window of the tone-burst response.
Figure 8
Figure 8
BCV vestibular microphonic (VM) frequency tuning curve. (a) Macular velocity (blue) measured via laser Doppler vibrometry (LDV), was kept constant for BCV stimuli between 100 and 2000 Hz (Iso-Macular Velocity), with simultaneous measurements of LDV total harmonic distortion (THD; light blue), (b) vestibular microphonics (VMs), macular displacement (taken as the integral of LDV macular velocity), (c) vestibular microphonic THD, (d) linear acceleration and the associated linear acceleration THD. In contrast to the vCAP (Fig. 7), results reveal that the VM increased in close proportion to macular displacement, indicating the net MET current entering hair cells proximal to the electrode was gated primarily by displacement and not velocity. Differences between hair cell and neural response dynamics reflect adaptation signal processing placed between the MET current and action potential generator in vestibular primary afferents.

Similar articles

Cited by

References

    1. Straka H, Baker R. Vestibular blueprint in early vertebrates. Front. Neural Circuits. 2013;7:182. doi: 10.3389/fncir.2013.00182. - DOI - PMC - PubMed
    1. Eatock RA. Specializations for fast signaling in the amniote vestibular inner ear. Integr. Comp. Biol. 2018;58:341–350. doi: 10.1093/icb/icy069. - DOI - PMC - PubMed
    1. Fuchs PA. Vestibular calyx, potassium: Kalium in calyx regnat. J. Physiol. 2017;595:623. doi: 10.1113/JP273432. - DOI - PMC - PubMed
    1. Fritzsch B. Evolution of the vestibulo-ocular system. Otolaryngol. Head Neck Surg. 1998;119:182–192. doi: 10.1016/S0194-5998(98)70053-1. - DOI - PubMed
    1. Schulz-Mirbach T, Ladich F, Plath M, Heß M. Enigmatic ear stones: What we know about the functional role and evolution of fish otoliths. Biol. Rev. 2019;94:457–482. doi: 10.1111/brv.12463. - DOI - PubMed

Publication types