. 2023 Jun 22;14(1):3720.
doi: 10.1038/s41467-023-39326-3.

Defining diurnal fluctuations in mouse choroid plexus and CSF at high molecular, spatial, and temporal resolution

Affiliations

Defining diurnal fluctuations in mouse choroid plexus and CSF at high molecular, spatial, and temporal resolution

Ryann M Fame et al. Nat Commun. .

Abstract

Transmission and secretion of signals via the choroid plexus (ChP) brain barrier can modulate brain states via regulation of cerebrospinal fluid (CSF) composition. Here, we developed a platform to analyze diurnal variations in male mouse ChP and CSF. Ribosome profiling of ChP epithelial cells revealed diurnal translatome differences in metabolic machinery, secreted proteins, and barrier components. Using ChP and CSF metabolomics and blood-CSF barrier analyses, we observed diurnal changes in metabolites and cellular junctions. We then focused on transthyretin (TTR), a diurnally regulated thyroid hormone chaperone secreted by the ChP. Diurnal variation in ChP TTR depended on Bmal1 clock gene expression. We achieved real-time tracking of CSF-TTR in awake TtrmNeonGreen mice via multi-day intracerebroventricular fiber photometry. Diurnal changes in ChP and CSF TTR levels correlated with CSF thyroid hormone levels. These datasets highlight an integrated platform for investigating diurnal control of brain states by the ChP and CSF.


Conflict of interest statement

The authors declare no competing interests.

Figures
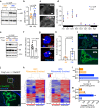
Fig. 1
Fig. 1. Choroid plexus translation is diurnally regulated to be higher during the dark phase.
a Immunoblotting of ChP protein extracts showed increased S6 phosphorylation (pS6) relative to total S6 at 9 p.m. (blue) compared to 9 a.m (orange). All vignettes were cropped from the same membrane. b Ratio of pS6 to total S6 immunoblotting at 9 a.m. (orange) and 9 p.m. (blue). *p < 0.05 (p = 0.038) Student’s two-tailed unpaired t test, N = 9 biologically independent animals at each time over 3 independent experiments. Data are presented as mean values ± standard deviation (SD). c Immunostaining for pS6 in lateral ventricle (LV) ChP also shows increased pS6 at 9 p.m.; scale bar = 50 μm. d RT-qPCR analysis of Bmal1 expression in LV ChP (blue) and liver (red) showed cycling of the molecular clock and revealed similar phase between the two tissues. Data are presented as mean values ± standard deviation (SD). e Immunoblotting of ChP protein extracts for pS6 showed that increased S6 phosphorylation at 9 p.m. is dependent on Bmal1. f Ratio of pS6 to total S6 from immunoblots of ChP from Bmal1-null vs. WT mice. **p < 0.01 (p = 0.0017) Student’s two-tailed unpaired t test, N = 8 biologically independent animals at each time over 4 independent experiments. Data are presented as mean values ± standard deviation (SD). g Immunohistochemistry of the nucleolar protein Fibrillarin (red) in ChP epithelial cells showed larger nucleoli at 9 p.m., during the dark phase; scale bar = 5 μm. N = 4 at each time. h Quantification of median nucleolar volume. *p < 0.05 Student’s two-tailed unpaired t test, N = 5 biologically independent animals at each time over 2 independent experiments. Data are presented as mean values of the median of 50 nucleoli per animal ± standard error of the mean (SEM). i OPP incorporation assay in adult ChP epithelial cells showed an increased rate of protein synthesis at 9 p.m. than at 9 a.m.; scale bar = 100 μm. j RPL10A-conjugated EGFP expression in ChP epithelial cells after Foxj1-Cre recombination in TRAP-BAC mice; scale bar = 100 μm. k Heatmaps and hierarchical clustering of transcripts associated with RPL10A vs. those in the supernatant at either 9 a.m. or 9 p.m. (adjusted p < 0.05). l Number of distinct, unique protein-coding genes on (solid) or off (transparent) the RPL10A ribosomal subunit at 9 a.m. (orange) and 9 p.m. (blue) (adjusted p < 0.05). m Average FPKM of protein-coding genes on (solid) or off (transparent) the RPL10A ribosomal subunit at 9 a.m. (orange) and 9 p.m. (blue) (adjusted p < 0.05). N = 3 biologically independent samples (LV ChP pooled from three animals per sample) at each time in 1 experiment. Data are presented as mean values ± standard deviation (SD). Male mice were analyzed. Source data are provided as a Source Data file (Source Data).
Fig. 2
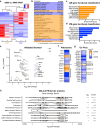
Fig. 2. Association of ChP cytoplasmic, membrane bound, and secreted protein mRNAs with the ribosome is diurnally regulated.
a Heatmaps and hierarchical clustering of z-scores for transcripts associated with RPL10A in LV ChP at 9 a.m. vs. 9 p.m. (adjusted p < 0.05). CuffDiff; adjusted p < 0.05; |log2 FC|>0.4. b All significantly regulated pathways from pathway enrichment and overrepresentation analysis (corrected for false discovery rate (FDR). c, d Top 7 enriched functional annotation clusters by DAVID in LV ChP at 9 a.m. (orange) and 9 p.m. (blue). e Volcano plot of significantly enriched RPL10A-associated transcripts with a product predicted to be secreted from LV ChP at 9 a.m. (orange) and 9 p.m. (blue). *p ≤ 0.01; **p ≤ 0.001; ***p ≤ 0.0001; ****p ≤ 0.00001; adjusted p values. f TRAP data for the individual genes associated with ribosomes and mitoribosomes. *p ≤ 0.01; **p ≤ 0.001; adjusted p values. g TRAP data for the individual genes associated with oxidative phosphorylation. *p ≤ 0.01; **p ≤ 0.001; ***p ≤ 0.0001; ****p ≤ 0.00001; adjusted p values. h TRAP data for the enriched pathways associated with barrier permeability. The median log2 fold change value is indicated by the solid vertical bar. *p ≤ 0.01; **p ≤ 0.001; ***p ≤ 0.0001; ****p ≤ 0.00001; adjusted p values. Male mice were analyzed. Source data are provided as a Source Data file (Source Data).
Fig. 3
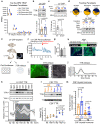
Fig. 3. Ttr is preferentially translated by the ChP during the dark phase and is dependent on feeding.
a The top 5 TRAP candidates enriched at 9 p.m. from ChP TRAP pulldown. FPKM for each individual mouse is shown at 9 a.m. (orange circles) and 9 p.m. (blue squares) for those transcripts associated with RPL10A (solid circles) and those in the supernatant (empty circles). These are candidates for preferential regulation at the level of translation. N = 3 biologically independent samples (LV ChP pooled from 3 animals per sample). Data are presented as mean values ± SEM. b Immunoblotting analysis and quantification of LV ChP expression of TTR protein. *p < 0.05 (p = 0.0475); Student’s two-tailed unpaired t test, N = LV ChP from 10 biologically independent animals at each time over 3 independent experiments. Data are presented as mean values ± standard deviation (SD). c Immunoblotting of ChP protein extracts for TTR showed that increased protein levels at 9 p.m. is dependent on Bmal1. Quantification of the TTR intensity ratio between 9 a.m. and 9 p.m. in WT and Bmal1−/− animals. *p < 0.05 (p = 0.0118); Student’s two-tailed unpaired t test, N = 8 ratios from biologically independent pairs of animals from each genotype over 3 independent experiments. Data are presented as mean values ± standard deviation (SD). d Schematics of the restricted feeding regimes used as related to the ad libitum paradigm that was used for the previous studies up until this point. Immunoblotting of ChP protein extracts for TTR showed that increased protein levels at 9 p.m. is dependent on feeding behavior. e Experimental setup for explant studies including PER2:LUC luminometry and TTR:mNeonGreen microscopy. f Representative PER2:LUC oscillations in isolated culture before and after addition of dexamethasone. g Average period length for PER2:LUC ChP oscillations in isolated culture before and after dexamethasone are close to 24 h. N = 3 ChP over 2 independent experiments. Data are presented as mean values ± SEM. h Genetic targeting used to generate TtrmNeonGreen mouse showing appropriate distribution of mNeonGreen to ChP epitheial cells. Scale bar = 100 μm; inset scale bar = 50 μm. i Explant preparation from TtrmNeonGreen ChP (scale bar = 100 μm; inset scale bar = 100 μm) shows j rhythmic oscillations of mNeonGreen across the day ex vivo. N = 2 LV ChP over 2 independent experiments. Data are presented as mean values normalized to the final value and shaded area represents range. k Immunoblotting of TTR in LV ChP across a whole day at 3-h intervals shows sharp upregulation of TTR in ChP during the dark phase. *p = 0.034 corrected for 8 comparisons with Šídák’s multiple comparisons test. Solid line represents average (normalized to vinculin and TTR average value) and shaded area represents standard deviation (SD). N = 3 biologically independent animals at each time across 3 independent experiments. l Immunoblotting of constant volumes of CSF shows sharp upregulation of TTR in CSF at 10 p.m. and 11 p.m. relative to transferrin (Tf). *p < 0.05 (p = 0.0437), *p < 0.01 (p = 0.00315); Student’s two-tailed unpaired t test. N = 3 biologically independent animals at each time across 2 independent experiments. Data are presented as mean values ± standard deviation (SD). m CSF concentration of active thyroid hormone T3 (triiodothyronine) and the circulating form T4 (thyroxine) at 5 p.m. (orange) and 11 p.m. (blue). *p < 0.05 (p = 0.0369), Student’s two-tailed unpaired t test. N = 7 biologically independent animals at each time in one experiment. Data are presented as mean values ± standard deviation (SD). Male mice were analyzed. Source data are provided as a Source Data file (Source Data).
Fig. 4
Fig. 4. CSF TTR is dynamic across the day.
a Schematic of the freely-moving photometry setup, consisting of a 470 nm LED light source, CMOS camera for signal collection, and patch cord to the animal. Inset shows the geometry of the optical fiber in the cannula relative to the ventricular system of the mouse. b Overview of all summarized photometry recordings, with each bar indicating the start (on the left) and stop times (three animals recorded simultaneously in each recording). The first 8 h (light-dark transition) of both the light–dark and dark-dark recordings were combined for analyses and subsequently treated separately for the later periods when the light patterns were distinct. Two TtrmNeonGreen and one wild-type animal were excluded from analysis for health reasons. c Summary of all TtrmNeonGreen and wild-type recordings in the first 8-h period around the first lights-off. N = 25 biologically independent TtrmNeonGreen animals across seven independent experiments and N = 5 biologically independent wild-type animals across two experiments. Data are presented as mean values ± standard error of the mean (SEM). d Peak responses, defined as the average signal over the 8:30 p.m.—9:30 p.m. interval, of all TtrmNeonGreen and wild-type recordings summarized in c. Horizontal lines are drawn at the minimal and maximal wild-type signals, and TtrmNeonGreen recordings are categorized based on these subdivisions into strong responders (top group, red), wild-type-like responders (middle group, peach), and dropping signals (bottom group, blue). e Heatmap showing each individual recording summarized in c, with subgroups color-coded as in d. Green tick marks on the heatmap indicate the times where each strongly responding trace reaches 20% of its peak signal (average between 8:30 p.m. and 9:30 p.m.). f Summary of the green tick marks in the heatmap in e, indicating that 20% peak response is reached a median of 66.9 min before lights-off. Box plots in d, f show median value at the red central bar, with the bottom and top edges of the box indicating the 25th and 75th percentiles, respectively. The whiskers extend to the most extreme values not considered outliers, and outliers (more than 1.5 times the interquartile range away from median) are plotted individually and marked with a red ‘+’ symbol. Male mice were analyzed. Source data are provided as a Source Data file (Source Data).
Fig. 5
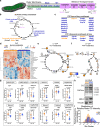
Fig. 5. ChP metabolic components and metabolites are diurnally regulated.
ac Schematics of the mitochondrial transport, the citric acid (TCA) cycle, and electron transport chain components. Those components that show altered enrichment on the ribosome at either 9 a.m. (orange) or 9 p.m. (blue). Listed components include those that are significantly associated with ribosomes at either 9 a.m. or 9 p.m. and those that are enriched on ribosomes vs. off ribosomes at either 9 a.m. or 9 p.m. d Heatmap of top 25 changed metabolites in 9 a.m. vs 9 p.m. ChP. e Metabolite log2 (ratio) for TCA intermediates in 9 a.m. and 9 p.m. LV ChP. N = 8 biologically independent animals at each time in one experiment. f Metabolite log2 (ratio) for pentose phosphate pathway (PPP) intermediates in 9 a.m. (orange) and 9 p.m. (blue) LV ChP. N = 8 biologically independent animals at each time in one experiment. g Values of common redox electron donor and recipient pairs followed by the log2 (reduced: oxidized ratio) showing increased oxidation at 9 p.m. (blue) in LV ChP. N = 8 biologically independent animals at each time in one experiment; Student’s two-tailed unpaired t test. Data are presented as mean values ± standard deviation (SD). h Immunoblotting for citrate synthase (CS), core components of the electron transport chain (OXPHOS; CV-Atp5a; CIII-Uqccrc2; CIV-Mtco1; CII-Sdhb; C1-Ndufb8), mitofusin2 (Mtfn2) showed enriched mitochondrial components during the 9 p.m. dark phase. i Quantification of citrate synthase (CS) intensity in immunohistochemistry of LV ChP epithelial cells showed a shift toward higher intensity expression of CS at 9 p.m. (blue) than at 9 a.m. (orange). ****p < 0.0001; Kolmogorov–Smirnov test, N = 5 biologically independent animals at each time across 2 independent experiments. Male mice were analyzed. Source data are provided as a Source Data file (Source Data).
Fig. 6
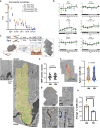
Fig. 6. ChP barrier components and permeability are diurnally regulated.
a TRAP candidates associated with barrier function. FPKM for each individual mouse is shown at 9 a.m. (orange circles) and 9 p.m. (blue squares) for those transcripts associated with RPL10A (solid) and those in the supernatant (open). N = 3 biologically independent samples (LV ChP pooled from 3 animals per sample). Data are presented as mean values ± standard deviation (SD). b RT-qPCR analysis of the expression of barrier components Itgb8, Slca8, Chd3, Abcf3, Chmp1b, and Snx12 in LV ChP every 3 h. Itgb8, Slca8, Chd3, Abcf3, and Snx12 showed significant rhythmicity by RAIN analysis. N = 4 biologically independent animals at each time across 2 independent experiments. c Experimental design for barrier permeability assay using intravenous (i.v) injection of horseradish peroxidase (HRP) followed by transmission electron microscopy. d Example of HRP-filled vesicles (green circles) taken up during the 7-min incubation period within the peri-junctional area (yellow shading). Vesicles outside of the quantified region are circled in brown. e Quantification of total number of HRP-filled vesicles in the peri-junctional area. Each point represents one junction, data combined from three animals at each timepoint. Welch’s two-tailed unpaired t test, N = 3 biologically independent animals per time in one experiment. f Example of the apical-basal distances calculated for HRP-filled vesicles in the peri-junctional area. Quantification of the (apical-basal)/apical ratio (0 = basal (blue); 1 = apical (red) for HRP-filled vesicles in the peri-junctional area at 9 a.m. (orange) and 9 p.m. (blue). Kolmogorov–Smirnov test, N = 3 biologically independent animals per time in one experiment. g Example of tight junctions at apico-lateral surface of ChP epithelial cells. Dotted box indicates junction area and bracket indicates width. Scale bars: top = 1 μm; bottom zoom = 500 nm. h Quantification of distances between each cell membrane within the tight junction. Each point is the average of 5 distances per junction for 10 junctions in a single animal. *p < 0.05; Welch’s two-tailed unpaired t test, N = 3 biologically independent animals per time in one experiment. Data are presented as mean values ± standard error of the mean (SEM). Male mice were analyzed. Source data are provided as a Source Data file (Source Data).

Similar articles

Cited by

References

    1. Fame RM, Lehtinen MK. Emergence and developmental roles of the cerebrospinal fluid system. Dev. Cell. 2020;52:261–275. doi: 10.1016/j.devcel.2020.01.027. - DOI - PubMed
    1. Nilsson C, et al. Circadian variation in human cerebrospinal fluid production measured by magnetic resonance imaging. Am. J. Physiol. 1992;262:R20–R24. - PubMed
    1. Boespflug EL, Iliff JJ. The emerging relationship between interstitial fluid-cerebrospinal fluid exchange, amyloid-beta, and sleep. Biol. Psychiatry. 2018;83:328–336. doi: 10.1016/j.biopsych.2017.11.031. - DOI - PMC - PubMed
    1. Xie L, et al. Sleep drives metabolite clearance from the adult brain. Science. 2013;342:373–377. doi: 10.1126/science.1241224. - DOI - PMC - PubMed
    1. Hablitz LM, et al. Circadian control of brain glymphatic and lymphatic fluid flow. Nat. Commun. 2020;11:4411–4411. doi: 10.1038/s41467-020-18115-2. - DOI - PMC - PubMed

Publication types