

Investigation of Brain Iron in Niemann-Pick Type C: A 7T Quantitative Susceptibility Mapping Study
- PMID: 37348967
- PMCID: PMC10337610
- DOI: 10.3174/ajnr.A7894
Investigation of Brain Iron in Niemann-Pick Type C: A 7T Quantitative Susceptibility Mapping Study
Abstract
Background and purpose: While brain iron dysregulation has been observed in several neurodegenerative disorders, its association with the progressive neurodegeneration in Niemann-Pick type C is unknown. Systemic iron abnormalities have been reported in patients with Niemann-Pick type C and in animal models of Niemann-Pick type C. In this study, we examined brain iron using quantitative susceptibility mapping MR imaging in individuals with Niemann-Pick type C compared with healthy controls.
Materials and methods: A cohort of 10 patients with adolescent- and adult-onset Niemann-Pick type C and 14 age- and sex-matched healthy controls underwent 7T brain MR imaging with T1 and quantitative susceptibility mapping acquisitions. A probing whole-brain voxelwise comparison of quantitative susceptibility mapping between groups was conducted. Mean quantitative susceptibility mapping in the ROIs (thalamus, hippocampus, putamen, caudate nucleus, and globus pallidus) was further compared. The correlations between regional volume, quantitative susceptibility mapping values, and clinical features, which included disease severity on the Iturriaga scale, cognitive function, and the Social and Occupational Functioning Assessment Scale, were explored as secondary analyses.
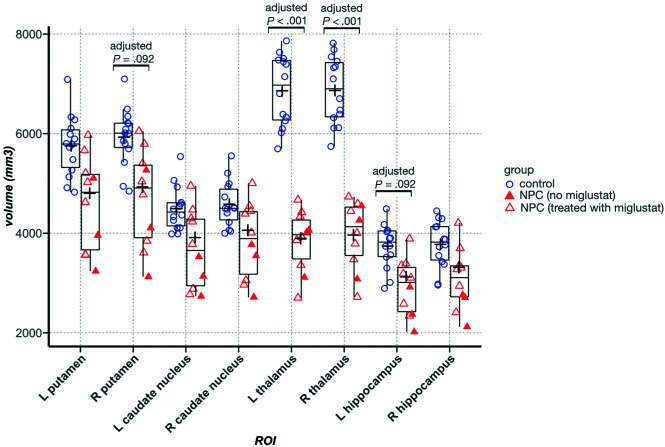
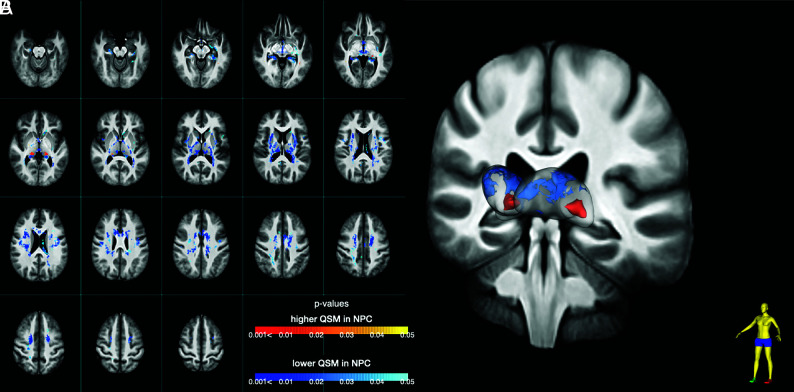
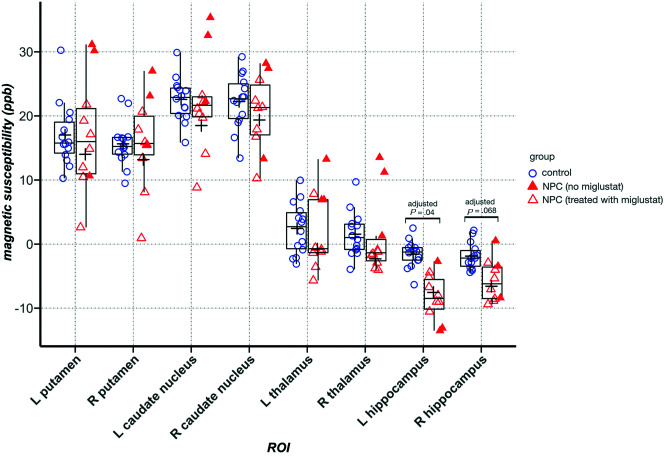
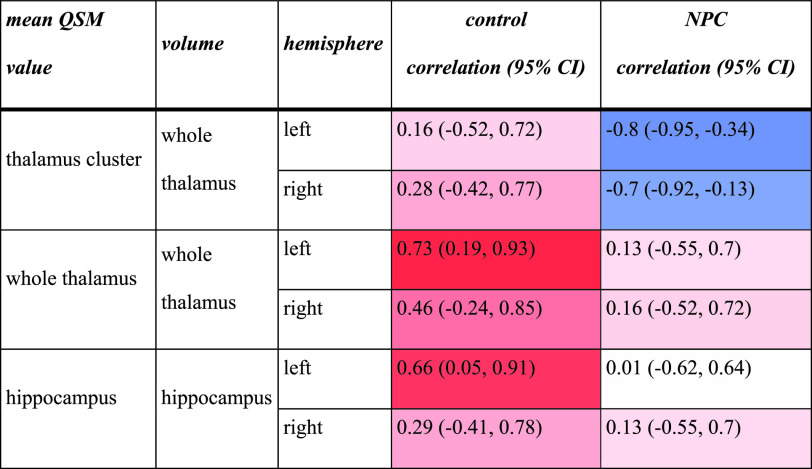
Results: We observed lower volume in the thalamus and voxel clusters of higher quantitative susceptibility mapping in the pulvinar nuclei bilaterally in patients with Niemann-Pick type C compared with the control group. In patients with Niemann-Pick type C, higher quantitative susceptibility mapping in the pulvinar nucleus clusters correlated with lower volume of the thalamus on both sides. Moreover, higher quantitative susceptibility mapping in the right pulvinar cluster was associated with greater disease severity.
Conclusions: Our findings suggest iron deposition in the pulvinar nucleus in Niemann-Pick type C disease, which is associated with thalamic atrophy and disease severity. This preliminary evidence supports the link between iron and neurodegeneration in Niemann-Pick type C, in line with existing literature on other neurodegenerative disorders.
© 2023 by American Journal of Neuroradiology.
Figures
Similar articles
-
Longitudinal changes in cerebellar and subcortical volumes in adult-onset Niemann-Pick disease type C patients treated with miglustat.J Neurol. 2015 Sep;262(9):2106-14. doi: 10.1007/s00415-015-7819-z. Epub 2015 Jun 20. J Neurol. 2015. PMID: 26092521
-
Comparison between Dual-Energy CT and Quantitative Susceptibility Mapping in Assessing Brain Iron Deposition in Parkinson Disease.AJNR Am J Neuroradiol. 2023 Apr;44(4):410-416. doi: 10.3174/ajnr.A7822. Epub 2023 Mar 23. AJNR Am J Neuroradiol. 2023. PMID: 36958800 Free PMC article.
-
Subcortical volumetric reductions in adult Niemann-Pick disease type C: a cross-sectional study.AJNR Am J Neuroradiol. 2013 Jul;34(7):1334-40. doi: 10.3174/ajnr.A3356. Epub 2012 Dec 13. AJNR Am J Neuroradiol. 2013. PMID: 23237858 Free PMC article.
-
The Possible Associations between Tauopathies and Atherosclerosis, Diabetes Mellitus, Dyslipidemias, Metabolic Syndrome and Niemann-Pick Disease.Diagnostics (Basel). 2024 Aug 22;14(16):1831. doi: 10.3390/diagnostics14161831. Diagnostics (Basel). 2024. PMID: 39202319 Free PMC article. Review.
-
Impact of Alcohol Abuse on Susceptibility to Rare Neurodegenerative Diseases.Front Mol Biosci. 2021 Jun 9;8:643273. doi: 10.3389/fmolb.2021.643273. eCollection 2021. Front Mol Biosci. 2021. PMID: 34179073 Free PMC article. Review.
Cited by
-
Examining the Role of a Functional Deficiency of Iron in Lysosomal Storage Disorders with Translational Relevance to Alzheimer's Disease.Cells. 2023 Nov 16;12(22):2641. doi: 10.3390/cells12222641. Cells. 2023. PMID: 37998376 Free PMC article. Review.
References
Publication types
MeSH terms
Substances
Grants and funding
LinkOut - more resources
Full Text Sources
Medical