. 2023 Jul 20;83(14):2417-2433.e7.
doi: 10.1016/j.molcel.2023.05.035. Epub 2023 Jun 21.

Genotoxic aldehyde stress prematurely ages hematopoietic stem cells in a p53-driven manner

Affiliations

Genotoxic aldehyde stress prematurely ages hematopoietic stem cells in a p53-driven manner

Meng Wang et al. Mol Cell. .

Abstract

Aged hematopoietic stem cells (HSCs) display diminished self-renewal and a myeloid differentiation bias. However, the drivers and mechanisms that underpin this fundamental switch are not understood. HSCs produce genotoxic formaldehyde that requires protection by the detoxification enzymes ALDH2 and ADH5 and the Fanconi anemia (FA) DNA repair pathway. We find that the HSCs in young Aldh2-/-Fancd2-/- mice harbor a transcriptomic signature equivalent to aged wild-type HSCs, along with increased epigenetic age, telomere attrition, and myeloid-biased differentiation quantified by single HSC transplantation. In addition, the p53 response is vigorously activated in Aldh2-/-Fancd2-/- HSCs, while p53 deletion rescued this aged HSC phenotype. To further define the origins of the myeloid differentiation bias, we use a GFP genetic reporter to find a striking enrichment of Vwf+ myeloid and megakaryocyte-lineage-biased HSCs. These results indicate that metabolism-derived formaldehyde-DNA damage stimulates the p53 response in HSCs to drive accelerated aging.

Keywords: DNA damage; DNA-damage response; aging; aldehydes; hematopoiesis; myeloid bias; p53.


Conflict of interest statement

Declaration of interests The authors declare no competing interests.

Figures
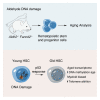
Graphic abstract
Graphic abstract
Figure 1
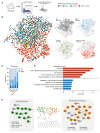
Figure 1. Single-cell transcriptomes of Aldh2−/− Fancd2−/− stem and progenitor cells
(A) scRNA-seq of LKS cells from 8- to 12-week-old Aldh2−/− Fancd2−/− mice with age matched WT, Aldh2−/−, and Fancd2−/− controls. See also Figure S1. (B) Uniform manifold approximation and projection (UMAP) visualization of LKS transcriptomes colored by genotype with UMAP of all 4 genotypes superimposed on the left, and individual genotypes on the right. (C) Proportion of LKS cells in different cell-cycle phases as determined by transcriptome profile. (D) GO terms ranked by gene enrichment from top 100 upregulated (red) and downregulated genes (blue) in LKS from Aldh2−/− Fancd2−/− compared with WT (FDR < 0.01, redundant GO terms omitted). See also Tables S1 and S2. (E) String network of top 100 upregulated genes described in (D). visualized in cytoscape V3.9.0, with gene nodes highlighted from the respective GO and Kyoto Encyclopedia of Genes and Genomes (KEGG) terms.
Figure 2
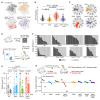
Figure 2. Aldh2−/− Fancd2−/− HSPCs exhibit increased aging
(A and B) Aging score analysis of LKS transcriptomes identified as LT-HSCs in (A). 16- and 68-week-old WT mice, and an 88-week-old Fancd2+/− mouse (n = 234, 187, and 758 left to right), (B) 8- to 12-week-old Aldh2−/− Fancd2−/− and control mice (n = 162, 27, 14, and 23 left to right). (C) Expression of aging-associated genes in LT-HSCs. FDR represents comparison between Aldh2−/− Fancd2−/− and WT. (D and E) SELP expression in SLAM HSCs (Lin Kit+ Sca-1+ CD48 CD150+) shown in representative flow cytometry (D) and bar plot quantification (mean ± SEM; n = 7, 4, 5, and 4, left to right) (E). (F) DNA methylation age of bone marrow cells from 10-week-old mice (mean ± SEM; n = 5, 3, 3, and 4, left to right). (G) Aging score analysis of LT-HSC scRNA-seq transcriptomes from 6-week-old Aldh2−/− Adh5−/− and control mice (n = 172, 166, 184, and 77 left to right).
Figure 3
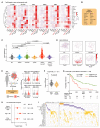
Figure 3. Aldehyde-sensitive murine and human FA HSPCs exhibit myeloid bias
(A-C) LKS cell types identified based on transcriptome identity shown by (A). UMAP distribution, (B) polar plot, and (C) bar plot showing each cell type as a proportion of total LKS cells. See also Figures S2 and S3. (D and E) UMAP visualization and bar plot quantification of each cell type as a proportion of total HSPCs based on transcriptome identity in Aldh2−/− Adh5−/− and control mice (D), and healthy humans and FA patients (E).
Figure 4
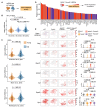
Figure 4. p53 drives HSC aging and myeloid bias in Aldh2−/− Fancd2−/− mice
(A) UMAP of LKS transcriptomes from Trp53−/− and Aldh2−/− Fancd2−/− Trp53−/− compared with WT and Aldh2−/− Fancd2−/−. (B) Aging score of LT-HSC transcriptomes (n = 162, 71, 23, and 33, left to right), see also Figure S4A. (C) Polar plots showing the LKS cell lineage distribution, see also Figure S4B. (D) Scheme of single LT-HSC transplantation and analysis of myeloid or lymphoid progeny. (E) Myeloid chimerism defined as the proportion of myeloid progeny of singly transplanted HSCs (mean ± SEM; n = 15, 14, 14, 14, 19, 14, 15, and 10, left to right). (F) Lineage distribution showing the proportion of myeloid and lymphoid output from singly transplanted HSCs. Each column represents the output from a single HSC, see also Figures S4C and S4D. (G) Telomere length estimation derived from WGS of progenies of singly transplanted LT-HSCs and paired tail samples from the LT-HSC donor mouse. HSC telomere difference calculated by subtracting LT-HSC by the paired tail telomere length. Each point represents telomere difference of a singly transplanted LT-HSC.
Figure 5
Figure 5. Haem p53Score to quantify p53 activation in normal and malignant hematopoiesis
(A) Expression heatmap of p53 target genes upregulated in multiple HSPC populations of Aldh2−/− Fancd2−/− compared with WT, and Aldh2−/− Fancd2−/− Trp53−/− mice. See also Figure S5A. (B) Haem p53Score quantifies Trp53 activity in HSPCs based on the expression of 16 p53 target genes. (C and D) Haem p53Scores in LKS transcriptomes of each genotype quantified in violin plot (C) (median, n = 898, 189, 191, 453, 444, and 379, left to right), and visualized on UMAP (D). See also Figure S5B. (E) Interrogating human AML scRNA-seq dataset using the Haem p53Score reveals two patients (AML556 and AML210A) with elevated Haem p53Score in AML cells compared with normal cells, and two patients (AML916 and AML707B) with Haem p53Score in AML cells comparable to normal cells. AML916 harbors the TP53 variant C238Y. (F) Haem p53Score analysis AMLs with WT and mutated TP53 from the TCGA-AML database. (G) Kaplan Meier (KM) analysis showing probability of survival of TP53 wild-type AML cases stratified by high (top 25%) or low (bottom 75%) p53Score (n = 138 TP53 WT AMLs), HR, hazard ratio of increased risk of death in p53Score high AMLs. (H) Multivariate Cox regression analysis of high Haem p53Score, aged >60 and prior treatment as independent predictors of increased mortality. See also Figure S6 and Table S4. (I) The spectrum of driver mutations found in AMLs with high and low Haem p53Score. TP53 mutation highlighted in orange, class II mutations that inhibit AML differentiation highlighted in purple, other driver mutations highlighted in yellow. See also Table S5.
Figure 6
Figure 6. p53 activation in HSPCs correlates with myeloid priming
(A and B) Comparison of Haem p53Score in scRNA-seq-derived transcriptomes of LT-HSCs from 16-, 68-week-old WT mice, and an 88-week-old Fancd2+–/– mouse (n = 234, 187, and 758 left to right), see also Figure S7. (C) Haem p53Score in young and old HSC from three published scRNA-seq datasets.,, (D) Rank of genes by Pearson correlation between gene expression and Haem p53Score in Aldh2−/− Fancd2−/− LKS cells. Red highlights known p53 gene targets, purple highlights genes not known to be direct p53 targets. See Table S6 for list of genes with Pearson coefficient >1. (E) UMAP and violin plots of LKS cells from WT, Trp53−/−, Aldh2−/− Fancd2−/−, and Aldh2−/− Fancd2−/− Trp53−/− mice, showing the distribution and scale of Haem p53Score, and respective gene expression that correlate with Haem p53Score. Gapdh and Hprt are included to show expression of housekeeping genes.
Figure 7
Figure 7. Aldh2−/− Fancd2−/− mice harbor increased Vwf+ LT-HSCs
(A) Vwf expression in LT-HSC subset of LKS cells analyzed by scRNA-seq. (B) The Vwf-GFP reporter transgene fluorescently labels LT-HSCs that express Vwf and was introduced into Aldh2−/− Fancd2−/− mice and respective controls. (Cand D) GFP+SLAM HSCs from WT and Aldh2−/− Fancd2−/− mice shown by representative flow cytometry plots (C), and bar plot (mean ± SEM; n = 7, 3, 4, and 6, left to right) (D). (E and F) CD229low/– SLAM HSCs from WT and Aldh2−/− Fancd2−/− mice shown by representative flow cytometry plots (E), and bar plot (mean ± SEM; n = 10, 13, 7, and 8, left to right) (F). (G) Ex vivo cultures of Vwf+ and Vwf– SLAM HSCs to assess formaldehyde sensitivity, defined by the number of surviving cells in formaldehyde-supplemented media as a proportion of total cells in untreated media. Each point represents a single mouse with isolated HSCs cultured in technical triplicates. (H) Endogenous DNA damage triggers p53-dependent response in HSCs leading to aging and myeloid bias.

Similar articles

Cited by

References

    1. Pang WW, Price EA, Sahoo D, Beerman I, Maloney WJ, Rossi D, Schrier SL, Weissman I. Human bone marrow hematopoietic stem cells are increased in frequency and myeloid-biased with age. Proc Natl Acad Sci USA. 2011;108:20012–20017. doi: 10.1073/pnas.1116110108. - DOI - PMC - PubMed
    1. Dykstra B, Olthof S, Schreuder J, Ritsema M, de Haan G. Clonal analysis reveals multiple functional defects of aged murine hematopoietic stem cells. J Exp Med. 2011;208:2691–2703. doi: 10.1084/jem.20111490. - DOI - PMC - PubMed
    1. Sudo K, Ema H, Morita Y, Nakauchi H. Age-associated characteristics of murine hematopoietic stem cells. J Exp Med. 2000;192:1273–1280. - PMC - PubMed
    1. Kuranda K, Vargaftig J, de la Rochere P, Dosquet C, Charron D, Bardin F, Tonnelle C, Bonnet D, Goodhardt M. Agerelated changes in human hematopoietic stem/progenitor cells. Aging Cell. 2011;10:542–546. doi: 10.1111/j.1474-9726.2011.00675.x. - DOI - PubMed
    1. Castle S. Clinical relevance of age-related immune dysfunction. Clin Infect Dis. 2000;31:578–585. doi: 10.1086/313947. - DOI - PubMed

Publication types