. 2023 Jul 6;186(14):3062-3078.e20.
doi: 10.1016/j.cell.2023.05.031. Epub 2023 Jun 20.

Hindbrain modules differentially transform activity of single collicular neurons to coordinate movements

Affiliations

Hindbrain modules differentially transform activity of single collicular neurons to coordinate movements

Sebastian H Zahler et al. Cell. .

Abstract

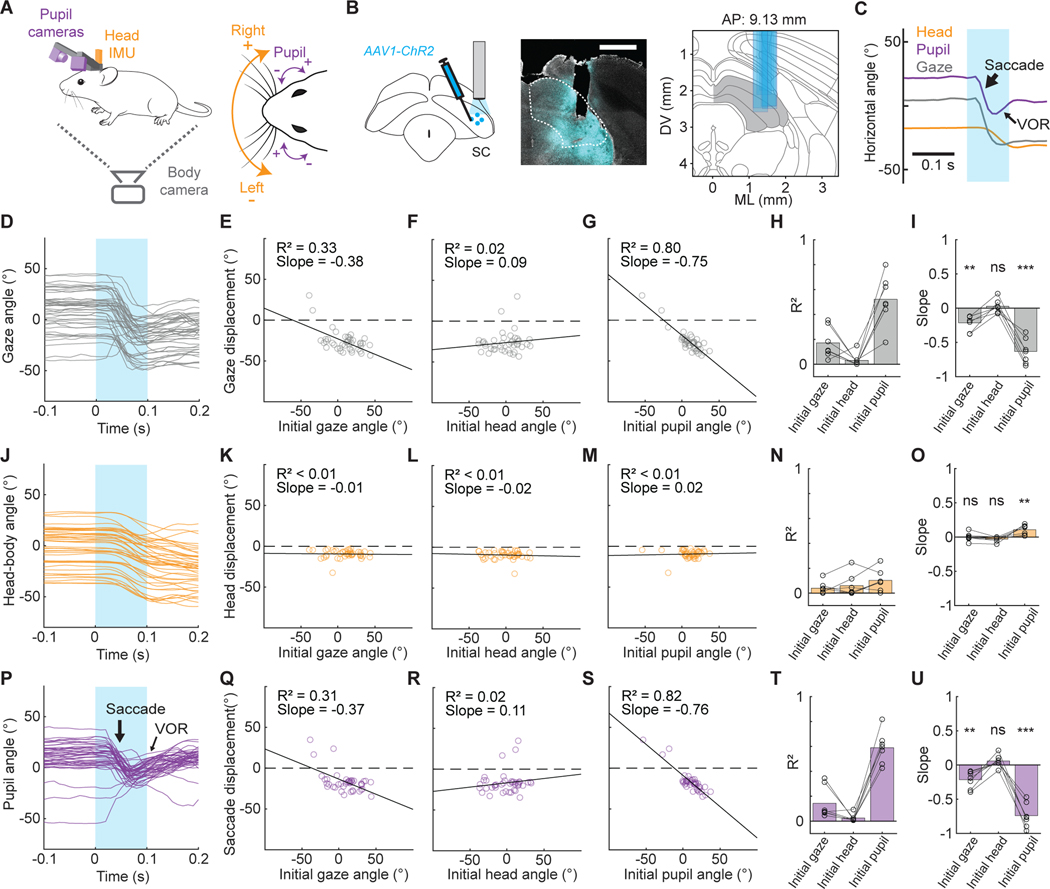
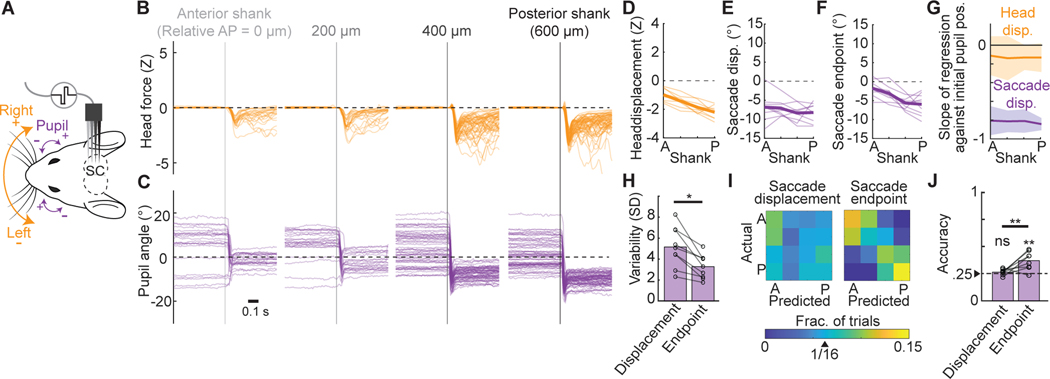
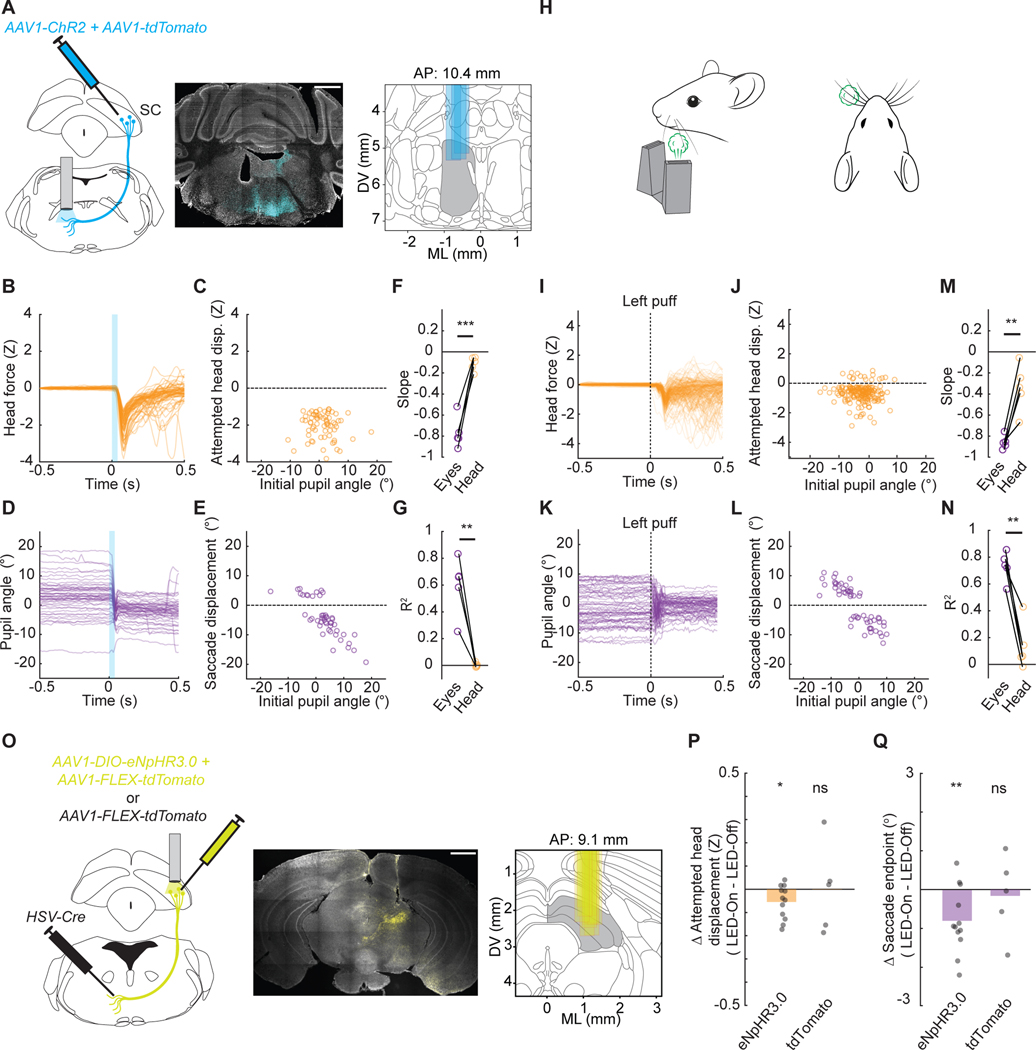
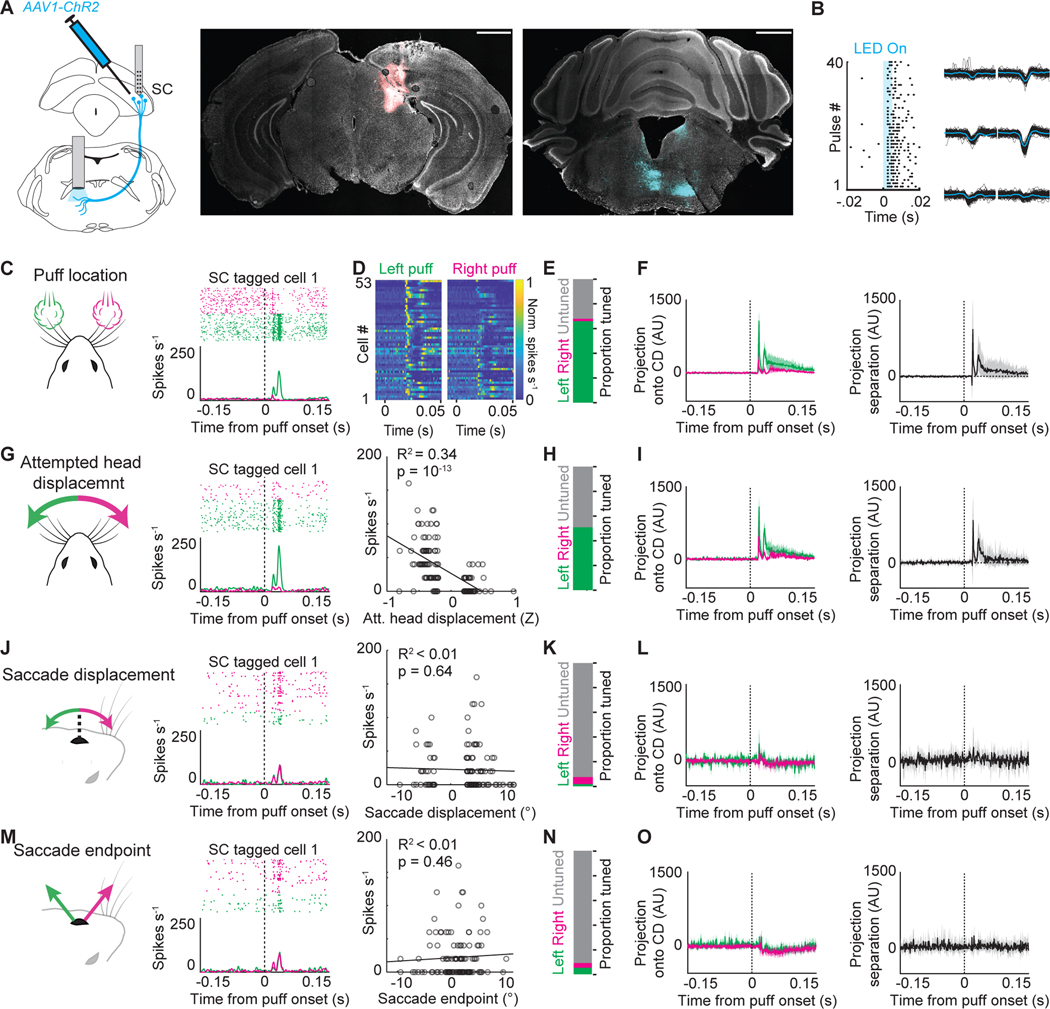
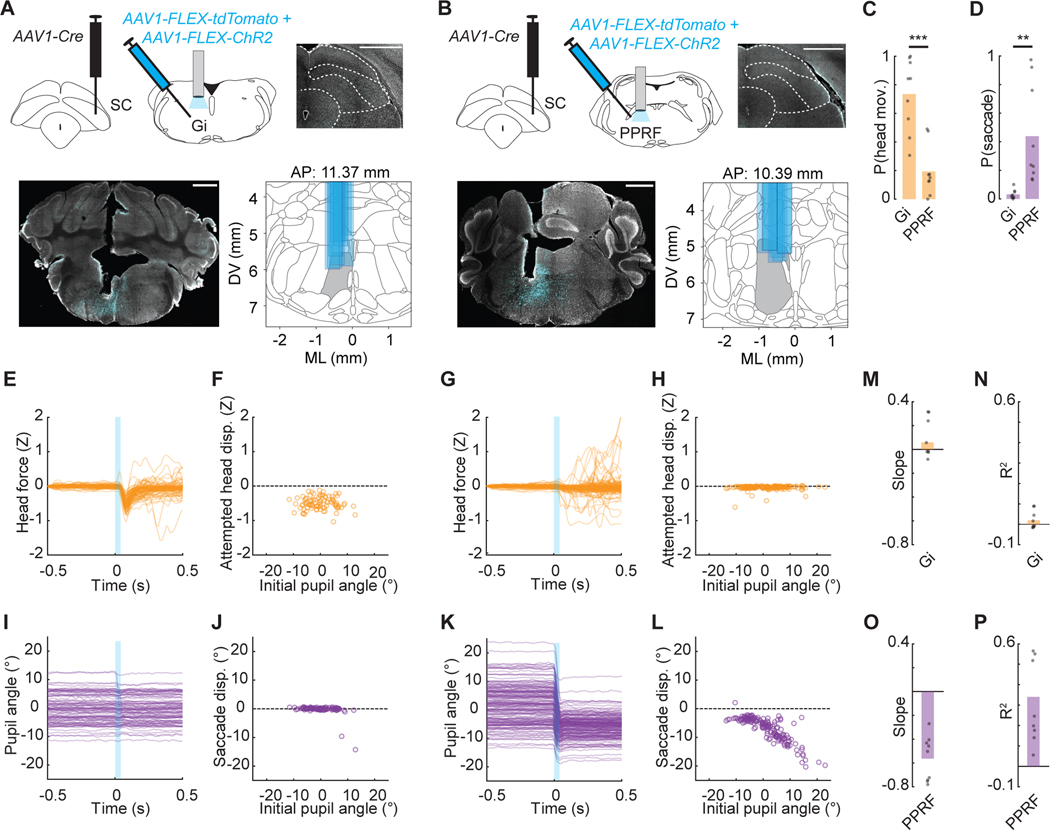
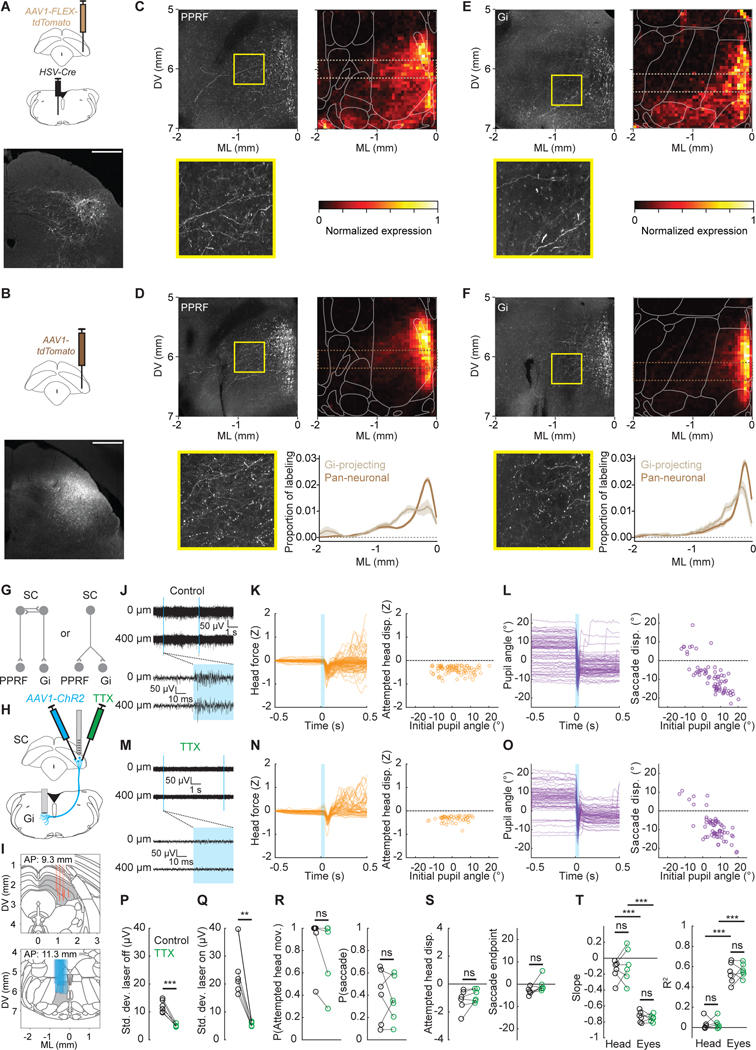
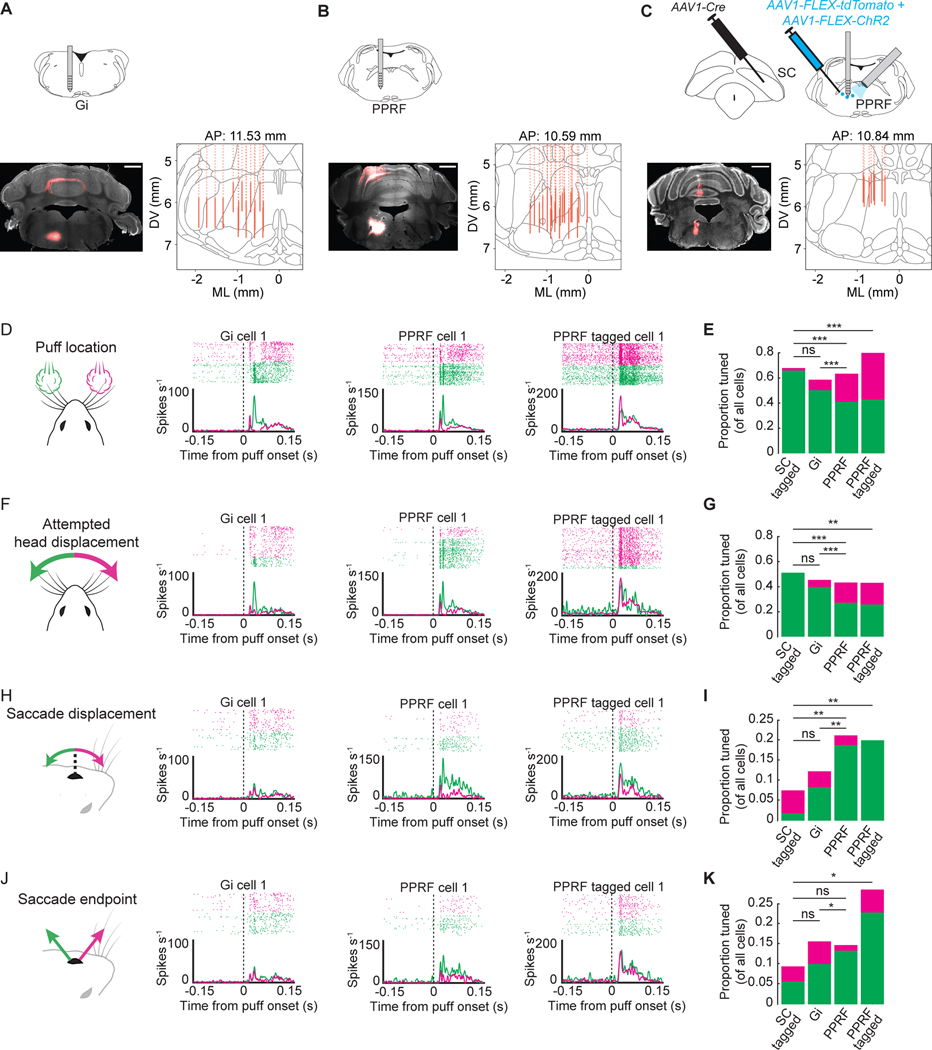
Seemingly simple behaviors such as swatting a mosquito or glancing at a signpost involve the precise coordination of multiple body parts. Neural control of coordinated movements is widely thought to entail transforming a desired overall displacement into displacements for each body part. Here we reveal a different logic implemented in the mouse gaze system. Stimulating superior colliculus (SC) elicits head movements with stereotyped displacements but eye movements with stereotyped endpoints. This is achieved by individual SC neurons whose branched axons innervate modules in medulla and pons that drive head movements with stereotyped displacements and eye movements with stereotyped endpoints, respectively. Thus, single neurons specify a mixture of endpoints and displacements for different body parts, not overall displacement, with displacements for different body parts computed at distinct anatomical stages. Our study establishes an approach for unraveling motor hierarchies and identifies a logic for coordinating movements and the resulting pose.

Keywords: ethology; gaze; hindbrain; motor control; movement coordination; orienting; saccades; signal multiplexing; superior colliculus; systems neuroscience; upper motor neurons.


Conflict of interest statement

Declaration of interests The authors declare no competing interests.

Figures

Figure 1.
Figure 1.. Superior colliculus specifies head displacement and saccade endpoint but not overall gaze displacement in freely moving mice.
A, Left, schematic. Head-mounted cameras and inertial measurement unit track eyes and head, respectively. Initial head-eye angle is tracked using camera below transparent platform. Right, sign conventions adopted throughout this paper. B, Optogenetic strategy. Left, schematic. Center, sample histology. Scale bar, 1 mm. Right, fiber placements for all mice (n = 7) in Allen common coordinate framework (CCF). C, Example head, pupil, and gaze traces illustrating stimulation-evoked gaze shift. Blue bar indicates LED stimulation period. Note two distinct phases of eye motion: a fast saccadic phase coinciding with head movement onset followed by a slow phase with roughly equal and opposite to the head rotation, resembling a gaze-stabilizing reflex (vestibular ocular reflex, VOR). D-G, J-M, P-S, Data for example mouse. D, Gaze traces aligned to LED onset. E-G, Relationship between gaze displacement and initial gaze angle (E), initial head angle (F), and initial pupil angle (G). H, I Population summary of R2 and slopes for ChR2-evoked gaze displacement regressed against initial gaze, head, or pupil angles. J, Head movement traces aligned to LED onset. K-M, Relationship between head displacement and initial gaze angle (K), initial head angle (L), and initial pupil angle (M) N, O, Population summary of R2 (N) and slope (O) for optogenetically evoked head displacement regressed against initial gaze, head, or pupil angles. P, Pupil traces aligned to LED onset. Q-S, Relationship between pupil displacement and initial gaze angle (Q), initial head angle (R), and initial pupil angle (S). T, U, Population summary of R2 (T) and slope (U) for optogenetically evoked pupil displacement regressed against initial gaze, head, or pupil angles. See also Figure S1.
Figure 2.
Figure 2.. Mouse superior colliculus comprises topographic maps of head displacement and saccade endpoint.
A, Schematic of electrical microstimulation. B, C, Attempted head movement (B) and pupil angle (C) traces aligned to stimulation onset (gray shading) for each electrode for an example animal. D-F, Population summary of attempted head displacements (D), saccade displacements (E), and saccade endpoints (F) as a function of microstimulation site. Thin lines are data from individual animals (n = 9). Thick line is population mean. G, Fraction of saccade displacement or attempted head displacement variance (R2, linear regression) explained by initial pupil position across animals (mean ± SD). H, Variability of saccade displacements and endpoints. Each point is the mean shank-wise variance. Lines denote individual mice, bars denote population means. I, Confusion matrices of predicted versus actual microstimulation shank for example animal. The matrix cell values indicate the fraction of trials with that result. Chance level indicated with triangle. A, anterior. P, posterior. J, Summary of classifier accuracies predicting microstimulation shank using saccade displacement or endpoint. Chance level indicated with triangle and dashed line. Confusion matrix and accuracy scores are from test folds of cross-validated multinomial logistic regressions. Lines connect values for individual mice, bars are population means. Orange denotes head data and purple denotes eye data. Statistics performed using one- or two-sample Student’s t-test (*p < 0.05; **p < 0.01; ***p < 0.001; ns, not significant). See also Figure S2.
Figure 3.
Figure 3.. Tectoreticular neurons drive sensory-guided eye and head movements with stereotyped endpoints and displacements, respectively.
A, Left, schematic. Middle, sample histology. Scale bar, 1 mm. Right, fiber placements in Allen CCF (n = 5 mice). B, Attempted head movement traces aligned to LED onset (blue shading) for an example animal. C, Relationship between initial pupil angle and attempted head displacement for traces in B. D, Pupil angle traces aligned to LED onset (blue shading). E, Relationship between initial pupil angle and saccade displacement for traces in D. Data in B-D were derived from the same animal. F, G Population summary of slopes and R2 of head displacements and saccade displacements regressed against initial pupil angle. Markers denote individual animals. H, Schematics illustrating airpuff stimulation of the left whisker bundle. I, Attempted head movement traces aligned to left whisker airpuff onset (vertical dashed line) for an example animal. J, Relationship between initial pupil angle and attempted head displacement for traces in I. K, Pupil position traces aligned to whisker airpuff onset (vertical dashed line). L, Relationship between initial pupil angle and saccade displacement for traces in K. Data in I-L were derived from the same animal. M, N, Population summary of slopes (M) and R2 (N) for regression of airpuff-evoked head displacements and saccade displacements against initial pupil angle. Markers denote individual animals. O, Left, schematic illustrating strategy to optogenetically inhibit tectoreticular neurons (n = 12 mice). Tectoreticular activity was suppressed in the period surrounding whisker airpuff onset. A separate cohort was prepared to control for effects of optogenetic excitation (n = 5 mice). Middle, sample histology. Scale bar, 1 mm. Right, fiber placements in Allen CCF. P, Change in mean attempted head displacement between LED-On and LED-Off whisker airpuff trials. Q, As in P for saccade endpoint. Orange denotes head data and purple denotes eye data. Statistics performed using Student’s t-test (*p < 0.05; **p < 0.01; ***p < 0.001; ns, not significant).
Figure 4.
Figure 4.. Tectoreticular neurons encode stimulus location and head displacement.
A, Left, schematic of antidromic “optotagging” of tectoreticular neurons. Middle, Sample SC histology. Right, sample PMRF histology. Scale bar, 1 mm. B, Example cell. Left, raster plots of activity aligned to LED onset. Right, waveforms of spontaneously occurring (black) and light-evoked (blue) action potentials. C, Left, schematic of airpuff delivery to whiskers. Right, spike rasters and peri-stimulus time histogram of activity of example cell aligned to airpuff onset sorted by airpuff location. D, Peak-normalized average firing rate of each tectoreticular cell aligned to airpuff onset. E, Proportion of cells significantly tuned for left or right airpuffs. F, Left, trial-averaged population activity projected onto the coding dimension (CD) for left and right whisker airpuffs. Right, separation between the left and right whisker airpuff activity projections. G, Left, schematic of left and right attempted head displacements. Middle, spike raster and peri-stimulus time histogram of activity for example cell aligned to airpuff onset sorted by attempted head displacement direction. Right, single-trial analysis of the relationship between attempted head displacement and spiking in the 50 ms following airpuff onset for the same cell. H, Proportion of units significantly tuned for left and right head displacements. I, Left, trial-averaged population activity projected onto the coding dimension (CD) for left and right head displacements. Right, separation between the left and right head displacement activity projections. J, M, As in G for saccade displacements and saccade endpoints. K, N, As in H for saccade displacements and saccade endpoints. L, O, As in I for saccade displacements and saccade endpoints. Green and magenta denote left (contralateral to recording site) and right (ipsilateral to recording site) airpuff locations or movements. Left and right saccade endpoints were defined relative to the median eye position. Tuning for airpuffs was computed using Student’s t-test (p < 0.05). Tuning for movement parameters was determined using linear regression (p < 0.05). The same example cell is shown in each panel. Shading denotes 99% confidence interval. Recordings were performed in 4 mice over 9 sessions, yielding 317 units of which 53 were identified as tectoreticular. See also Figures S3 and S4.
Figure 5.
Figure 5.. SC-recipient Gi and PPRF modules drive head movements with stereotyped displacements and saccades with stereotyped endpoints, respectively.
A, Top left, schematic. Top right, sample SC histology. Bottom left, sample Gi histology. Bottom right, fiber placements in Allen CCF. Scale bars, 1 mm. B, As in A but for SC-recipient PPRF neurons. C, D, Population summary of Gi and PPRF optogenetically evoked head movement (C) and saccade probability (D). E, Attempted head movements aligned to LED onset (blue shading) for sample Gi mouse. F, Relationship between initial pupil angle and head displacement for traces in E. G, H, as in E, F for sample PPRF mouse. I, Pupil traces aligned to LED onset (blue shading) for sample Gi mouse. J, Relationship between initial pupil angle and saccade displacement for traces in I. K, L, As in I, J but for SC-recipient PPRF neurons. Data in E, F, I, J derived from the same Gi stimulation animal. Data from G, H, K, L derived from the same PPRF stimulation animal. M-O, Population summary of slopes (M, O) and R2 (N, P) for regression of Gi-evoked attempted head displacements (M, N) and PPRF-evoked saccade displacements (O, P) against initial pupil angle. Markers show individual animals (n = 9 for Gi, n = 9 for PPRF). Orange denotes head data and purple denotes eye data. Statistics performed using Student’s t-test (*p < 0.05; **p < 0.01; ***p < 0.001; ns, not significant).
Figure 6.
Figure 6.. Individual tectoreticular neurons collateralizing to Gi and PPRF drive both head and eye movements.
A, Top, schematic of strategy to label Gi-projecting SC neurons (n = 3). Bottom, representative SC histology. Scale bar, 0.5 mm. B, As in A but for pan-neuronal SC labeling (n = 4). C, Gi-projecting neurons collateralize to PPRF. Top left, labeling in PPRF in representative animal. Yellow rectangle indicates area magnified at lower left. Top right, mean terminal density across animals. D, As in C for SC pan-neuronal labeling. Bottom right shows population mean distributions of terminals in PPRF in area outlined by dotted lines in the mean terminal density images. E, F, As in C, D for terminals in Gi. G, Schematic of possible models. Left, model wherein separate SC neurons innervate PPRF and Gi to drive saccades and head movements, respectively. Right, model wherein single SC neurons collateralize to both PPRF and Gi to drive both head and eye movements. H, Schematic of approach. AAV1-ChR2 was injected in right SC and a fiber optic was implanted over left Gi. SC was subsequently injected with either saline or TTX and SC activity was recorded. I, Positions of electrodes (top) and optical fibers (bottom) in Allen CCF. J, SC multiunit activity at 2 depths separated by 400 μm after control (saline) injection. K, Attempted head movements aligned to LED onset (blue shading) (left) and relationship between initial pupil angle and head displacement (right). L, as in K for saccades. M, TTX injection abolishes activity in SC. N, O, as in K, L after TTX injection in SC. Data in J-L and M-O are from the same mouse on successive days. P, Mean standard deviation of multiunit signals detected in SC for control and TTX sessions. Markers indicate single mice. Q, As in P for antidromically evoked SC activity. R, Probability of attempted head movements (left) and saccades (right) for control and TTX sessions. S, Size of attempted head movements (left) and saccade endpoints (right) for control and TTX sessions. T, Slopes (left) and R2 (right) of regression of attempted head displacement and saccade displacement against initial eye position. Statistics performed using Student’s t-test (*p < 0.05; **p < 0.01; ***p < 0.001; ns, not significant).
Figure 7.
Figure 7.. Saccade tuning emerges in PPRF.
A, B, C, Top, schematics of extracellular recordings of Gi (A), PPRF (B), and optotagged SC-recipient PPRF neurons (C). Bottom left, sample histology of recording site. Bottom right, recording sites in Allen CCF. D, Responses to left and right airpuffs for example Gi (left), PPRF (middle), and optotagged SC-recipient PPRF (right) neurons. E, Population summaries of airpuff tuning in optotagged SC tectoreticular, Gi, PPRF, and optotagged SC-recipient PPRF neurons. F-K, as in D, E but for attempted head displacement (F, G), saccade displacement (H, I), and saccade endpoint (J, K). Each row shows a single example cell. Chi-squared tests were used to compare the proportions of left-, right-, and un-tuned units across structures (*p < 0.05; **p < 0.01; ***p < 0.001; ns, not significant). Gi recordings were performed in 4 mice over 6 sessions, yielding 179 cells. PPRF recordings were performed in 6 mice over 6 sessions, yielding 292 cells. Optotagged PPRF recordings were performed in 6 mice over 9 sessions, yielding 35 cells. SC recordings are from Figure 2. See also Figures S5, S6, and S7.

Similar articles

Cited by

References

    1. Kandel ER, Schwartz JH, Jessell TM, Siegelbaum SA & Hudspeth AJ. (2013) Principles of Neural Science, Fifth Editon | Neurology Collection | McGraw-Hill Medical. 2013.
    1. Miall RC & Wolpert DM. (1996) Forward models for physiological motor control. Neural Networks 9, 1265–1279. 10.1016/s0893-6080(96)00035-4. - DOI - PubMed
    1. Wolpert DM, Miall RC & Kawato M. (1998) Internal models in the cerebellum. Trends Cogn. Sci. 2, 338–347. 10.1016/s1364-6613(98)01221-2. - DOI - PubMed
    1. Kawato M. (1999) Internal models for motor control and trajectory planning. Curr. Opin. Neurobiol. 9, 718–727. 10.1016/s0959-4388(99)00028-8. - DOI - PubMed
    1. Graziano MSA, Taylor CSR & Moore T. (2002) Complex movements evoked by microstimulation of precentral cortex. Neuron 34, 841–851. 10.1016/s0896-6273(02)00698-0. - DOI - PubMed

Publication types