. 2023 Jun 20;13(1):9967.
doi: 10.1038/s41598-023-36354-3.

TGFβ inhibition and mesenchymal to epithelial transition initiation by Xenopus egg extract: first steps towards early reprogramming in fish somatic cell

Affiliations

TGFβ inhibition and mesenchymal to epithelial transition initiation by Xenopus egg extract: first steps towards early reprogramming in fish somatic cell

Nathalie Chênais et al. Sci Rep. .

Abstract

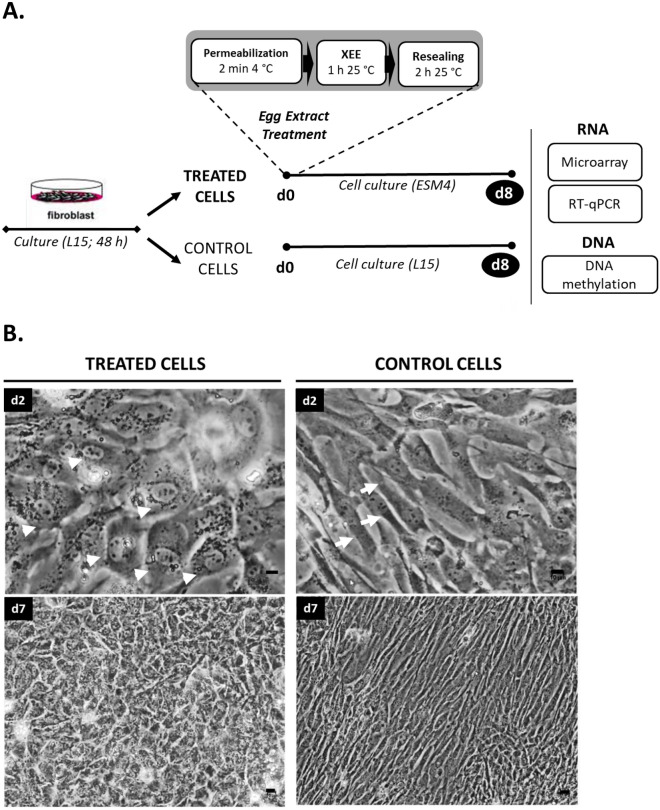
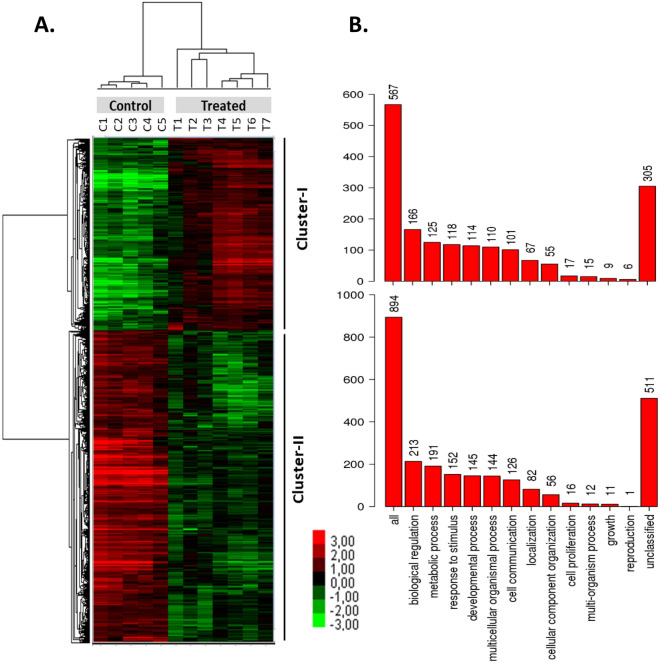
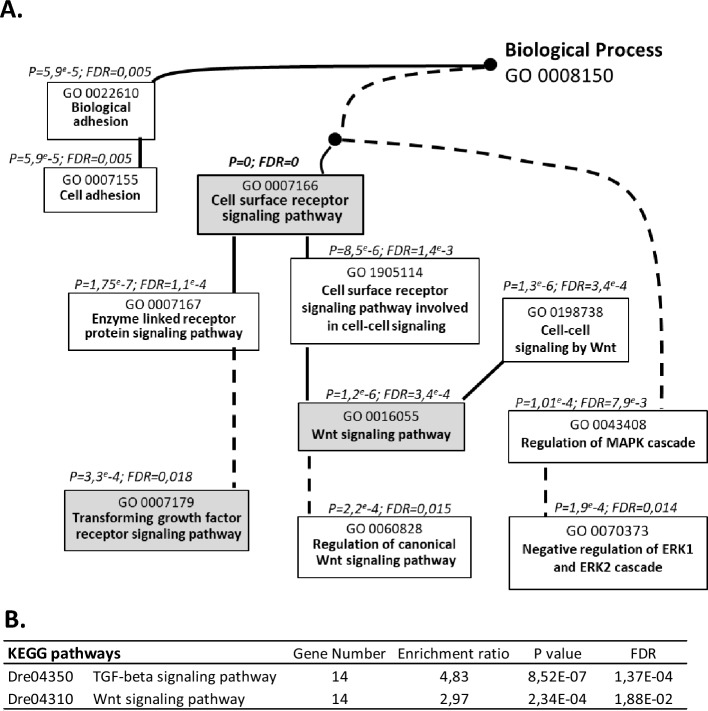
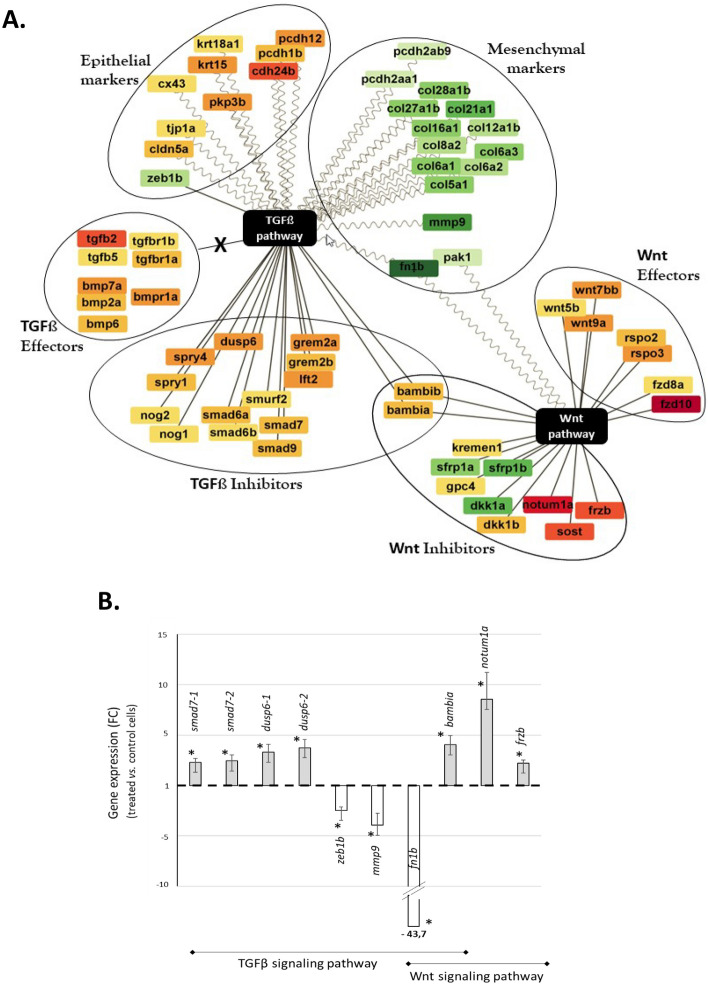
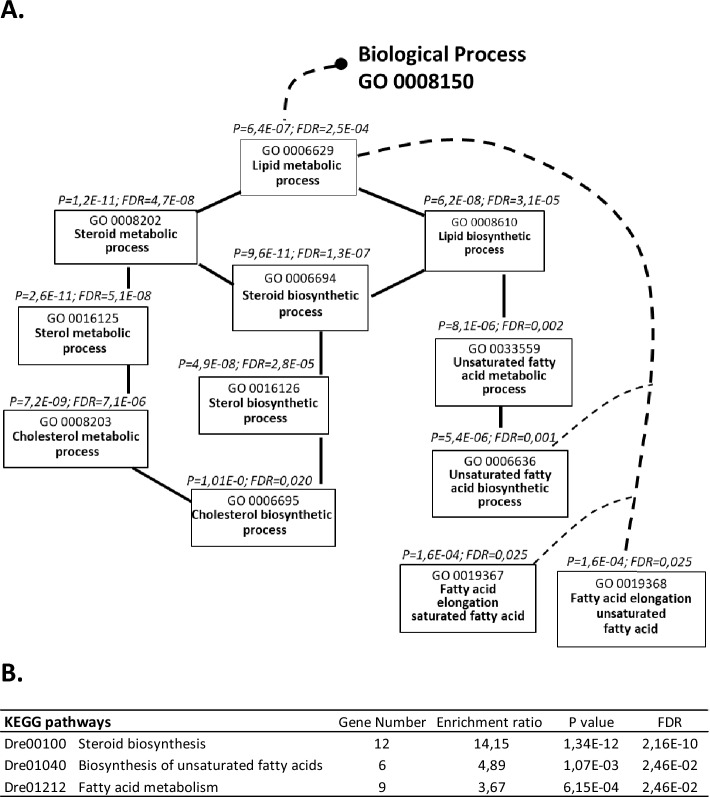
Xenopus egg extract is a powerful material to modify cultured cells fate and to induce cellular reprogramming in mammals. In this study, the response of goldfish fin cells to in vitro exposure to Xenopus egg extract, and subsequent culture, was studied using a cDNA microarray approach, gene ontology and KEGG pathways analyses, and qPCR validation. We observed that several actors of the TGFβ and Wnt/β-catenin signaling pathways, as well as some mesenchymal markers, were inhibited in treated cells, while several epithelial markers were upregulated. This was associated with morphological changes of the cells in culture, suggesting that egg extract drove cultured fin cells towards a mesenchymal-epithelial transition. This indicates that Xenopus egg extract treatment relieved some barriers of somatic reprogramming in fish cells. However, the lack of re-expression of pou2 and nanog pluripotency markers, the absence of DNA methylation remodeling of their promoter region, and the strong decrease in de novo lipid biosynthesis metabolism, indicate that reprogramming was only partial. The observed changes may render these treated cells more suitable for studies on in vivo reprogramming after somatic cell nuclear transfer.


Conflict of interest statement

The authors declare no competing interests.

Figures

Figure 1
Figure 1
Fish somatic cell treatment with Xenopus laevis egg extracts. (A) : Summary of the treatment and culture steps. Cell treatment included (i) plasma membrane permeabilization with 30 µg/ mL digitonin, (ii) exposure of the permeabilized cells to egg extracts (XEE) and, (iii) plasma membrane resealing in medium with 2 mM calcium. Treated cells were cultured in ESM4 medium. Control cells originating from the same batches were cultured in L15 medium. (B) : Pictures of the treated and control cells over culture time. White arrowheads show treated cells with a cubic shape morphology 2 days after the treatment (d2), contrasting with the elongated (white arrows) control cells. This difference in morphology between treated and control cells was still observed at confluence, 7 days after the treatment (d7). Pictures are representative of three experiments with different cells and egg extract batches. Scale bar = 10 µm.
Figure 2
Figure 2
Clustering and gene ontology of the differentially expressed genes after egg extract treatment. (A) Heatmap of the hierarchical clustering analysis by unsupervised approach using 52,362 goldfish genes (Java TreeView software; https://bitbucket.org/TreeView3Dev/treeview3/src/master/). Control: control cultured cells (C1-5); Treated: treated cultured cells (T1–7). Each row represents a single gene. Differentially expressed genes (Fold Change > 2; False Discovery Rate (FDR) < 0.05) between treated and control cells are shown on the heatmap (2,286 genes). Two clusters were identified. Cluster-I (872 genes) and cluster-II (1414 genes) contain the genes that were respectively up- and downregulated in treated cells compared to control cells. (B) Gene ontology bar chart of the biological process categories after gene ontology (GO) analysis of differentially expressed genes between egg extract-treated and control cells. Distribution of biological process GO in cluster-I and cluster-II (WebGestalt web tool).
Figure 3
Figure 3
Gene Ontology (GO) flow diagram of the terms related to cell surface receptor signaling pathway (A) and KEGG pathways (B). The analysis was performed on the cluster of upregulated genes in treated cells (fold change > 2) using WebGestalt web tool. The set of genes spotted on the microarray was used as the reference gene list. A: The black and the dotted lines represent respectively direct and indirect and KEGG pathway (www.kegg.jp/kegg/kegg1.html), p values (P) below 0.05 and false discovery rate (FDR) below 0.05 are indicated. Both A and B highlight the disturbance of the TGFβ and Wnt signaling pathways in response to egg extract treatment.
Figure 4
Figure 4
Differentially expressed genes related to TGFβ and Wnt signaling pathways. (A) Cytoscape representation of the genes described in Tables 1, 2. The darkest the node color, the highest the fold change (down regulation in green shades, upregulation in red shades; see Tables 1, 2 for fold change values). (B) Expression profile from qRT-PCR analysis of several genes associated to the TGFβ signaling pathway (smad7-1, smad7-2, dusp6-1, dusp6-2, zeb1b, mmp9), to Wnt/β-catenin signaling pathway (notum1a, frzb), to both pathways (bambia, fn1b), a mesenchymal marker gene (col1a1a), and a set of genes related to pluripotency (nanog, pou2, sox2, c-myca1 and c-myca2). Data are presented as fold change (FC) between treated and non-treated (control) cells. Error bars: SEM errors of the FC mean. A total of 5 to 9 paired samples (treated versus control cells) were analyzed per gene. Statistical test was performed using the nonparametric Wilcoxon test comparing the paired normalized expression values between egg extract treated and control cells. *Significant differences (p < 0.05) between treated and control values. Grey bars: upregulated genes; white bars: down regulated genes. Extensions -1 or -2 in the gene name correspond to duplicated gene copies in goldfish. It should be noted that these qPCR data confirm the microarray results indicating a deregulation of both signaling pathways.
Figure 5
Figure 5
Gene Ontology (GO) flow diagram of the terms related to lipid metabolic process (A) and KEGG pathways (B). The analysis was performed on the cluster of genes downregulated in treated cells (fold change > 2) using WebGestalt web tool. The set of genes spotted on the microarray was used as the reference gene list. (A) The black and the dotted lines represent respectively direct and indirect connections between GO terms. (B) Dre, Danio rerio prefix of the KEGG identifier. For each GO term and KEGG pathway (www.kegg.jp/kegg/kegg1.html), p values (P) below 0.05 and false discovery rate (FDR) below 0.05 are indicated. Both A and B figures highlight the disturbance of lipid metabolism after egg extract treatment, and specifically cholesterol and fatty acid biosynthesis.

Similar articles

Cited by

References

    1. Chenais N, Depince A, Le Bail P-Y, Labbe C. Fin cell cryopreservation and fish reconstruction by nuclear transfer stand as promising technologies for preservation of finfish genetic resources. Aquacult. Int. 2014;22:63–76. doi: 10.1007/s10499-013-9671-4. - DOI
    1. Mauger PE, Le Bail PY, Labbe C. Cryobanking of fish somatic cells: Optimizations of fin explant culture and fin cell cryopreservation. Comp. Biochem. Physiol. B: Biochem. Mol. Biol. 2006;144:29–37. doi: 10.1016/j.cbpb.2006.01.004. - DOI - PubMed
    1. Moritz C, Labbe C. Cryopreservation of goldfish fins and optimization for field scale cryobanking. Cryobiology. 2008;56:181–188. doi: 10.1016/j.cryobiol.2008.02.003. - DOI - PubMed
    1. Niwa K, Ladygina T, Kinoshita M, Ozato K, Wakamatsu Y. Transplantation of blastula nuclei to non-enucleated eggs in the medaka, Oryzias latipes. Dev. Growth Differ. 1999;41:163–172. doi: 10.1046/j.1440-169x.1999.00423.x. - DOI - PubMed
    1. Wakamatsu Y, et al. Fertile and diploid nuclear transplants derived from embryonic cells of a small laboratory fish, medaka (Oryzias latipes) Proc. Natl. Acad. Sci. USA. 2001;98:1071–1076. doi: 10.1073/pnas.98.3.1071. - DOI - PMC - PubMed

Publication types

Substances