. 2023 Jun 20;21(6):e3002162.
doi: 10.1371/journal.pbio.3002162. eCollection 2023 Jun.

A new human embryonic cell type associated with activity of young transposable elements allows definition of the inner cell mass

Affiliations

A new human embryonic cell type associated with activity of young transposable elements allows definition of the inner cell mass

Manvendra Singh et al. PLoS Biol. .

Abstract

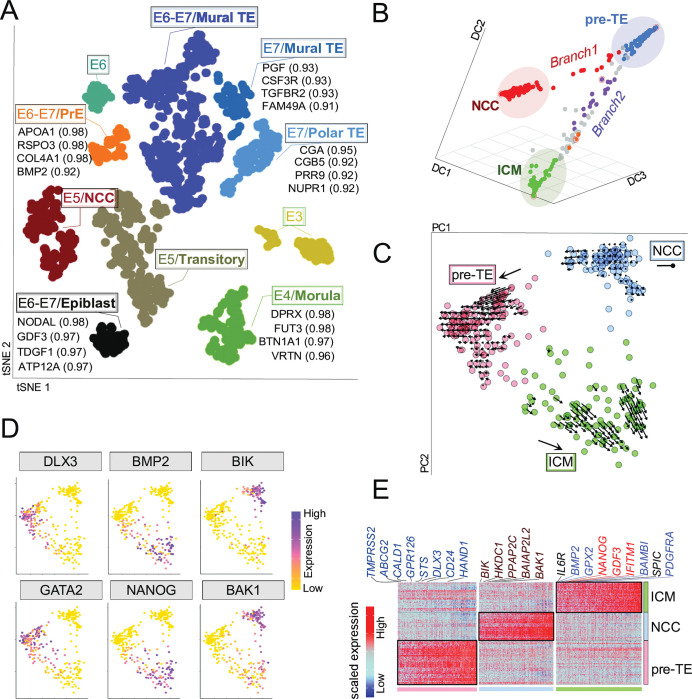
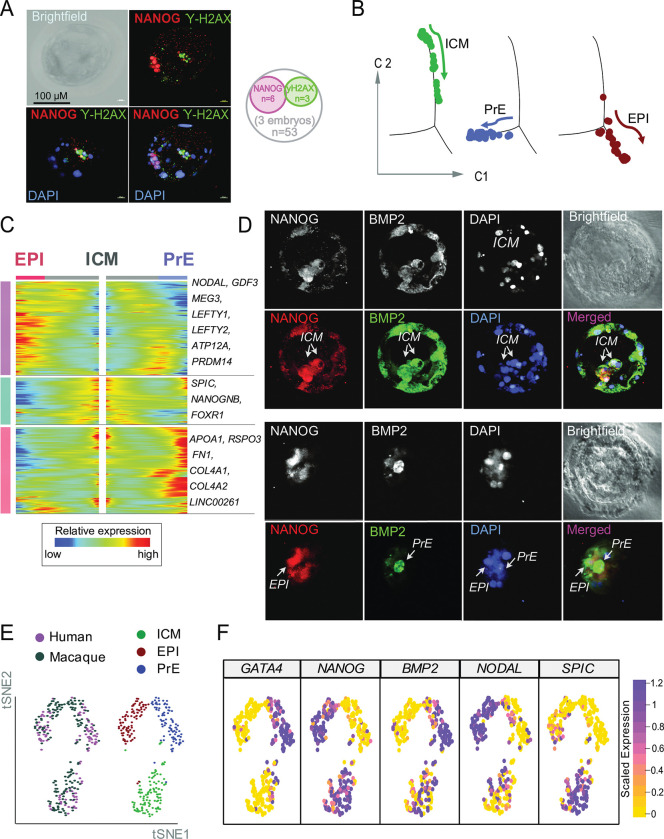
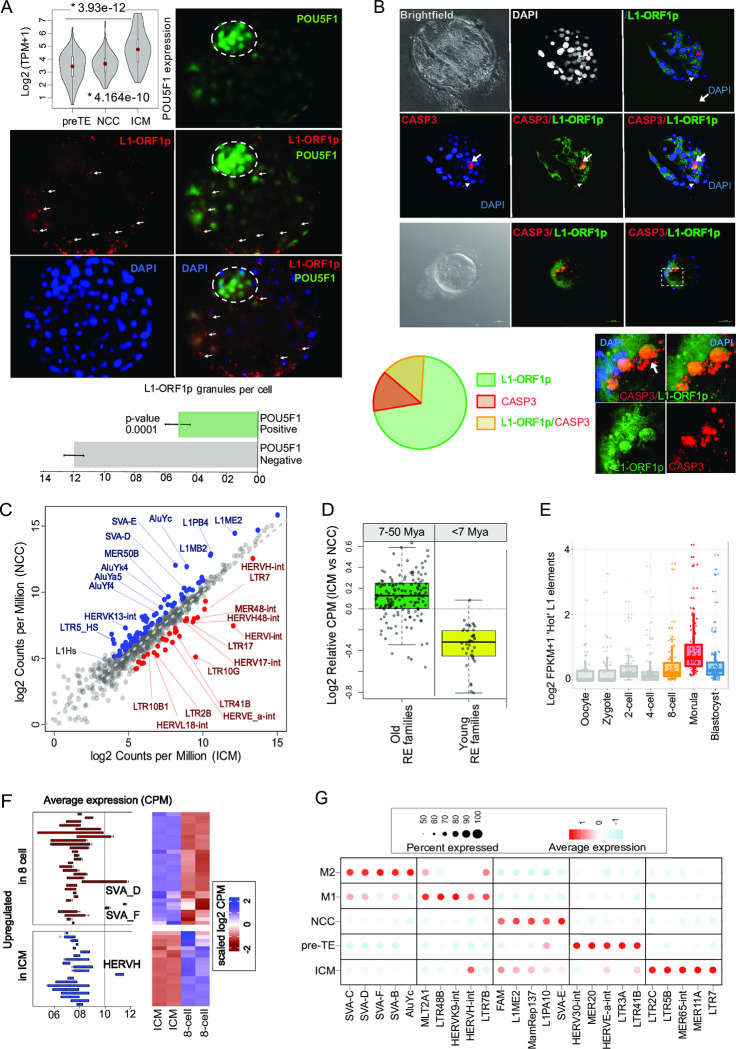
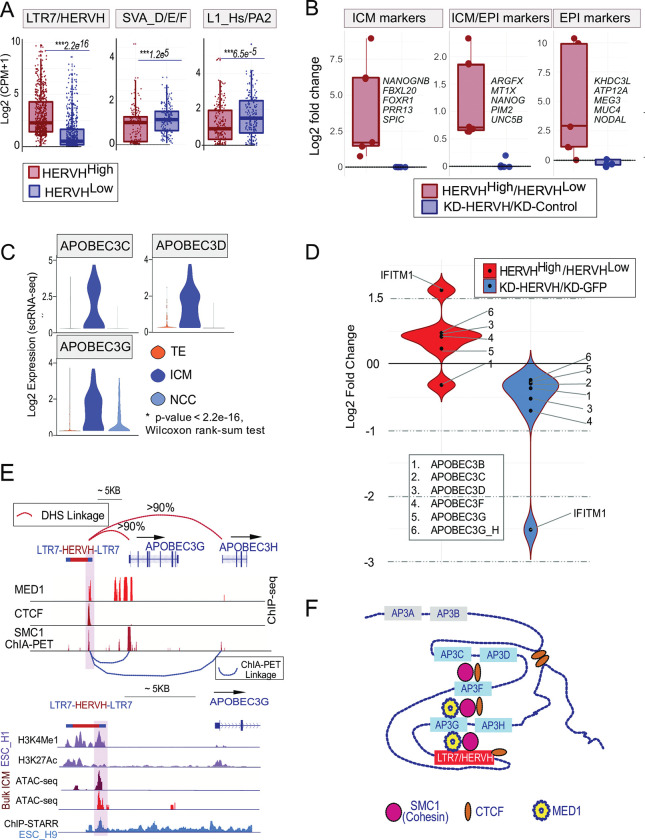
There remains much that we do not understand about the earliest stages of human development. On a gross level, there is evidence for apoptosis, but the nature of the affected cell types is unknown. Perhaps most importantly, the inner cell mass (ICM), from which the foetus is derived and hence of interest in reproductive health and regenerative medicine, has proven hard to define. Here, we provide a multi-method analysis of the early human embryo to resolve these issues. Single-cell analysis (on multiple independent datasets), supported by embryo visualisation, uncovers a common previously uncharacterised class of cells lacking commitment markers that segregates after embryonic gene activation (EGA) and shortly after undergo apoptosis. The discovery of this cell type allows us to clearly define their viable ontogenetic sisters, these being the cells of the ICM. While ICM is characterised by the activity of an Old non-transposing endogenous retrovirus (HERVH) that acts to suppress Young transposable elements, the new cell type, by contrast, expresses transpositionally competent Young elements and DNA-damage response genes. As the Young elements are RetroElements and the cells are excluded from the developmental process, we dub these REject cells. With these and ICM being characterised by differential mobile element activities, the human embryo may be a "selection arena" in which one group of cells selectively die, while other less damaged cells persist.


Conflict of interest statement

The authors have declared that no competing interests exist.

Figures

Fig 1
Fig 1. High-resolution dissection of human preimplantation development identifies a NCC population.
Code to generate these figures is at doi.org/10.5281/zenodo.7925199. (A) Two-dimensional tSNE analysis of human single-cell preimplantation transcriptomes [1,2], using 1,651 MVGs resolves the following distinct cell populations: 8-cell at E3, morula at E4, pluripotent EPI at E6–E7, PrE at E6–E7, mural TE at E7. The E6 turquoise cluster (top left) expresses markers of TE, EPI, and PrE. At E5, cells presenting none of the known lineage markers are referred to as NCCs, whereas cells expressing multiple markers are annotated as transitory cells. For further dissection of E5, see (Fig 1B–1D). The most discriminatory genes of each cluster are listed. Numbers in brackets refer to AUC values. Colours indicate unbiased classification via graph-based clustering, where each dot represents a single cell. Note that the “E” terminology corresponds to the d.p.f. (B) DPT ordering of E5 cells using the top 100 MVGs (expressing (log2 TPM < 1) in 300 single cells is plotted on Diffusion Components DC1, DC2, and DC3. DPT identifies the putative branching points of NCCs (red) and ICM (purple). DM of E5 cells identifies 3 separate branches of pre-TE, ICM, and NCC. (C) RNA velocity projections of single E5 cells are shown on the first 2 PCs. PC biplot is showing the 3 clusters of either ICM, pre-TE, or the NCCs at E5 stage. Arrows are obtained by RNA velocity algorithms that indicate the directionality of single-cell projections. The analysis identifies NCCs as a dead-end cell population. (D) Feature plots based on PC plot from (C) visualising the expression of selected lineage-specific markers, e.g., NANOG, BMP2 (ICM/EPI), DLX3, GATA2 (pre-TE), BIK, BAK1 (NCC). Colour intensity gradient indicates the expression of the marker gene. Each dot represents an individual cell. Note that the NCCs are not expressing lineage markers, but are expressing BIK and BAK pre-apoptotic markers. (E) Heatmap visualisation of scaled expression [log TPM] values of distinctive set of 235 genes (AUC cutoff >0.90) for each cluster shown in (C) (AUC cutoff >0.90) (for the full list of genes see S2 Table). Colour scheme is based on Z-score distribution from −2.5 (gold) to 2.5 (purple). Colour bars at the bottom highlight representative gene sets specific to the respective clusters. The ICM specific gene names in “red” or “blue” are progenitors and are also expressed at E6–E7 in EPI or PrE cells, respectively. AUC, area under curve; DM, diffusion map; d.p.f., day post fertilisation; DPT, diffusion pseudotime; EPI, epiblast; ICM, inner cell mass; MVG, most variable gene; NCC, not-characterised cell; PC, principal component; PrE, primitive endoderm; TE, trophectoderm; TPM, transcript per million; tSNE, t-distributed stochastic neighbour embedding.
Fig 2
Fig 2. Defining the human ICM.
Code to generate these figures is at doi.org/10.5281/zenodo.7925199. (A) Representative confocal immunofluorescent images of human E5 blastocysts co-stained against NANOG (red), γ-H2AX (green), and DAPI (blue); brightfield, black-and-white panels. Cells in the blastocyst are stained either and exclusively with NANOG, representing the compacting cells of the ICM, or with γ-H2AX, representing damaged/dying cells. Note that the γ-H2AX+ cells with disintegrating nucleus are distinct form the committed, pre-TE cells. A representative image is shown (for 2 more independent staining, see also S4A Fig). Magnification is 40×. Venn diagram shows the numerical analysis of the immunofluorescent co-staining performed on the 3 independent embryos (total number of cells = 53). (B) Monocle2 single-cell trajectory analysis and cell ordering along an artificial temporal continuum using the top 500 DEGs between ICM, EPI and PrE populations. The transcriptome from each single cell represents a pseudotime point along an artificial time vector that denotes the progression of ICM to EPI and PrE. Note that the artificial time point progression agrees with the biological time points (ICM is E5 which progresses to E6–E7 EPI and PrE). For clarity, we show this trajectory in 3 facets. (C) Heatmap showing the kinetics of genes changing gradually over the trajectory of ICM differentiation to EPI or PrE. Genes (row) are clustered and cells (column) are ordered according to the pseudotime progression. Genes projected in EPI are associated with self-renewal (NODAL, GDF3, LEFTY1/Y2, CRYPTO), ICM being the progenitor lineage is marked by SPIC, NANOGNB, FOXR1, whereas, PrE projections are determined by APOA1, RSPO3, COL4A1/A2, and FN1. (D) Defining the human ICM as a progenitor cell population of the pluripotent EPI and the PrE. Representative confocal images (projections) of human E5early (upper 2 panels) and E5mid (lower 2 panels) blastocysts stained against NANOG (red), BMP2 (green), and DAPI, nuclear (blue) (brightfield channel (black and white)). In E5early embryos, NANOG and BMP2 co-stain cells of the ICM, whereas in E5mid embryos BMP2 and NANOG stained cells segregate, demonstrating the split of ICM into EPI(NANOG+) and PrE(BMP2+) cells. NCCs are expressing neither NANOG nor BMP2. Note that the nuclear aggregates of disintegrated NCCs (that would not pass the QC of scRNAseq) can be still observed at lateE5/E6 by microscopy. Magnification is 63×. (see also [29]). (E) Comparative single-cell transcriptomics to demonstrate ontogenetic homology to known primate (Cynomolgus fascicularis) [2,86] ICMs. Integrated single-cell transcriptomic data across different conditions [88] using one-to-one orthologs defined in both species. tSNE plots of ICM, EPI, and PrE cells from human (169 cells, purple) and macaque (118 cells, grey) blastocysts after the normalisation using “Seurat-alignment” (top panel). The joint clustering detects 3 distinct cross-species populations that can be identified as ICM, EPI, and PrE (bottom panel). The reclassification of the merged transcriptomes on tSNE plots reveals a similar pattern of distinct cell types in both macaque and human. Note that the macaque cells were presorted by lineage markers (e.g., ICM, EPI, PrE/hypoblast, and TE), thus no NCCs were defined. (F) Unsupervised identification of shared lineage markers between human and macaque. Feature plots of tSNE shown on (B), illustrate conserved gene expression in ICM, PrE, and EPI; SPIC (ICM), NANOG (ICM/EPI) and BMP2 (ICM/PrE), NODAL (EPI) and GATA4 (PrE). See S4 Table for full list of conserved markers. Note that developmental lineage modelling positions the macaque lineages at homologous ontogenetic positions in the trajectory to our defined human ICM, PrE, and EPI (see also S3 and S4 Tables). DEG, differentially expressed gene; EPI, epiblast; ICM, inner cell mass; NCC, not-characterised cell; PrE, primitive endoderm; QC, quality control; TE, trophectoderm; tSNE, t-distributed stochastic neighbour embedding.
Fig 3
Fig 3. LINE-1 expressing cells are excluded from the ICM.
Code to generate these figures is at doi.org/10.5281/zenodo.7925199. (A) Representative confocal images show immunofluorescence staining in human early (E5) blastocysts with anti POU5F1/OCT4 (nuclear, green), L1-ORF1p (cytoplasmic granular, red), DAPI (nuclear, blue). Note: POU5F1+ cells are significantly enriched in the ICM (circled) and compacting near polar TE. A violin plot (upper left panel) visualises the density and expressional dynamics of the POU5F1 in pre-TE, NCC, and ICM at E5. Solid red dots represent the median, while quartiles are represented in the default pattern of boxplots inside the violin plots. Co-staining demonstrates the exclusive expression of POU5F1 and L1_ORF1p during the formation of blastocyst. The cells expressing higher POU5F1 compacting to form the ICM at the polar region of the blastocyst are less well stained for L1-ORF1p. L1-ORF1 stains scattered cells and pre-TE, not included in the compacted population of cells (arrows). L1 (LINE-1_Hs) belongs to a group of mutagenic, Young REs and supports transposition of both LINE-1 and the non-autonomous Alu and SVA elements. Magnification is 40×. See also S1 Movie. (Bottom panel) Numerical analysis of L1-ORF1p expression in POU5F1- vs. POU5F1+ cells in the E5 embryo. The graph shows the average number of L1-ORF1p cytoplasmic foci in POU5F1- and POU5F1+ cells, with standard deviation. Note: pre-TE cells were not considered for this analysis. (B) Representative confocal immunofluorescent images of human E5 blastocysts co-stained against cleaved caspase 3 (cl_Caspase3) (red), L1-ORF1p (green), and DAPI (blue); (brightfield, black-and-white panels). The depicted stage III apoptotic cell overexpresses the L1-ORF1p and marked by cl_Caspase3 and has a disintegrated nucleus (Stage II—narrower arrow). Note that while the expression of pro-apoptotic markers is fluctuating in the embryo, the L1-ORF1p and cl_Caspase3 co-staining could unambiguously mark the cells that both overexpress L1-ORF1p and apoptose (specific to NCC). Two representative experiments are shown. Magnification is 63× (left embryo). The framed section is zoomed out to show the co-stained cells. The Venn diagram shows the quantification of overexpressed L1-ORF1p/cl_Caspase3 marked cells at effective E5 (data from 4 independent human embryos); 380, 296, 92, 46, total number of cells from 4 embryos, L1-ORF1p+, cl_Caspase3+, L1-ORF1p+/cl_Caspase3+, respectively. See also [29]. Timing of the embryo is inferred from state of progression of the embryo as IVF embryos can have absolute timings different from classical. With the blastocyst still being formed, we infer this to E5 equivalent. (C) Phylogenetically young (<7 MY) and old (>7 MY) REs are antagonistically expressed in NCCs and the ICM. The scatterplot shows the comparison of normalised mean expression in CPM of various RE families between the averaged pool of ICM (x-axis) and NCC (y-axis) cells. Read counts per RE family are normalised to total mappable reads per million. Note: The top candidates are shown for both Young REs and Old REs. Young REs include LTR5_HS, AluY, SVA, L1_Hs that are human-specific and the HERVs are either specific to Hominoid or Eutherians. Uniquely mapped reads were considered as 1 alignment per read. Multimapping reads were considered as 1 alignment only if they were mapped to multiple loci, but exclusively within an RE family. Every dot corresponds to an RE family. RE families enriched in ICM (red) vs. NCC (blue). (D) Boxplot showing the distribution of averaged RE expression in ICM vs. NCCs. Note: 7 My distinguishes Old and Young REs (e.g., inserted before and after the split of human and chimp approximately 7 million years ago (Mya) [13,89]). (E) Boxplots showing the expression distribution of “Hot” L1 elements in the human embryonic development stages. Every dot represents a locus of “Hot” L1. (F) Combined boxplots and heatmaps showing distinct pattern of highly expressed transposable element families at day 3 (8-cell) and day 5 (bulk-ICM) (GSE101571) of human preimplantation embryogenesis. Note: SVA_D and HERVH-int are the most abundant REs in the transcriptome of 8-cell and bulk-ICM, respectively, and possess an opposite dynamic of expression. (G) RNA transcript intensity and density of differentially expressed RE families across the cell types of E4 and E5, following the subtraction of NCCs markers. The dot colour shows average expression and scales from blue to red, corresponding to lower and higher expression, respectively. The size of the dot is directly proportional to the percentage of cells expressing the REs in a given cell type. Note the RE expression can be considered as highly specific lineage markers. While HERVH-int is expressed both in morula (M1) and ICM, it is specifically driven by LTR7B and LTR7, respectively. CPM, counts per million; ICM, inner cell mass; NCC, not-characterised cell; RE, retroelement; TE, trophectoderm.
Fig 4
Fig 4. HERVH regulates the expression of APOBEC3G/H in the human ICM.
Code to generate these figures is at doi.org/10.5281/zenodo.7925199. (A) Antagonistic expression of HERVH and Young REs in cells sorted for or against high HERVH expression (HERVHHig) in hESCs. Jittered boxplots show the comparison of expressed LTR7/HERVH and Young RE loci between HERVHHigh (dark red) and HERVHLow (blue) hESC_H9 cells [35] sorted for reporter (HERVH-GFP) expression. For the comparison, we considered only those loci that are full-length and expressed in either of the samples above a threshold (Log2 CPM > 1). P-value is calculated by Wilcoxon test. Each solid dot on the boxplot represents the expression of any individual locus of a given transposable element. Solid bold lines represent the median values, whereas the boxes are partitioned into default quartiles. (B) The effect of HERVH expression on lineage specification. Multiple jittered boxplots display the differential gene expression (DEG, Log2-fold change) of various blastocyst (ICM; ICM/EPI; EPI) lineage markers (red, HERVHHigh vs. HERVHLow cells; blue KD-HERVH vs. KD-GFP (control) in hESC_H1s). We show the top 5 markers. The differential expression values of the individual genes are represented by solid dots in the boxplots. (C) Violin plots visualise the density and expressional dynamics of APOBEC3C, 3D and 3G, implicated in host defence against REs and viruses, in NCC vs. committed cells of pre-TE and ICM. Note: The transcription of the depicted genes mark ICM (E5, human blastocyst). (D) Violin plots illustrate Log2-fold changes of ICM enriched host defence genes (APOBEC3 and IFITM1) that are differentially expressed (eBayes corrected p-value <0.01) in the comparative transcriptome analyses; HERVHHigh/HERVHLow (HERVH-enriched, red) and KD-HERVH-KD/GFP-KD (HERVH-depleted, blue) in H9_ESCs [35]. Note that the HERVH affects the transcription of the APOBEC3/IFITM1 gene panel members in both conditions, but in an opposite way (p-value <0.00007). (E) HERVH as a functional enhancer of APOBEC3G. (Upper panel) IGV plot illustrating the co-occupancy of CTCF, cohesin (SMC1), and mediator 1 (MED1) signals (ChiP-seq, ChIA-PET, RNAseq) over the HERVH/APOBEC3G locus. Significant SMC1-ChIA-PET linkages are shown as blue chain lines. Red chain lines are showing high-confidence correlations of DNase Hypersensitive Sequences (DHS linkage) between the HERVH enhancer and the APOBEC3G/H genes from 79 cell lines. Genome browser view showing H3K4Me1, H3K27Ac, ChIP-STARR-seq [45] (hESC_H9), ATAC-seq (2 replicates of freshly isolated human bulk-ICM) [44] signals at the APOBEC3G locus, including the upstream full-length LTR7-HERVH-LTR7 in human PSCs. Shadowed region highlights the overlapping peaks at the HERVH. (F) Schematic representation of the interaction domain at the HERVH/APOBEC3(AP3) locus based on merged analyses of Hi-C, ChIA-PET, and ChIP-seq datasets. Note that while APOBEC3C/D/F/G/H are in a same domain with HERVH, APOBEC3A and B are located in a separate domain. The domains borders are marked by CTCF binding motifs. The MED1 signal marks potential super-enhancers. DEG, differentially expressed gene; EPI, epiblast; hESC, human embryonic stem cell; ICM, inner cell mass; NCC, not-characterised cell; PSC, pluripotent stem cell; RE, retroelement; TE, trophectoderm.

Comment in

Similar articles

Cited by

References

    1. Yan L, Yang M, Guo H, Yang L, Wu J, Li R, et al.. Single-cell RNA-Seq profiling of human preimplantation embryos and embryonic stem cells. Nat Struct Mol Biol. 2013;20(9):1131–9. Epub 2013/08/13. doi: 10.1038/nsmb.2660 . - DOI - PubMed
    1. Petropoulos S, Edsgard D, Reinius B, Deng Q, Panula SP, Codeluppi S, et al.. Single-Cell RNA-Seq Reveals Lineage and X Chromosome Dynamics in Human Preimplantation Embryos. Cell. 2016;165(4):1012–26. doi: 10.1016/j.cell.2016.03.023 ; PubMed Central PMCID: PMC4868821. - DOI - PMC - PubMed
    1. Meistermann D, Bruneau A, Loubersac S, Reignier A, Firmin J, Francois-Campion V, et al.. Integrated pseudotime analysis of human pre-implantation embryo single-cell transcriptomes reveals the dynamics of lineage specification. Cell Stem Cell. 2021;28(9):1625–40 e6. Epub 2021/05/19. doi: 10.1016/j.stem.2021.04.027 . - DOI - PubMed
    1. Radley A, Corujo-Simon E, Nichols J, Smith A, Dunn SJ. Entropy sorting of single-cell RNA sequencing data reveals the inner cell mass in the human pre-implantation embryo. Stem Cell Reports. 2023;18(1):47–63. Epub 20221013. doi: 10.1016/j.stemcr.2022.09.007 ; PubMed Central PMCID: PMC9859930. - DOI - PMC - PubMed
    1. Sahakyan A, Plath K. Transcriptome Encyclopedia of Early Human Development. Cell. 2016;165(4):777–9. Epub 2016/05/08. doi: 10.1016/j.cell.2016.04.042 ; PubMed Central PMCID: PMC4859939. - DOI - PMC - PubMed

Publication types

Substances