Clustering Heterogeneous Conformational Ensembles of Intrinsically Disordered Proteins with t-Distributed Stochastic Neighbor Embedding
- PMID: 37338049
- PMCID: PMC11108026
- DOI: 10.1021/acs.jctc.3c00224
Clustering Heterogeneous Conformational Ensembles of Intrinsically Disordered Proteins with t-Distributed Stochastic Neighbor Embedding
Abstract
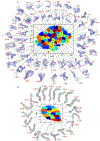
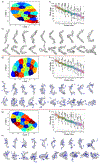
Intrinsically disordered proteins (IDPs) populate a range of conformations that are best described by a heterogeneous ensemble. Grouping an IDP ensemble into "structurally similar" clusters for visualization, interpretation, and analysis purposes is a much-desired but formidable task, as the conformational space of IDPs is inherently high-dimensional and reduction techniques often result in ambiguous classifications. Here, we employ the t-distributed stochastic neighbor embedding (t-SNE) technique to generate homogeneous clusters of IDP conformations from the full heterogeneous ensemble. We illustrate the utility of t-SNE by clustering conformations of two disordered proteins, Aβ42, and α-synuclein, in their APO states and when bound to small molecule ligands. Our results shed light on ordered substates within disordered ensembles and provide structural and mechanistic insights into binding modes that confer specificity and affinity in IDP ligand binding. t-SNE projections preserve the local neighborhood information, provide interpretable visualizations of the conformational heterogeneity within each ensemble, and enable the quantification of cluster populations and their relative shifts upon ligand binding. Our approach provides a new framework for detailed investigations of the thermodynamics and kinetics of IDP ligand binding and will aid rational drug design for IDPs.
Figures


Similar articles
-
The sequence-ensemble relationship in fuzzy protein complexes.Proc Natl Acad Sci U S A. 2021 Sep 14;118(37):e2020562118. doi: 10.1073/pnas.2020562118. Proc Natl Acad Sci U S A. 2021. PMID: 34504009 Free PMC article.
-
Ligand clouds around protein clouds: a scenario of ligand binding with intrinsically disordered proteins.PLoS Comput Biol. 2013;9(10):e1003249. doi: 10.1371/journal.pcbi.1003249. Epub 2013 Oct 3. PLoS Comput Biol. 2013. PMID: 24098099 Free PMC article.
-
Conformational propensities of intrinsically disordered proteins from NMR chemical shifts.Chemphyschem. 2013 Sep 16;14(13):3034-45. doi: 10.1002/cphc.201300387. Epub 2013 Jun 21. Chemphyschem. 2013. PMID: 23794453 Review.
-
Identification of ligand binding sites in intrinsically disordered proteins with a differential binding score.Sci Rep. 2021 Nov 19;11(1):22583. doi: 10.1038/s41598-021-00869-4. Sci Rep. 2021. PMID: 34799573 Free PMC article.
-
Molecular Dynamics Simulations Combined with Nuclear Magnetic Resonance and/or Small-Angle X-ray Scattering Data for Characterizing Intrinsically Disordered Protein Conformational Ensembles.J Chem Inf Model. 2019 May 28;59(5):1743-1758. doi: 10.1021/acs.jcim.8b00928. Epub 2019 Mar 18. J Chem Inf Model. 2019. PMID: 30840442 Review.
Cited by
-
A Stochastic Landscape Approach for Protein Folding State Classification.J Chem Theory Comput. 2024 Jul 9;20(13):5428-5438. doi: 10.1021/acs.jctc.4c00464. Epub 2024 Jun 26. J Chem Theory Comput. 2024. PMID: 38924770 Free PMC article.
-
Boosting Electrochemical Sensing Performances Using Molecularly Imprinted Nanoparticles.Biosensors (Basel). 2024 Jul 22;14(7):358. doi: 10.3390/bios14070358. Biosensors (Basel). 2024. PMID: 39056634 Free PMC article. Review.
-
"Boundary residues" between the folded RNA recognition motif and disordered RGG domains are critical for FUS-RNA binding.J Biol Chem. 2023 Dec;299(12):105392. doi: 10.1016/j.jbc.2023.105392. Epub 2023 Oct 27. J Biol Chem. 2023. PMID: 37890778 Free PMC article.
-
SPEADI: Accelerated Analysis of IDP-Ion Interactions from MD-Trajectories.Biology (Basel). 2023 Apr 10;12(4):581. doi: 10.3390/biology12040581. Biology (Basel). 2023. PMID: 37106781 Free PMC article.
-
Delineating Structural Propensities of the 4E-BP2 Protein via Integrative Modeling and Clustering.J Phys Chem B. 2023 Aug 31;127(34):7472-7486. doi: 10.1021/acs.jpcb.3c04052. Epub 2023 Aug 18. J Phys Chem B. 2023. PMID: 37595014 Free PMC article.
References
MeSH terms
Substances
Grants and funding
LinkOut - more resources
Full Text Sources
