[Preprint]. 2024 Jan 22:2023.05.31.543183.
doi: 10.1101/2023.05.31.543183.

Proteostatic tuning underpins the evolution of novel multicellular traits

Affiliations

Proteostatic tuning underpins the evolution of novel multicellular traits

Kristopher Montrose et al. bioRxiv. .

Update in

Abstract

The evolution of multicellularity paved the way for the origin of complex life on Earth, but little is known about the mechanistic basis of early multicellular evolution. Here, we examine the molecular basis of multicellular adaptation in the Multicellularity Long Term Evolution Experiment (MuLTEE). We demonstrate that cellular elongation, a key adaptation underpinning increased biophysical toughness and organismal size, is convergently driven by downregulation of the chaperone Hsp90. Mechanistically, Hsp90-mediated morphogenesis operates by destabilizing the cyclin-dependent kinase Cdc28, resulting in delayed mitosis and prolonged polarized growth. Reinstatement of Hsp90 or Cdc28 expression resulted in shortened cells that formed smaller groups with reduced multicellular fitness. Together, our results show how ancient protein folding systems can be tuned to drive rapid evolution at a new level of biological individuality by revealing novel developmental phenotypes.


Conflict of interest statement

Competing interests: Authors declare that they have no competing interests.

Figures
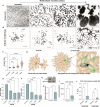
Figure 1:
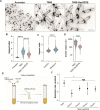
Figure 1:. Hsp90 is downregulated during the evolution of macroscopic multicellularity in snowflake yeast.
(A) Representative images of Snowflake yeast clusters at 200-day time points during the experimental evolution experiment selecting for larger group size (MuLTEE). Scale bar = 500 μm. (B) Representative images of Snowflake yeast cell morphology at 200-day time points during the MuLTEE. Scale bar = 10 μm. (C) Quantification of the cellular aspect ratio of snowflake yeast at 200 day time points (n=300 cells, F3, 1196 = 220.5, p < 0.0001, one way ANOVA, Tukey’s post hoc test Ancestor vs T200 p = 0.004, Ancestor vs T400 p < 0.0001, Ancestor vs T600 p < 0.0001 one way ANOVA). (D) Graphic depicting the effect of cellular elongation on increasing entanglement, leading to clusters that are robust to fracture (19, 21). (E) Quantification of HSC82 expression levels by RT-qPCR in T200, T400 and T600 compared to Ancestor (n=3, F3, 8 = 96.65, p < 0.0001, one way ANOVA, Tukey’s post hoc test Ancestor vs T200 p < 0.0001, Ancestor vs T400 p < 0.0001, Ancestor vs T600 p < 0.0001, one way ANOVA). (F) Quantification of HSP82 expression levels by RT-qPCR in T200, T400 and T600 compared to Ancestor (n=3, F3, 8 = 43.16, p < 0.0001, Tukey’s post hoc test Ancestor vs T200 p < 0.0001, Ancestor vs T400 p < 0.0001, Ancestor vs T600 p < 0.0001, one way ANOVA). (G) Representative immunoblot of Hsp90 expressed by Ancestor and T600 detected using an antibody against Hsp90. Antibody against Beta-actin was used as a loading control. (H) Quantification of relative band intensity of T600 Hsp90 in comparison to Ancestor Hsp90. Bands were normalized to Beta actin loading control (n=3, t = 4.6, p = 0.0098, two-sample t-test). (I) Hsf1 activity in Ancestor and T600 measured as luminescence. Measurement readings of substrate alone were subtracted as background (n=4, t = 6.1, p < 0.0009, two-sample t-test). (J) Hsf1 ChIP-QPCR analysis of Hsc82 and Hsp82 HSE regions in Ancestor and T600. Background was determined using controls with no antibody. Data was normalized against input signal (n=4, Hsc82 t = 2.7, p = 0.026, Hsp82 t = 5.8, p = 0.002, two-sample t-test). All values represent mean ± SEM.
Figure 2:
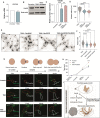
Figure 2:. Overexpression of HSC82 decreases aspect ratio and cluster size of T600 cells.
(A) Representative images of Ancestor, T600 and T600-Hsc82OE cells, highlighting differences in cellular morphology. Scale bar = 10 μm. (B) Quantification of the cellular aspect ratio of Ancestor, T600 and four T600-Hsc82OE clones combined (n=300 cells, T600-Hsc82OE. F2,897 = 665.9, p < 0.0001, one way ANOVA, Tukey’s post hoc test Ancestor vs T600 p < 0.0001, T600 vs T600-Hsc82OE p < 0.0001). (C) Quantification of the cellular aspect ratio of Ancestor and radicicol-treated Ancestor (n=300 cells, t = 16.1, p < 0.0001, two-sample t-test). (D) Cluster size as a measure of cluster radius (μM) for T600 and T600-Hsc82OE (T600 n=1033, T600-Hsc82OE n=3489 from 4 clones), (F1,6229 = 3024, p < 0.0001, one way ANOVA, Tukey’s post hoc test T600 vs Hsc82OE p < 0.0001). (E) Diagram summarizing the competition assay method in (F). All strains were competed against a T600-GFP. (F) Fitness over three rounds of growth and selection, represented as a selection rate constant, for the T600 isolate and four independently-generated clones of T600-Hsc82OE (n=4 per competition). To account for the cost of GFP expression, all selection rate constants were normalized by the mean of the T600 vs. T600-GFP competition. (n=3 per competition) (F1, 14 = 8.4, p = 0.015, nested ANOVA). All values represent mean ± SEM.
Figure 3:
Figure 3:. Expression of HSC82 affects the timing and extent of macroscopic development.
(A) Quantification of HSC82 expression level by RT-QPCR in T200 and T400 compared to Ancestor for the five independent lines of aerobic snowflake yeast (n=4, F8,20 = 4.485, p = 0.003, two way ANOVA, Tukey’s post hoc test Ancestor vs T200 p < 0.0001, Ancestor vs T400 p < 0.0001, T200 vs T400 p = 0.025). (B) HSC82 expression against aspect ratio for T200 and T400 of each of the five lines of aerobic snowflake yeast, (r = 0.74, p = 0.009, y = −0.33x+1.26, Linear regression). (C) Representative images of T600 and T600-Mixotroph to highlight differences in cellular morphology. Scale bar = 10 μm. (D) Quantification of the cellular aspect ratio of T600 and T600-Mixotroph (n=300 cells, t = 32.58, p < 0.0001, two-sample t-test). (E) Quantification of HSC82 expression levels by RT-QPCR in T600 and T600-Mixotroph compared to Ancestor (n=3, F2, 6 = 48.33, p = 0.002, one way ANOVA, Tukey’s post hoc test Ancestor vs T600-mixotroph p = 0.28, T600-mixotroph vs T600 p < 0.0007). All values represent mean ± SEM.
Figure 4:
Figure 4:. Elongation of T600 cells is driven by Hsc82 mediated destabilization of Cdc28.
(A) Quantification of CDC28 expression level by RT-qPCR of T600 compared to Ancestor (n=4, t = 1.67, p = 0.16, two-sample t-test). (B) Representative immunoblot of Cdc28 expressed by Ancestor, T600 and T600-Hsc82OE, detected with anti-Cdc28 antibody. Antibody against Beta-actin was used as a loading control. (C) Quantification of relative band intensity of T600 Cdc28 and T600-Hsc82OE Cdc28 in comparison to Ancestor Cdc28. Bands were normalized to loading control (n=4, F2,9 = 22.35, p = 0.0003, one way ANOVA, Tukey’s post hoc test Ancestor vs T600 p = 0.0003, T600 vs T600-Hsc82OE p = 0.0025). (D) Cluster size as a measure of cluster radius (μM) for T600, T600-Cdc28OE and T600-Hsc82OE (T600 n=2742, T600-Cdc28OE n=4458 from 4 clones, T600-Hsc82OE n=3489 from 4 clones, F1,7195 = 3477, p < 0.0001, one way ANOVA, Tukey’s post hoc test T600 vs T600-Cdc28OE p < 0.0001). (E) Representative images of T600, T600-Cdc28OE, T600-Hsc82OE and T600-Hsc82OE/Cdc28OE cells to highlight cellular morphology. Scale bar = 10 μm. (F) Quantification of the cellular aspect ratio of T600, T600-Cdc28OE, T600-Hsc82OE and T600-Hsc82OE/Cdc28OE (n=400 cells, T600-Cdc28OE and T600-Hsc82OE from 4 combined clones, T600-Hsc82OE/Cdc28OE from 3 combined clones. F3,1596 = 25.25, p < 0.0001, one way ANOVA, Tukey’s post hoc test T600 vs T600-Cdc28OE p < 0.0001, T600 vs T600-Hsc82OE p < 0.0001, T600 vs T600-Hsc82OE/Cdc28OE p < 0.0001). (G) Representative images of mNeonGreen-tagged Shs1 expressed by Ancestor, T600 and T600-Hsc82OE. Mother cell highlighted with red dashed line and daughter cell with white dashed line. Scale bar = 10 μm. Graphic summarizes relationship between septin ring stage and cell cycle stage. (H) Graphical representation of time lapse images for Ancestor, T600 and T600-Hsc82OE (n=10, F6,72 = 14.52, p < 0.0001, two way ANOVA, Tukey’s post hoc test, New Bud Ancestor vs New Bud T600 p = 0.0002, New Bud T600 vs New Bud T600-Hsc82OE p = 0.0008, New Bud Ancestor vs New Bud T600-Hsc82OE p = 0.18). (I) Graphical model for how downregulation of Hsp90 acts on Cdc28 to delay the cell cycle leading to the cellular elongation required for macroscopic evolution during the MuLTEE. All values represent mean ± SEM.

Similar articles

References

    1. Bonner J. T., The origins of multicellularity. Integrative Biology: Issues, News, and Reviews 1, 27–36 (1998) DOI: 10.1002/(SICI)1520-6602(1998)1:1&lt;27::AID-INBI4&gt;3.0.CO;2-6 - DOI
    1. Brunet T., King N., The Origin of Animal Multicellularity and Cell Differentiation. Developmental cell 43, 124–140 (2017) DOI: 10.1016/j.devcel.2017.09.016 - DOI - PMC - PubMed
    1. Carroll S. B., Chance and necessity: the evolution of morphological complexity and diversity. Nature 409, 1102–1109 (2001) DOI: 10.1038/35059227 - DOI - PubMed
    1. Grosberg R. K., Strathmann R. R., The Evolution of Multicellularity: A Minor Major Transition? Annual Review of Ecology, Evolution, and Systematics 38, 621–654 (2007) DOI: 10.1146/annurev.ecolsys.36.102403.114735 - DOI
    1. Umen J., Herron M. D., Green Algal Models for Multicellularity. Annual review of genetics 55, 603–632 (2021) DOI: 10.1146/annurev-genet-032321-091533 - DOI - PubMed

Publication types