Gene expression dynamics of natural assemblages of heterotrophic flagellates during bacterivory
- PMID: 37322519
- PMCID: PMC10268365
- DOI: 10.1186/s40168-023-01571-5
Gene expression dynamics of natural assemblages of heterotrophic flagellates during bacterivory
Abstract
Background: Marine heterotrophic flagellates (HF) are dominant bacterivores in the ocean, where they represent the trophic link between bacteria and higher trophic levels and participate in the recycling of inorganic nutrients for regenerated primary production. Studying their activity and function in the ecosystem is challenging since most of the HFs in the ocean are still uncultured. In the present work, we investigated gene expression of natural HF communities during bacterivory in four unamended seawater incubations.
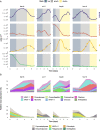
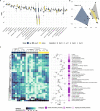
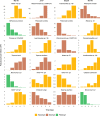
Results: The most abundant species growing in our incubations belonged to the taxonomic groups MAST-4, MAST-7, Chrysophyceae, and Telonemia. Gene expression dynamics were similar between incubations and could be divided into three states based on microbial counts, each state displaying distinct expression patterns. The analysis of samples where HF growth was highest revealed some highly expressed genes that could be related to bacterivory. Using available genomic and transcriptomic references, we identified 25 species growing in our incubations and used those to compare the expression levels of these specific genes. Video Abstract CONCLUSIONS: Our results indicate that several peptidases, together with some glycoside hydrolases and glycosyltransferases, are more expressed in phagotrophic than in phototrophic species, and thus could be used to infer the process of bacterivory in natural assemblages.
Keywords: Bacterivory; Functional genes; Glycosidases; Heterotrophic flagellates; Metatranscriptomics; Peptidases; Phagocytosis; Unamended incubations.
© 2023. The Author(s).
Conflict of interest statement
The authors declare no competing interests.
Figures


Similar articles
-
Dominant marine heterotrophic flagellates are adapted to natural planktonic bacterial abundances.Environ Microbiol. 2022 May;24(5):2421-2434. doi: 10.1111/1462-2920.15911. Epub 2022 Jan 31. Environ Microbiol. 2022. PMID: 35080092 Free PMC article.
-
Bacterivory by heterotrophic flagellates: community structure and feeding strategies.Antonie Van Leeuwenhoek. 2002 Aug;81(1-4):465-80. doi: 10.1023/a:1020509305868. Antonie Van Leeuwenhoek. 2002. PMID: 12448743 Review.
-
Culturing bias in marine heterotrophic flagellates analyzed through seawater enrichment incubations.Microb Ecol. 2013 Oct;66(3):489-99. doi: 10.1007/s00248-013-0251-y. Epub 2013 Jun 11. Microb Ecol. 2013. PMID: 23749062
-
Microbial community structure and dynamics in the largest natural French lake (Lake Bourget).Microb Ecol. 2006 Jul;52(1):72-89. doi: 10.1007/s00248-004-0230-4. Epub 2006 May 29. Microb Ecol. 2006. PMID: 16733620
-
Ecology of planktonic heterotrophic flagellates. A review.Riv Biol. 2003 Jan-Apr;96(1):55-71. Riv Biol. 2003. PMID: 12852174 Review.
Cited by
-
How marine are Marine Stramenopiles (MAST)? A cross-system evaluation.FEMS Microbiol Ecol. 2024 Oct 25;100(11):fiae130. doi: 10.1093/femsec/fiae130. FEMS Microbiol Ecol. 2024. PMID: 39375832 Free PMC article.
References
Publication types
MeSH terms
Associated data
LinkOut - more resources
Full Text Sources
Research Materials
Miscellaneous

