. 2023 Jun 16;380(6650):eadg0934.
doi: 10.1126/science.adg0934. Epub 2023 Jun 16.

Aging Fly Cell Atlas identifies exhaustive aging features at cellular resolution

Affiliations

Aging Fly Cell Atlas identifies exhaustive aging features at cellular resolution

Tzu-Chiao Lu et al. Science. .

Abstract

Aging is characterized by a decline in tissue function, but the underlying changes at cellular resolution across the organism remain unclear. Here, we present the Aging Fly Cell Atlas, a single-nucleus transcriptomic map of the whole aging Drosophila. We characterized 163 distinct cell types and performed an in-depth analysis of changes in tissue cell composition, gene expression, and cell identities. We further developed aging clock models to predict fly age and show that ribosomal gene expression is a conserved predictive factor for age. Combining all aging features, we find distinctive cell type-specific aging patterns. This atlas provides a valuable resource for studying fundamental principles of aging in complex organisms.


Conflict of interest statement

Competing interests: H.J., N.K., and X.T.C. are employees of Genentech, Inc. The other authors declare no competing interests.

Figures

Figure 1.
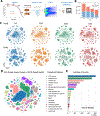
Figure 1.. Overview of AFCA.
A) Flowchart of snRNA-seq experiment. Flies are collected at 30, 50, and 70 days. The heads and bodies of males and females are processed separately. 5d samples are from the FCA. B) Number of nuclei collected from different ages and sexes. C) tSNE visualizations of the head and body samples from different ages. D) tSNE visualizations showing broad cell classes of datasets integrated across different time points. E) Number of nuclei for each broad cell class shown in 1D.
Figure 2.
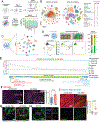
Figure 2.. AFCA resource and changes of cell composition during aging.
A) Flowchart of transferring annotations from FCA to AFCA. B) Cell types annotated in the AFCA head and body shown on tSNE. The number of annotated cell types corresponding to the broad cell classes is shown in the table. C) Identification of 17 new neuronal clusters after combining AFCA and FCA head data. D) Pseudotime and cellular composition of ISC and ISC-differentiated cell types. ISC, intestinal stem cell; EB, enteroblast; EC, enterocyte; EE, enteroendocrine cell; a. EC, anterior EC; p. EC, posterior EC; diff. EC, differentiating EC. E) Changes of cellular composition during aging. Each dot represents one cell type. Each color compares one aged sample and the 5d sample. Dot sizes reflect the nuclear numbers of the corresponding cell type from the aged population. Tissue origins are indicated. F) Comparison of the number of nuclei of the fat body from young and old flies. Nuclei are stained by DAPI and counted in each fly. The nuclear number is significantly increased in the 50d population (t-test, 50d vs. 5d, P value=0.0023). Error bar, standard deviation (SD). G) Representative confocal images showing nuclei in young and old fat body cells. The membrane is labeled by cg-GAL4 > UAS-CD8GFP. Nuclei are stained by DAPI and the LamC antibody. H) Fat body cells with segregating nuclei stained by pH3, DAPI, LamC, and GFP. I) Indirect flight muscle stained with cleaved-Caspase3 antibody, DAPI, and Phalloidin. CleavedCaspase3 signals are significantly increased in the aged population (t-test, 50d vs. 5d, P value<0.0001). Median numbers indicated.
Figure 3.
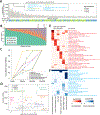
Figure 3.. Differentially expressed genes (DEGs)
A) Number of DEGs from different cell types. Each age group is compared with the 5d population. Each line shows the number of DEGs from the indicated age comparison. Cell types are ranked by DEG numbers from high to low (50d vs 5d). The top 10 cell types are indicated. B) Ratio of DEGs from each age comparison. Arrows point out representative cell types that are further compared in Fig. 3C. C) Cumulative ratios of DEGs from cell types indicated in Fig. 3B. D) Combination of DEG number and change of nuclear number illustrate different aging patterns. E-F) Top 5 cell type-specific GOs from selected cell types. E) GOs enriched in the selected cell types based on up-regulated DEGs. F) GOs enriched in the selected cell types based on down-regulated DEGs.
Figure 4.
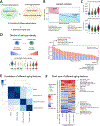
Figure 4.. Aging clock analysis.
A) Example of aging clocks for outer photoreceptor cells and adult oenocytes. Redline is the fitted regression line. Blue dots represent individual predictions where each dot corresponds to one cell. We measure performance as the proportion of the variance for an age variable that’s explained by transcriptome (R2). B, C) Predictive performance of cell type-specific aging clocks for head and body cell types. 15 cell types with the highest scores are shown. Error bars are estimated as a SD over 5 runs. D) Accuracy of logistic regression models trained to distinguish transcriptome between two consecutive time points. Boxplots show the distribution across head cell types (left) and body cell types (right). E) Number of aging clock genes as a function of the number of cell types (left). 80% of genes appear in less than 5 cell types. Out of 480 genes identified as aging clock genes, 70 encode RP genes (right). F-G) Examples of aging clock genes for outer photoreceptor cell F) and adult oenocyte G). Cell type-specific genes that appear in less than 5 cell types are shown in black color, while genes that appear in at least 5 cell types are marked in red color. H) Aging clock genes identified in flies and mice. 33 genes are 1–1 orthologs between the two species, and 31 of these are RP genes.
Figure 5.
Figure 5.. Systematic comparisons of different aging features.
A) Flowchart of comparing different aging features. B) Expressed gene numbers per cell from each cell type are compared between 50d and 5d flies. The red block shows cell types with increased expressed gene numbers, while the blue block includes cell types with decreased ones. C) Two cell types, hemocyte from the head and oenocyte, have the highest increase and decrease of expressed gene numbers per cell. D) Decline of cell identity during aging. The left panel illustrates two different mechanisms of decreasing cell identity. The right panel shows the ratio of marker genes decreasing cell identity. Each line in the right panel represents one cell type. E) Spearman’s correlation of different aging features. F) Rank sums of different aging features. The heatmap shows the overall rank sum scores from different cell types. High aging ranks are shown in red, while low aging ranks are shown in blue. Neuron- or glia-related cell types are indicated beside the heatmap.

Similar articles

  • Fly Cell Atlas: A single-nucleus transcriptomic atlas of the adult fruit fly.
    Li H, Janssens J, De Waegeneer M, Kolluru SS, Davie K, Gardeux V, Saelens W, David FPA, Brbić M, Spanier K, Leskovec J, McLaughlin CN, Xie Q, Jones RC, Brueckner K, Shim J, Tattikota SG, Schnorrer F, Rust K, Nystul TG, Carvalho-Santos Z, Ribeiro C, Pal S, Mahadevaraju S, Przytycka TM, Allen AM, Goodwin SF, Berry CW, Fuller MT, White-Cooper H, Matunis EL, DiNardo S, Galenza A, O'Brien LE, Dow JAT; FCA Consortium§; Jasper H, Oliver B, Perrimon N, Deplancke B, Quake SR, Luo L, Aerts S, Agarwal D, Ahmed-Braimah Y, Arbeitman M, Ariss MM, Augsburger J, Ayush K, Baker CC, Banisch T, Birker K, Bodmer R, Bolival B, Brantley SE, Brill JA, Brown NC, Buehner NA, Cai XT, Cardoso-Figueiredo R, Casares F, Chang A, Clandinin TR, Crasta S, Desplan C, Detweiler AM, Dhakan DB, Donà E, Engert S, Floc'hlay S, George N, González-Segarra AJ, Groves AK, Gumbin S, Guo Y, Harris DE, Heifetz Y, Holtz SL, Horns F, Hudry B, Hung RJ, Jan YN, Jaszczak JS, Jefferis GSXE, Karkanias J, Karr TL, Katheder NS, Kezos J, Kim AA, Kim SK, Kockel L, Konstantinides N, Kornberg TB, Krause HM, Labott AT, Laturney M, Lehmann R, Leinwand S, Li J, Li JSS, Li K, Li K, Li L, Li T, Litovchenko M, Liu HH, Liu Y, Lu TC, Manning J, M… See abstract for full author list ➔ Li H, et al. Science. 2022 Mar 4;375(6584):eabk2432. doi: 10.1126/science.abk2432. Epub 2022 Mar 4. Science. 2022. PMID: 35239393 Free PMC article.
  • Transcriptome profiling of aging Drosophila photoreceptors reveals gene expression trends that correlate with visual senescence.
    Hall H, Medina P, Cooper DA, Escobedo SE, Rounds J, Brennan KJ, Vincent C, Miura P, Doerge R, Weake VM. Hall H, et al. BMC Genomics. 2017 Nov 21;18(1):894. doi: 10.1186/s12864-017-4304-3. BMC Genomics. 2017. PMID: 29162050 Free PMC article.
  • A Single-Cell Transcriptome Atlas of the Aging Drosophila Brain.
    Davie K, Janssens J, Koldere D, De Waegeneer M, Pech U, Kreft Ł, Aibar S, Makhzami S, Christiaens V, Bravo González-Blas C, Poovathingal S, Hulselmans G, Spanier KI, Moerman T, Vanspauwen B, Geurs S, Voet T, Lammertyn J, Thienpont B, Liu S, Konstantinides N, Fiers M, Verstreken P, Aerts S. Davie K, et al. Cell. 2018 Aug 9;174(4):982-998.e20. doi: 10.1016/j.cell.2018.05.057. Epub 2018 Jun 18. Cell. 2018. PMID: 29909982 Free PMC article.
  • Functional senescence in Drosophila melanogaster.
    Grotewiel MS, Martin I, Bhandari P, Cook-Wiens E. Grotewiel MS, et al. Ageing Res Rev. 2005 Aug;4(3):372-97. doi: 10.1016/j.arr.2005.04.001. Ageing Res Rev. 2005. PMID: 16024299 Review.
  • As time flies by: Investigating cardiac aging in the short-lived Drosophila model.
    Blice-Baum AC, Guida MC, Hartley PS, Adams PD, Bodmer R, Cammarato A. Blice-Baum AC, et al. Biochim Biophys Acta Mol Basis Dis. 2019 Jul 1;1865(7):1831-1844. doi: 10.1016/j.bbadis.2018.11.010. Epub 2018 Nov 27. Biochim Biophys Acta Mol Basis Dis. 2019. PMID: 30496794 Free PMC article. Review.

Cited by

References

    1. López-Otín C, Blasco MA, Partridge L, Serrano M, Kroemer G, The Hallmarks of Aging. Cell. 153, 1194–1217 (2013). - PMC - PubMed
    1. Niccoli T, Partridge L, Ageing as a Risk Factor for Disease. Curr. Biol. 22, R741–R752 (2012). - PubMed
    1. Harman D, The Free Radical Theory of Aging. Antioxid. Redox Signal. 5, 557–561 (2003). - PubMed
    1. Bellen HJ, Tong C, Tsuda H, 100 years of Drosophila research and its impact on vertebrate neuroscience: a history lesson for the future. Nat. Rev. Neurosci. 11, 514–522 (2010). - PMC - PubMed
    1. Baldridge D, Wangler MF, Bowman AN, Yamamoto S, Acosta MT, et al., Model organisms contribute to diagnosis and discovery in the undiagnosed diseases network: current state and a future vision. Orphanet J. Rare Dis. 16, 206 (2021). - PMC - PubMed