. 2023 Aug 31;14(4):e0222422.
doi: 10.1128/mbio.02224-22. Epub 2023 Jun 12.

EFdA efficiently suppresses HIV replication in the male genital tract and prevents penile HIV acquisition

Affiliations

EFdA efficiently suppresses HIV replication in the male genital tract and prevents penile HIV acquisition

Martina Kovarova et al. mBio. .

Abstract

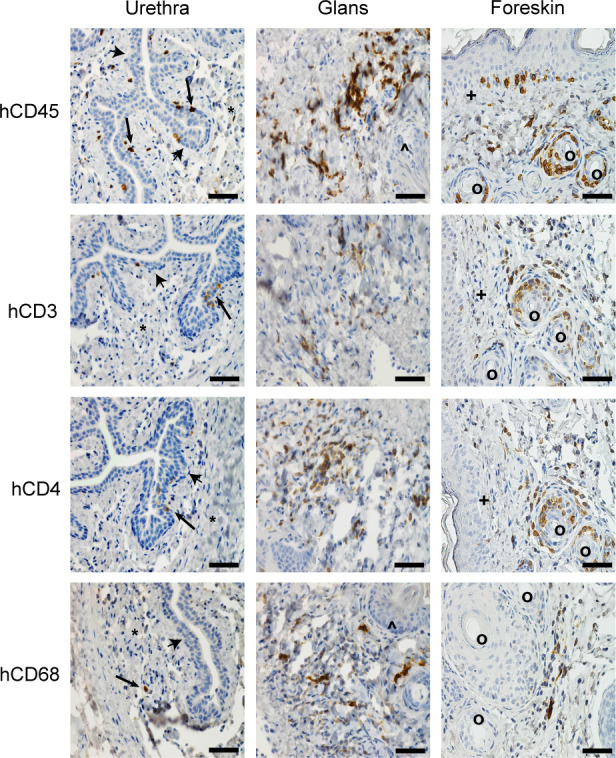
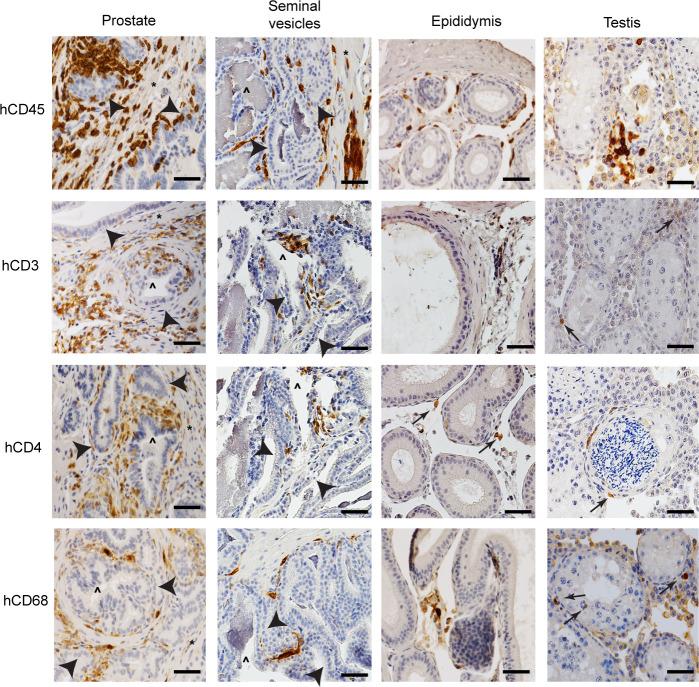
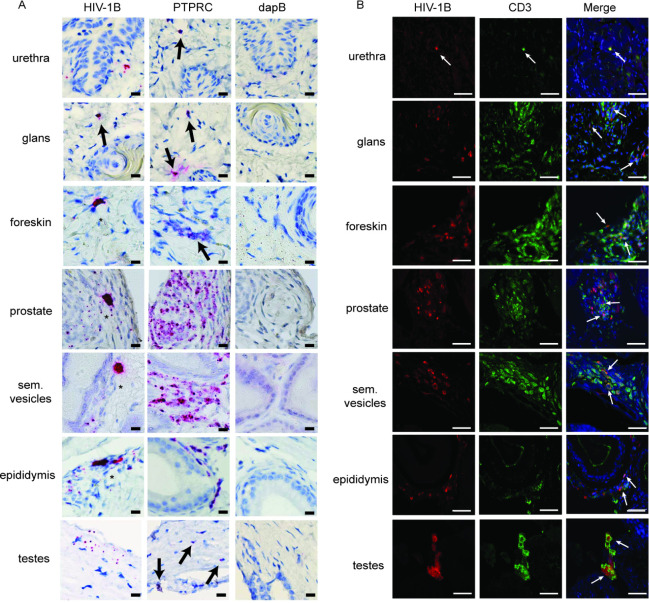
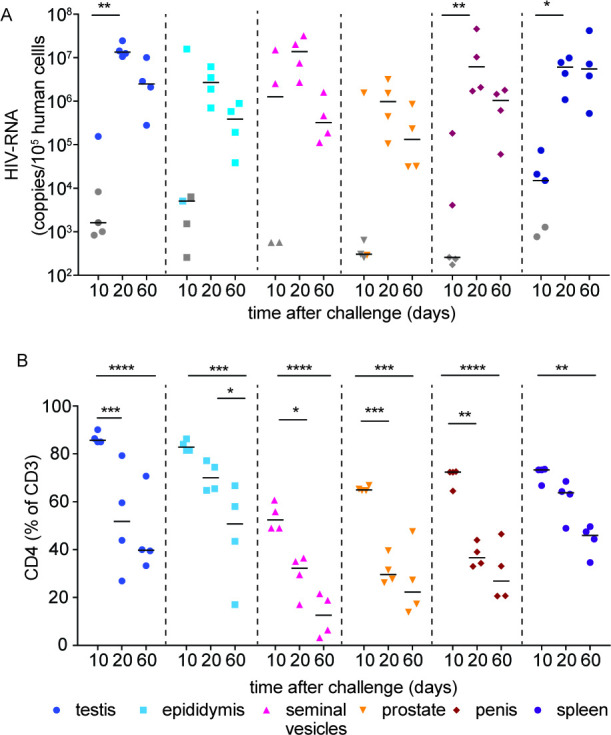
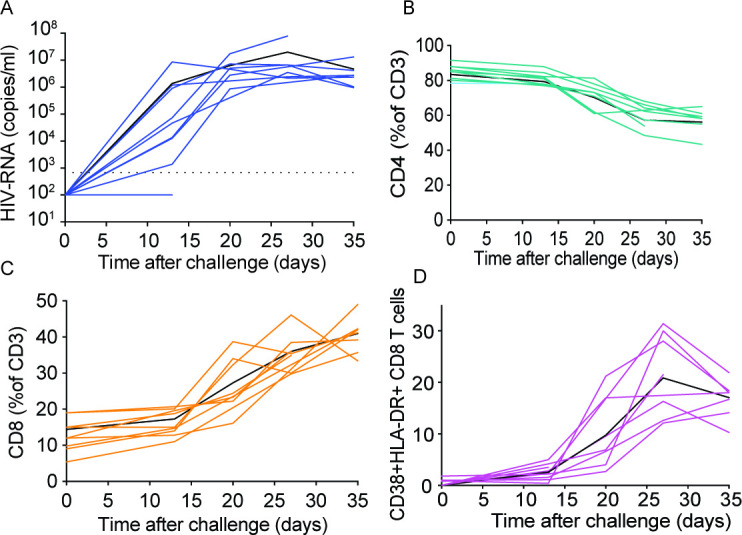
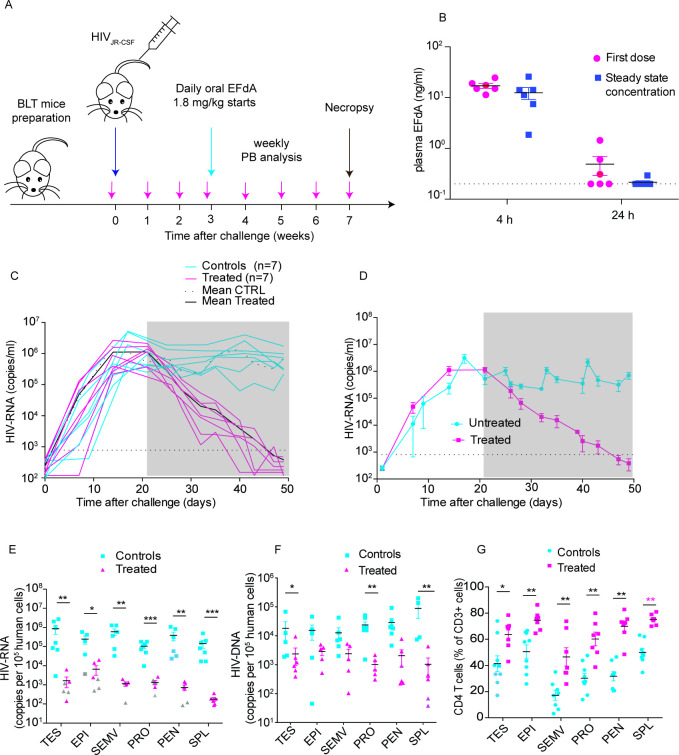
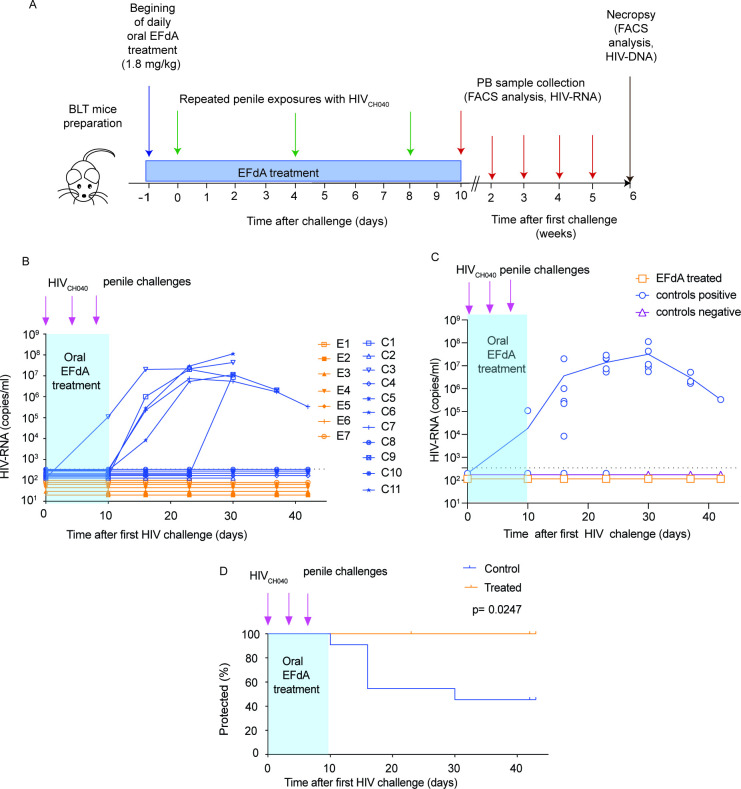
Sexually transmitted HIV infections in heterosexual men are acquired through the penis. Low adherence to condom usage and the fact that 40% of circumcised men are not protected indicate the need for additional prevention strategies. Here, we describe a new approach to evaluate the prevention of penile HIV transmission. We demonstrated that the entire male genital tract (MGT) of bone marrow/liver/thymus (BLT) humanized mice is repopulated with human T and myeloid cells. The majority of the human T cells in the MGT express CD4 and CCR5. Direct penile exposure to HIV leads to systemic infection including all tissues of the MGT. HIV replication throughout the MGT was reduced 100-1,000-fold by treatment with 4'-ethynyl-2-fluoro-2'-deoxyadenosine (EFdA), resulting in the restoration of CD4+ T cell levels. Importantly, systemic preexposure prophylaxis with EFdA effectively protects from penile HIV acquisition. IMPORTANCE Over 84.2 million people have been infected by the human immunodeficiency virus type 1 (HIV-1) during the past 40 years, most through sexual transmission. Men comprise approximately half of the HIV-infected population worldwide. Sexually transmitted HIV infections in exclusively heterosexual men are acquired through the penis. However, direct evaluation of HIV infection throughout the human male genital tract (MGT) is not possible. Here, we developed a new in vivo model that permits, for the first time, the detail analysis of HIV infection. Using BLT humanized mice, we showed that productive HIV infection occurs throughout the entire MGT and induces a dramatic reduction in human CD4 T cells compromising immune responses in this organ. Antiretroviral treatment with novel drug EFdA suppresses HIV replication in all tissues of the MGT, restores normal levels of CD4 T cells and is highly efficient at preventing penile transmission.

Keywords: EFdA; HIV pathogenesis; HIV prevention; HIV treatment; human immunodeficiency virus; male genital tract; penile infection; stem cells.


Conflict of interest statement

The authors declare no conflict of interest.

Figures

Fig 1
Fig 1
Human hematopoietic cells relevant to HIV infection efficiently populate the penis. Immunohistochemical analysis of the hematopoietic cell subsets (CD45+ human cells, CD3+ T cells, CD4+ T cells, CD68+ myeloid cells) present in the penile tissues (urethra, glans, and foreskin) of a male BLT mouse. Positive cells are stained dark brown (arrows) and nuclei are stained blue. Urethral epithelium (arrowheads), lamina propria (*), keratinized penile spines (^), foreskin epithelium (+), hair follicles in foreskin (°). Scale bars represent 50 µm. Tissue sections shown are representative of 12 sections taken from six uninfected BLT mice (n = 6).
Fig 2
Fig 2
Human hematopoietic cells are present throughout the entire male genital tract. Hematopoietic cell subsets (CD45+ human cells, CD3+ T cells, CD4+ T cells, and CD68+ myeloid cells) present in the male genital tract tissues (prostate, seminal vesicles, epididymis, and testis) of BLT mice. Positive cells are stained dark brown; nuclei are stained blue. Epithelium (arrowheads), smooth muscle (*), gland lumen (^). Scale bars represent 50 µm. Tissue sections shown are representative of 12 sections taken from six uninfected BLT mice. n = 6.
Fig 3
Fig 3
Flow cytometry analysis of hematopoietic cells present in the male genital tract. (A) Cells isolated from the penis, prostate, seminal vesicles, epididymis, testes, and spleen of a representative male BLT mouse analyzed by flow cytometry to demonstrate reconstitution with human CD4+ T cells, CD8+ T cells, and CCR5+ CD4+ T cells in each compartment. T cells are shown as a percentage of the CD45 human hematopoietic cells present (B) and CD4+ T cells (C) and CD8+ T cells (D) are shown as a percentage of the CD3+ T cells in the penis, prostate, seminal vesicles, epididymis, testes, spleen, lymph nodes (LN), and peripheral blood (PB). Analysis of CCR5 expression on CD4+ T cells (E) and CD8+ T cells (F) in MGT tissues, spleen, LN, and PB. Lines show the mean for each tissue. A Mann–Whitney U-test was used to compare the frequencies of immune cell populations between the spleen and MGT tissues of BLT mice. SPL spleen, LN lymph nodes, PB peripheral blood, PEN penis, EPI epididymis, SEMV seminal vesicles, TES testis, and PRO prostate. *P < 0.05, **P < 0.01, n = 6.
Fig 4
Fig 4
HIV-RNA and p24 expression in the MGT. Male BLT mice were infected intravenously with HIV-1CH040 (n = 3) (3 × 10⁴ TCIU). Two weeks postinfection mice were euthanized, individual MGT tissues isolated, fixed in 10% formalin, paraffin-embedded, and analyzed by RNAscope and immunofluorescence. (A) Analysis of gag HIV-RNA in MGT tissues using RNAscope with the Fast Red colorimetric system. A probe specific for HIV-1 clade B (HIV-1B) was used to identify HIV, a probe specific for human tyrosine phosphatase receptor type C (PTPRC or CD45) mRNA was used to identify human hematopoietic cells. A probe specific for bacterial 4-hydroxy-tetrahydrodipicolinate reductase (or dapB) was used as a negative control. Mayer’s hematoxylin was used as counterstain. Arrows: HIV-infected cells, * clusters of productively infected cells. Scale bars = 25 μm. (B) Double immunofluorescence staining analysis for HIV p24 (red) and human CD3 (green) expression. DAPI (shown in blue) was used as counterstain for nucleated cells. Arrows indicate examples of infected T cells. The scale bars represent 50 µm. Sections shown are representative of 6 sections taken from three infected BLT mice.
Fig 5
Fig 5
Kinetics of HIV infection and its sequela in the male genital tract. Male BLT mice were infected with HIV-1JR-CSF intravenously (3 × 10⁴ TCIU). At 10, 20, and 60 days postinfection, the testis, epididymis, seminal vesicles, prostate, penis, and spleen were analyzed for cell-associated HIV-RNA (A) and CD4+ T cells levels (B). HIV-RNA limit of detection (LOD) was calculated for each individual sample based on the number of human cells available for analysis. Grey symbols indicate samples below the LOD, lines indicate the median for each data set. A Mann–Whitney U-test was used to compare the frequencies of CD4+ T cell levels between samples collected at 10 day postinfection and those present at 20 or 60 day postinfection. *P < 0.05, **P < 0.01, ***P < 0.001, ****P < 0.0001, n = 5 at 10 day postinfection, n = 4 at 20 and 60 days postinfection.
Fig 6
Fig 6
Direct viral exposure to the penis results in systemic HIV infection. Anesthetized male BLT mice were exposed to HIV-1CH040 by direct penile exposure onto the meatus urethra. Peripheral blood plasma viral load (A), CD4+ T cell levels (B), CD8+ T cell levels (C), and CD8+ T cell activation levels (D) were analyzed longitudinally for 5 weeks. Solid black lines in each panel indicate mean values (n = 9).
Fig 7
Fig 7
EFdA effectively reduces HIV levels in the peripheral blood and throughout the male genital tract. (A) Experimental design. BLT mice (n = 14) were exposed intravenously to HIV-1JR-CSF. Three weeks post-exposure, infected BLT mice were treated daily with EFdA (1.8 mg/kg) for 4 weeks (n = 7) or left untreated (n = 7). HIV-RNA in peripheral blood plasma was monitored longitudinally. After 4 weeks of treatment, all mice were euthanized and cell-associated HIV-RNA, cell-associated HIV-DNA and CD4+ T cell levels in the tissues of the MGT were analyzed. (B) Analysis of EFdA levels in plasma 4 hour and 24 hour after the first oral dose (left) and at steady state after 1 week of daily oral dosing (mean ± s.e.m. are shown). (C) HIV-RNA levels in the plasma of individual mice. (D) Mean plasma viremia (± s.e.m.) of the EFdA-treated and control animals (C). The grey shaded area indicates the time of EFdA treatment. The dotted line indicates the HIV-RNA limit of detection. Analysis of cell-associated HIV-RNA (E), cell-associated HIV-DNA (F), and CD4+ T cell levels (G) in MGT tissues and the spleen 4 weeks after initiation of treatment with EFdA. The HIV-RNA limit of detection (LOD) was calculated for each sample based on the number of human cells available for analysis for each tissue. Grey symbols in (E), (F) and (G) indicate samples below the LOD and black lines indicate mean values for each data set. A Mann–Whitney U test was used to compare cell-associated HIV-RNA (E), cell-associated HIV-DNA (F) and CD4 T cell levels. (*P < 0.05, **P < 0.01, ***P < 0.001, n = 9).
Fig 8
Fig 8
EFdA protects against penile HIV transmission. (A) Experimental design. Untreated BLT mice (n = 11) and BLT mice treated daily with oral EFdA (1.8 mg/kg) (n = 7) were challenged with HIV-1CH040 via their penis at days 1, 4 and 8 of treatment. Plasma HIV-RNA levels in peripheral blood were monitored longitudinally. (B) Plasma level of HIV-RNA in individual mice, (C) the mean HIV-RNA levels in the plasma of control untreated mice (blue line) or EFdA treated mice (orange line) with circles indicating the HIV-RNA values for each individual mouse. For clarity of representation in the figure, the HIV-RNA values for control uninfected mice and EFdA-treated mice with undetectable HIV-RNA in plasma were inputted as 1/2 and 1/3 of the limit of detection (346.3 copies/mL), respectively. (D) Kaplan–Meier plot showing significant protection from penile HIV transmission in EFdA-treated BLT mice compared to untreated controls. The blue shaded area indicates the time of daily oral treatment with EFdA. The dotted line in B, C indicates the HIV-RNA limit of detection.

Similar articles

Cited by

References

    1. UNAIDS . 2020. Global HIV & AIDS Statistics — 2020 fact sheet. https://www.unaids.org/en/resources/fact-sheet.
    1. Baeten JM, Kahle E, Lingappa JR, Coombs RW, Delany-Moretlwe S, Nakku-Joloba E, Mugo NR, Wald A, Corey L, Donnell D, Campbell MS, Mullins JI, Celum C, Partners in Prevention HSV/HIV Transmission Study Team . 2011. Genital HIV-1 RNA predicts risk of heterosexual HIV-1 transmission. Sci Transl Med 3: 77ra29. doi:10.1126/scitranslmed.3001888 - DOI - PMC - PubMed
    1. Houzet L, Matusali G, Dejucq-Rainsford N. 2014. Origins of HIV-infected leukocytes and virions in semen. J Infect Dis 210:S622–S630. doi:10.1093/infdis/jiu328 - DOI - PubMed
    1. Dyer JR, Eron JJ, Hoffman IF, Kazembe P, Vernazza PL, Nkata E, Costello Daly C, Fiscus SA, Cohen MS. 1998. Association of CD4 cell depletion and elevated blood and seminal plasma human immunodeficiency virus type 1 (HIV-1) RNA concentrations with genital ulcer disease in HIV-1-infected men in Malawi. J Infect Dis 177:224–227. doi:10.1086/517359 - DOI - PubMed
    1. Ward H, Rönn M. 2010. Contribution of sexually transmitted infections to the sexual transmission of HIV. Curr Opin HIV AIDS 5:305–310. doi:10.1097/COH.0b013e32833a8844 - DOI - PMC - PubMed

Publication types