. 2023 Jun 9;14(1):3427.
doi: 10.1038/s41467-023-38923-6.

Muscleblind-like proteins use modular domains to localize RNAs by riding kinesins and docking to membranes

Affiliations

Muscleblind-like proteins use modular domains to localize RNAs by riding kinesins and docking to membranes

Ryan P Hildebrandt et al. Nat Commun. .

Abstract

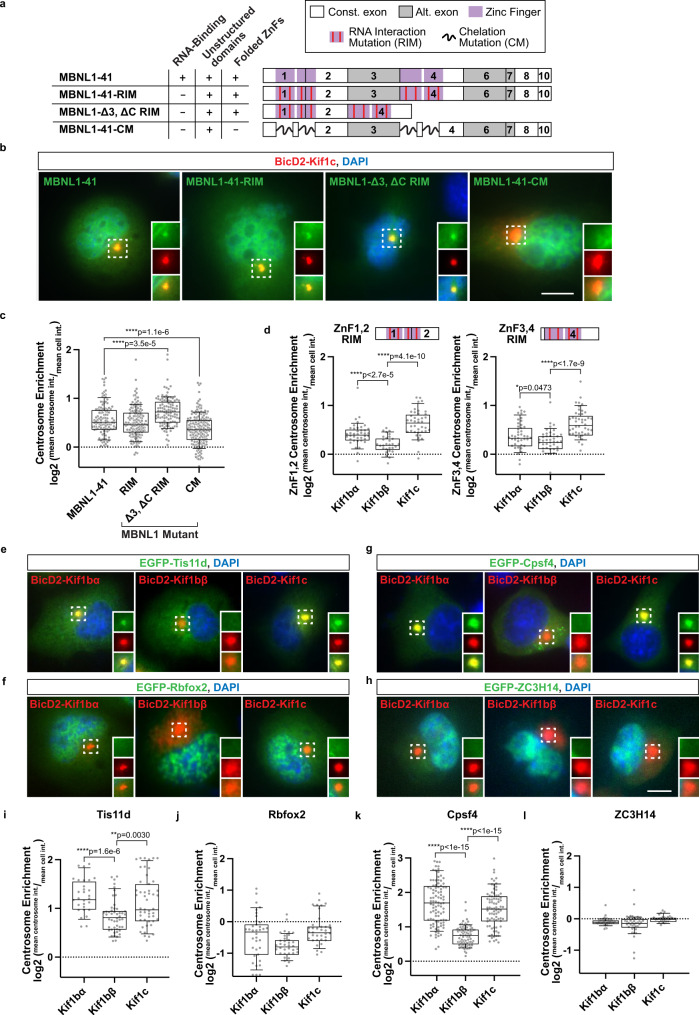
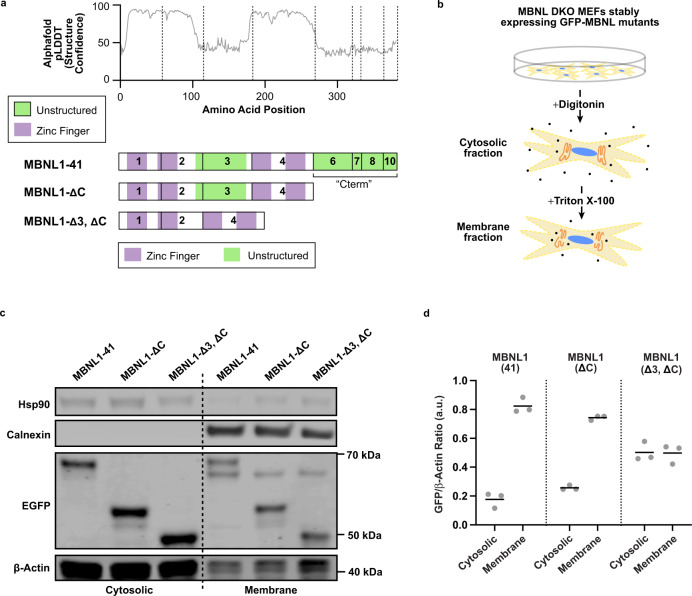
RNA binding proteins (RBPs) act as critical facilitators of spatially regulated gene expression. Muscleblind-like (MBNL) proteins, implicated in myotonic dystrophy and cancer, localize RNAs to myoblast membranes and neurites through unknown mechanisms. We find that MBNL forms motile and anchored granules in neurons and myoblasts, and selectively associates with kinesins Kif1bα and Kif1c through its zinc finger (ZnF) domains. Other RBPs with similar ZnFs associate with these kinesins, implicating a motor-RBP specificity code. MBNL and kinesin perturbation leads to widespread mRNA mis-localization, including depletion of Nucleolin transcripts from neurites. Live cell imaging and fractionation reveal that the unstructured carboxy-terminal tail of MBNL1 allows for anchoring at membranes. An approach, termed RBP Module Recruitment and Imaging (RBP-MRI), reconstitutes kinesin- and membrane-recruitment functions using MBNL-MS2 coat protein fusions. Our findings decouple kinesin association, RNA binding, and membrane anchoring functions of MBNL while establishing general strategies for studying multi-functional, modular domains of RBPs.


Conflict of interest statement

The authors declare no competing interests.

Figures

Fig. 1
Fig. 1. Cytoplasmic MBNL1 granules exhibit directed motion in neurons and anchoring in C2C12 myoblasts.
a Exon and protein domain structure of MBNL1, and (b), isoforms studied. c Representative image showing MBNL1 granules (white) in axons (Tau, red) and dendrites (Map2, green) of 9 DIV cultured primary mouse cortical neurons; nuclei (blue) labeled with DAPI. Scale bar = 10 µm. d (Above) Representative images of EGFP-MBNL1 40, 41, 42, and 43 kDa isoforms (white) in 8 DIV cultured primary mouse cortical neurons; nuclei (blue) labeled with DAPI, axons and dendrites labeled with Tau (red) and Map2 (green), respectively. Scale bar = 10 µm. (Below) Representative time lapse images of motile EGFP-MBNL1 40 kDa and 41 kDa granules in live mouse cortical neurons. Time (sec) indicated in top right. Scale bars = 10 µm. e Quantitation of speeds and distances traveled by cytoplasmic MBNL1 granules (MBNL1–40 kDa − 36 tracks, 1.57 tracks/cell; MBNL1–41 kDa − 71 tracks, 2.37 tracks/cell) in primary mouse cortical neurons. Dotted line in velocity chart represents typical speed of microtubule-dependent transport. Track data come from 3 biological replicates. f (Above) Representative images of EGFP-MBNL1 40, 41, 42, and 43 kDa in C2C12 myoblasts. Dotted lines outline cell boundaries. (Below) Representative time lapse images of anchored GFP-MBNL1 40 kDa and 41 kDa granules in C2C12 myoblasts. Time (sec) indicated in top right. Scale bars = 5 µm.
Fig. 2
Fig. 2. MBNL1 associates, co-transports, and co-immunoprecipitates with Kif1bα and Kif1c.
a Split kinesin recruitment assay used to identify MBNL1-kinesin associations. Cargoes are recruited in a retrograde or anterograde direction in a rapalog-dependent manner, depending on choice of motor complex. b Representative images showing recruitment of EGFP-MBNL1 (green) to the centrosome by Kif1bα, but not Kif1bβ, using Myc-tagged, FRB-kinesin tail fusions (blue) co-expressed with BicD2-FKBP or KIF1A motor-FKBP (red) in N2A cells. Scale bar = 10 µm. c A modified kinesin recruitment assay that uses BicD2-kinesin tail fusions to further characterize MBNL1-kinesin associations. d Representative images and quantitation in N2A cells of EGFP-MBNL1 (green) at the centrosome when co-expressed with BicD2-kinesin tail fusions (red); nuclei (blue) labeled with DAPI; Kif1bα: n = 93 cells (50, 20, and 23 cells in each replicate), Kif1bβ: n = 81 cells (25, 16, and 40 cells in each replicate), Kif1c: n = 112 cells (53, 19, and 40 cells in each replicate); across 3 biological replicates. Scale bar = 10 µm. Bars represent median, box outlines represent upper and lower quartiles, whiskers represent 10th and 90th percentiles. Dotted line represents no enrichment. ****p < 0.0001 by two-tailed Mann–Whitney U test. e Representative dual color time lapse images of EGFP-MBNL1 (green) and mScarlet-I-kinesins (red) in live 8 DIV primary mouse cortical neurons. Arrows denote co-transported, anterograde particles of MBNL with Kif1bα (left) and Kif1c (right), whereas Kif1bβ particles lack MBNL (center); time (sec) indicated in top or bottom right. Scale bar = 5 µm. Kymographs are displayed below still frames obtained from movies. White arrows denote co-transport events. Anterograde transport is shown from left to right. Scale bar = 10 µm. f Fraction of mScarlet-I-kinesin granules showing co-transport with EGFP-MBNL1; across 4 biological replicates. Bars represent mean. *p < 0.05, **p < 0.01 by one-way ANOVA with Tukey’s post-hoc test. g Western blots against RFP, MBNL1, and GAPDH following co-immunoprecipitation of mScarlet-Kif fusions with quantitation normalized to input MBNL1-EGFP protein; across 3 biological replicates. Lysates were collected after transient expression in N2A cells. Bars denote mean. **p < 0.01, ***<0.001 by one-way ANOVA with Tukey’s post-hoc test. Source data provided as a source data file.
Fig. 3
Fig. 3. Depletion of MBNL or expression of kinesin tails leads to mis-localization of RNA targets.
a Experimental design used to deplete MBNLs or over-express kinesin tail dominant negatives in differentiated N2A cells, followed by fractionation of soma and neurites. b Bars showing change in localization of mRNAs from neurite to soma in N2A expressing CTG480 as compared to CTG0, as a function of CLIP tag density per kilobase of 5′ and 3′ UTR. *p < 0.01, **p < 0.005 by two-tailed rank-sum test. Data represented as median values ± SEM. Data comes from one biological replicate. c Venn diagram showing overlap of mRNA targets mis-localized from neurite to soma upon perturbation by CTG480 relative to CTG0 or Kif1bα/Kif1c tails relative to Kif1bβ tail. P values computed by two-tailed Fisher’s Exact test, and enrichment of overlap was computed assuming independence between conditions. d The ratio of nucleolin mRNA between neurite and soma across conditions, as assessed by RNAseq. e Distances of Ncl and Gapdh HCR FISH spots from the soma of each cell across conditions. Distances were normalized as a fraction of total neurite length, and the 95th percentile of distances within each cell is plotted as an individual gray circle. Each cell (Ncl - CTG0: n = 8 cells, CTG480: n = 8 cells, Kif1bβ: n = 9 cells, Kif1bα: n = 9 cells, Kif1c: n = 10 cells; Gapdh - CTG0: n = 8 cells, CTG480: n = 9 cells, Kif1bβ: n = 9 cells, Kif1bα: n = 8 cells, Kif1c: n = 8 cells; across 3 biological replicates) contained >150 Ncl spots and >300 Gapdh spots. Bars represent the median across cells. *p < 0.05, **p < 0.01 by two-tailed Mann–Whitney U test. f Representative HCR FISH images for Ncl and Gapdh (red) with CTG repeats or dominant negative kinesin tails (green) in differentiated N2A cells. Scale bar = 10 µm. Source data provided as a source data file.
Fig. 4
Fig. 4. Zinc fingers of MBNL1 are necessary and sufficient to associate with kinesins in an RNA binding-independent manner, and structurally similar zinc fingers in other RBPs associate with the same kinesins.
a Schematic of EGFP-MBNL1 mutants tested. b Representative images of centrosome enrichment for each mutant (green) as tested with BicD2-Kif1c tail fusions (red) in N2A cells. Nuclei labeled with DAPI (blue). c Quantitation of centrosome enrichment for each mutant. MBNL1-41: n = 112 cells (53, 19, and 40 cells in each replicate), MBNL1-41-RIM: n = 146 cells, MBNL1-Δ3, ΔC RIM: n = 106 cells, MBNL1-41-CM: n = 182 cells. d Quantitation of centrosome enrichment for EGFP-ZnF1/2 RIM and EGFP-ZnF3/4 RIM mutants using BicD2 kinesin tail fusions. MBNL1-ZnF1,2 RIM - Kif1bα: n = 39 cells, Kif1bβ: n = 29 cells, Kif1c: n = 40 cells; MBNL1-ZnF3,4 RIM - Kif1bα: n = 42 cells, Kif1bβ: n = 39 cells, Kif1c: n = 44 cells. e Representative images of centrosome enrichment for Tis11d (green); f Rbfox2 (green); g Cpsf4 (green); and (h) ZC3H14 (green) with BicD2 kinesin tail fusions (red) in N2A cells. i Centrosome enrichment quantitation for Tis11d - Kif1bα: n = 29 cells, Kif1bβ: n = 49 cells, Kif1c: n = 49 cells; and (j), Rbfox2 - Kif1bα: n = 36 cells, Kif1bβ: n = 35 cells, Kif1c: n = 36 cells; and (k), Cpsf4 - Kif1bα: n = 95 cells, Kif1bβ: n = 88 cells, Kif1c: n = 81 cells; and (l), ZC3H14 - Kif1bα: n = 43 cells, Kif1bβ: n = 40 cells, Kif1c: n = 25 cells. Bars represent median, box outline represent upper and lower quartiles, whiskers represent 10th and 90th percentiles. Dotted line represents no enrichment (=1). Scale bars = 5 µm. ****p < 0.0001, **p < 0.01, *p < 0.05 by two-tailed Mann–Whitney U test. Nuclei labeled with DAPI (blue). All experiments performed across 3 biological replicates. Source data provided as a source data file.
Fig. 5
Fig. 5. Unstructured domains of MBNL1 confer membrane association properties.
a Structure confidence as assessed by Alphafold for the 41 kDa isoform of MBNL1; this metric is aligned to the exon structure below, and additional MBNL1 mutants which lack exon 3 and/or the C-terminal tail are also illustrated. b Schematic of detergent-based subcellular fractionation approach in Mbnl1/2 double knockout mouse embryonic fibroblasts. c Representative Western blot of EGFP-MBNL1 mutants following subcellular fractionation of cytosolic and membrane-associated compartments. Hsp90 shows enrichment in the cytosolic fraction; Calnexin the membrane fraction. d Quantitation of EGFP-MBNL1 concentration in each compartment as normalized to β-actin loading control, across 3 biological replicates. Source data provided as a source data file.
Fig. 6
Fig. 6. Heterologous reconstitution of domains from MBNL to localize RNAs in a kinesin- or membrane anchoring-dependent manner.
a MS2 reporter system used to image single RNA molecules and reconstitute activities of MBNL domains to localize RNAs by fusion to MCP-Halo. Fusions generated include full-length MBNL1 or truncated MBNL1 without C-terminal tail and/or exon 3; ZnFs in these contexts were all RIM mutants incapable of binding RNA. b Particle tracks (multi-colored) from C2C12 myoblasts stably expressing MCP-Halo-RIM, MCP-Halo-ΔC RIM, or MCP-Halo-Δ3, ΔC RIM. c Inferred ensemble log diffusion coefficients (µm2/s) and maximum distance (µm) traveled for particles in each condition; MCP-Halo-RIM: 1233 particle tracks, MCP-Halo-ΔC RIM: 1039 particle tracks, MCP-Halo-Δ3, ΔC RIM: 934 particle tracks. Median per cell log diffusion coefficients (µm2/s) and maximum distance travelled for each particle (µm); n = 11 cells per condition across 3 biological replicates. d Schematic and particle tracks (multi-colored) from movies of C2C12 myoblasts stably expressing MCP-Halo or MCP-Halo-Cterm. e Inferred ensemble log diffusion coefficients (µm2/s) and maximum distance (µm) traveled for particles in each condition; MCP-Halo: 1205 particle tracks, MCP-Halo-Cterm: 885 particle tracks. Median per cell log diffusion coefficients (µm2/s) and maximum distance (µm); n = 16 cells per condition across 3 biological replicates. f Enrichment of MS2 reporter mRNA as assessed by RT-qPCR from membrane and cytosolic fractions of C2C12 myoblasts in the presence of MCP-Halo or MCP-Halo-Cterm, n = 5 biological replicates for each condition. g Schematic of MS2 reporter system used to reconstitute kinesin-dependent transport of RNA via MBNL1 zinc fingers. h Representative images from C2C12 myoblasts of HCR FISH (red) against the MS2 mRNA reporter in the presence of BicD2-Kif1c (green) and Halo-MCP fusions. Nuclei labeled with DAPI (blue). i Quantitation of the fraction of SunTag-MS2 RNA molecules present at the centrosome relative to the whole cell across each condition. Scale bars = 5 µm. *p < 0.05, **p < 0.01, ***p < 0.001 by two-tailed Mann–Whitney U test. Source data provided as a source data file.
Fig. 7
Fig. 7. MBNL1 regulates the production of kinesin tails with which it associates in the cytoplasm.
a Representation of alternative last exon usage in the KIF1B gene, which yields two isoforms. b Proportion of Kif1bα vs. total Kif1b in Mbnl1/2 double knockout mouse embryonic fibroblasts and (c), KIF1Bα vs. total KIF1B in human DM1 tibialis. d Model for how MBNLs regulate production of kinesin tails with which they associate in the cytoplasm to travel along microtubules and anchor at membrane destinations.

Similar articles

Cited by

References

    1. Martin KC, Ephrussi A. mRNA Localization: Gene Expression in the Spatial Dimension. Cell. 2009;136:719–730. doi: 10.1016/j.cell.2009.01.044. - DOI - PMC - PubMed
    1. Donlin-Asp PG, Rossoll W, Bassell GJ. Spatially and temporally regulating translation via mRNA-binding proteins in cellular and neuronal function. FEBS Lett. 2017;591:1508–1525. doi: 10.1002/1873-3468.12621. - DOI - PubMed
    1. Kiebler MA, Bassell GJ. Neuronal RNA Granules: Movers and Makers. Neuron. 2006;51:685–690. doi: 10.1016/j.neuron.2006.08.021. - DOI - PubMed
    1. Kanai Y, Dohmae N, Hirokawa N. Kinesin Transports RNA: Isolation and Characterization of an RNA-Transporting Granule. Neuron. 2004;43:513–525. doi: 10.1016/j.neuron.2004.07.022. - DOI - PubMed
    1. Hüttelmaier S, et al. Spatial regulation of β-actin translation by Src-dependent phosphorylation of ZBP1. Nature. 2005;438:512–515. doi: 10.1038/nature04115. - DOI - PubMed

Publication types