[Preprint]. 2023 May 25:2023.05.25.542276.
doi: 10.1101/2023.05.25.542276.

MRT-ModSeq - Rapid detection of RNA modifications with MarathonRT

Affiliations

MRT-ModSeq - Rapid detection of RNA modifications with MarathonRT

Rafael de Cesaris Araujo Tavares et al. bioRxiv. .

Update in

Abstract

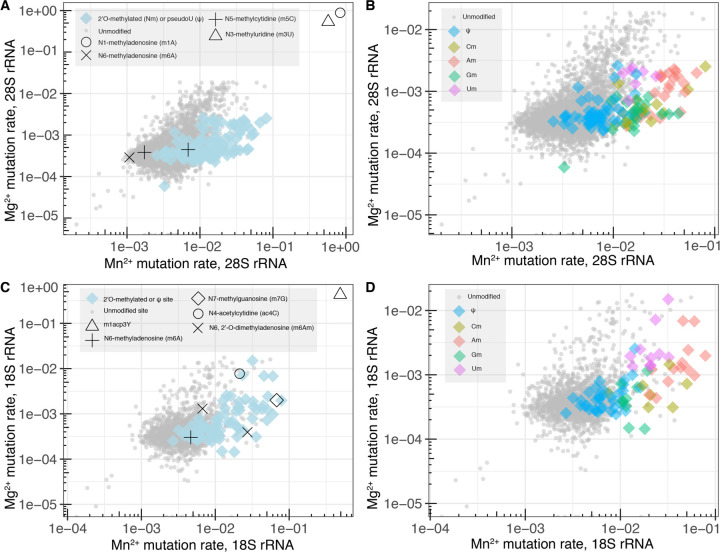
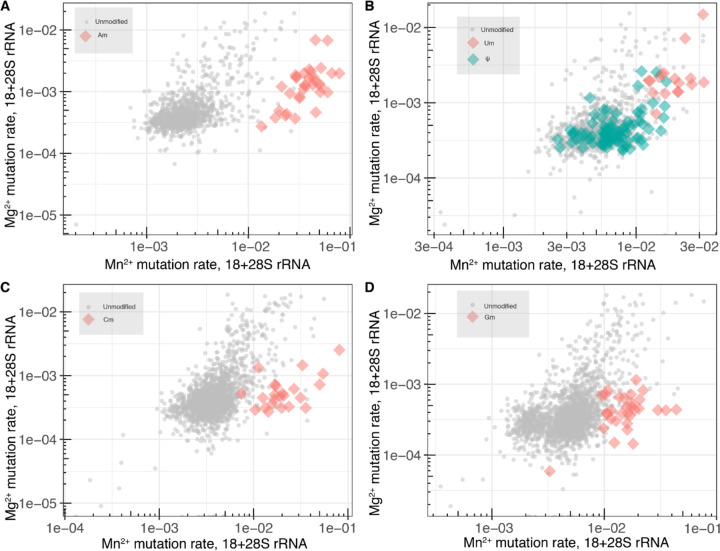
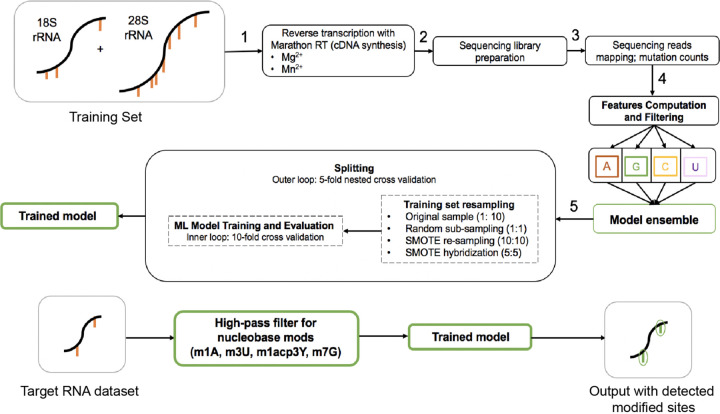
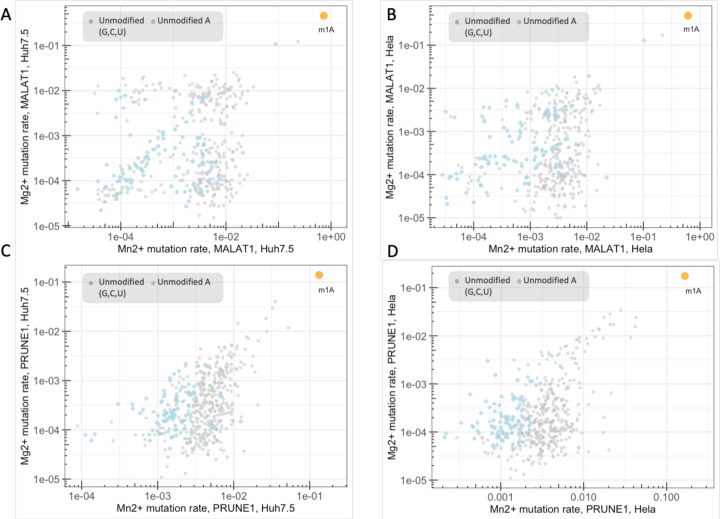
Chemical modifications are essential regulatory elements that modulate the behavior and function of cellular RNAs. Despite recent advances in sequencing-based RNA modification mapping, methods combining accuracy and speed are still lacking. Here, we introduce MRT- ModSeq for rapid, simultaneous detection of multiple RNA modifications using MarathonRT. MRT-ModSeq employs distinct divalent cofactors to generate 2-D mutational profiles that are highly dependent on nucleotide identity and modification type. As a proof of concept, we use the MRT fingerprints of well-studied rRNAs to implement a general workflow for detecting RNA modifications. MRT-ModSeq rapidly detects positions of diverse modifications across a RNA transcript, enabling assignment of m1acp3Y, m1A, m3U, m7G and 2'-OMe locations through mutation-rate filtering and machine learning. m1A sites in sparsely modified targets, such as MALAT1 and PRUNE1 could also be detected. MRT-ModSeq can be trained on natural and synthetic transcripts to expedite detection of diverse RNA modification subtypes across targets of interest.


Conflict of interest statement

DECLARATION OF INTERESTS

The authors declare no competing interests.

Figures

Figure 1.
Figure 1.
2-D mutational profiles obtained with MRT in the presence of Mg or Mn for human 18S and 28S rRNAs. (A) Log-scale plot of Mg (y-axis) and Mn (x-axis) mutation rates obtained with MRT for the human 28S rRNA. Each group of nucleotides (unmodified and different types of modified) are represented by different symbols as indicated in the legend. (B) Version of (A) plot including only Nm and ψ modifications, in addition to unmodified sites. Different types of Nm are indicated by different colors, according to the legend. (C) Log-scale plot of Mg (y-axis) and Mn (x-axis) mutation rates obtained with MRT for the human 18S rRNA. Each group of nucleotides (unmodified and different types of modified) are represented by different symbols as indicated in the left-hand legend. (D) Version of (C) plot including only Nm and ψ modifications, in addition to unmodified sites. Different types of Nm are indicated by different colors, according to the legend.
Figure 2.
Figure 2.
Combined 2-D mutational profiles obtained with MRT in the presence of Mg or Mn showing data for both 18S and 28S rRNAs. (A) Log-scale plot of Mg (y-axis) and Mn (x-axis) mutation rates obtained with MRT for the combined 18S/28S dataset showing Am (orange) and unmodified A (grey) sites, only. (B) Log-scale plot of Mg (y-axis) and Mn (x-axis) mutation rates obtained with MRT for the combined 18S/28S dataset showing Um (orange), ψ (green) and unmodified U (grey) sites, only. (C) Log-scale plot of Mg (y-axis) and Mn (x-axis) mutation rates obtained with MRT for the combined 18S/28S dataset showing Cm (orange) and unmodified C (grey) sites, only. (D) Log-scale plot of Mg (y-axis) and Mn (x-axis) mutation rates obtained with MRT for the combined 18S/28S dataset showing Gm (orange) and unmodified G (grey) sites, only.
Figure 3.
Figure 3.
Marginal mutation rate analysis of the combined 18S/28S rRNA dataset. (A) Box and whiskers plot of marginal (scaled) mutation rates calculated from the Mg sample (upper graph) and Mn sample (lower graph) for adenosine sites. Unmodified A sites are represented in red and Am sites are in blue. (B) Box and whiskers plot of marginal (scaled) mutation rates calculated from the Mg sample (upper graph) and Mn sample (lower graph) for cytosine sites. Unmodified C sites are represented in red and Cm sites are in blue. (C) Box and whiskers plot of marginal (scaled) mutation rates calculated from the Mg sample (upper graph) and Mn sample (lower graph) for guanosine sites. Unmodified G sites are represented in red and Gm sites are in blue. (D) Box and whiskers plot of marginal (scaled) mutation rates calculated from the Mg sample (upper graph) and Mn sample (lower graph) for uridine sites. Unmodified U sites are represented in red, pU (ψ) sites are in grey and Um sites are in blue.
Figure 4.
Figure 4.
Sequence context analysis of manganese (Mn) mutational signatures of Nm and ψ sites in the combined 18S/28S rRNA dataset. The results are sorted by modified nucleotide type (columns) and by the penultimate nucleotide in the RNA sequence, i.e., the nucleotide immediately 3’ to the position being examined. Each individual plot shows the distribution of marginal (scaled) mutation rates calculated from the Mn sample as a function of the different groups of mutated nucleotides (e.g., the top graph in the Am column shows marginal mutation rates from A to each one of the 4 nucleotides: A to A (no mutation), A to C, A to G, A to U).
Figure 5.
Figure 5.
MRT-ModSeq workflow. The scheme illustrates the pipeline using human 18S and 28S rRNAs to obtain training datasets by (step 1) carrying out the RT reaction separately in the presence of either Mg or Mn. The resulting cDNA is used to (step 2) prepare sequencing libraries; the sequencing reads obtained are used to count mutations at each nucleotide position (step 3), which is followed by filtering out poorly covered positions and computing nucleotide changes (features) and partitioning the dataset into four different groups that compose the model ensemble (step 4). Training (step 5) is carried out by benchmarking different ML algorithms in a nested cross-validation routine where the best performing algorithms are chosen for each class to generate the final trained model (step 6). The diagram in the bottom shows the MRT-ModSeq workflow for detection of modified sites in a target RNA.
Figure 6.
Figure 6.
MRT-Modseq successfully captures known m1A sites in non-rRNA targets. (A) Log-scale plot of Mg (y-axis) and Mn (x-axis) mutation rates obtained with MRT for MALAT1 in Huh7.5 cells. Different symbols represent each group of nucleotides (unmodified A or unmodified G, C, U) as indicated in the legend. The known m1A site is represented by a yellow dot and is labelled below. (B) Log-scale plot of Mg (y-axis) and Mn (x-axis) mutation rates obtained with MRT for MALAT1 in Hela cells, labelled as in (A). (C) Log-scale plot of Mg (y-axis) and Mn (x-axis) mutation rates obtained with MRT for PRUNE1 in Huh7.5 cells, labelled as in (A). (D) Log-scale plot of Mg (y-axis) and Mn (x-axis) mutation rates obtained with MRT for PRUNE1 in Hela cells, labelled as in (A).

Similar articles

References

    1. Barbieri I., and Kouzarides T. (2020). Role of RNA modifications in cancer. Nat Rev Cancer 20, 303–322. 10.1038/s41568-020-0253-2. - DOI - PubMed
    1. Begik O., Lucas M.C., Pryszcz L.P., Ramirez J.M., Medina R., Milenkovic I., Cruciani S., Liu H., Vieira H.G.S., Sas-Chen A., et al. (2021). Quantitative profiling of pseudouridylation dynamics in native RNAs with nanopore sequencing. Nat Biotechnol 39, 1278–1291. 10.1038/s41587-021-00915-6. - DOI - PubMed
    1. Benson D.A., Cavanaugh M., Clark K., Karsch-Mizrachi I., Lipman D.J., Ostell J., and Sayers E.W. (2013). GenBank. Nucleic Acids Res 41, D36–42. 10.1093/nar/gks1195. - DOI - PMC - PubMed
    1. Blagus R., and Lusa L. (2013). SMOTE for high-dimensional class-imbalanced data. BMC Bioinformatics 14, 106. 10.1186/1471-2105-14-106. - DOI - PMC - PubMed
    1. Blanco S., Bandiera R., Popis M., Hussain S., Lombard P., Aleksic J., Sajini A., Tanna H., Cortes-Garrido R., Gkatza N., et al. (2016). Stem cell function and stress response are controlled by protein synthesis. Nature 534, 335–340. 10.1038/nature18282. - DOI - PMC - PubMed

Publication types