

Elevated atmospheric CO2 concentration triggers redistribution of nitrogen to promote tillering in rice
- PMID: 37283862
- PMCID: PMC10168068
- DOI: 10.1002/pei3.10046
Elevated atmospheric CO2 concentration triggers redistribution of nitrogen to promote tillering in rice
Abstract
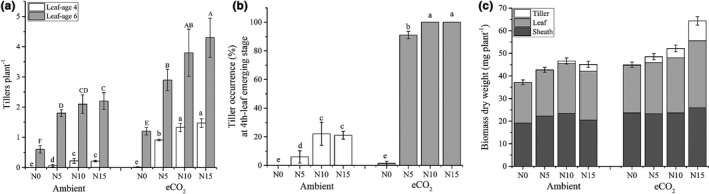
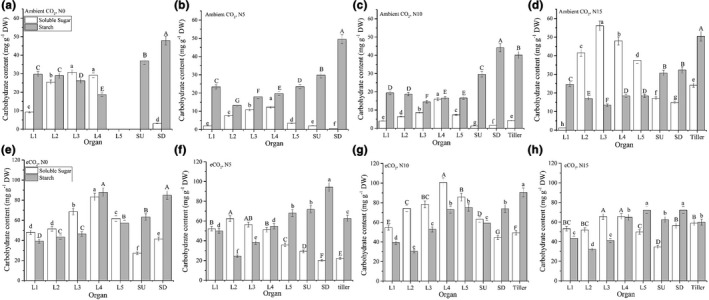
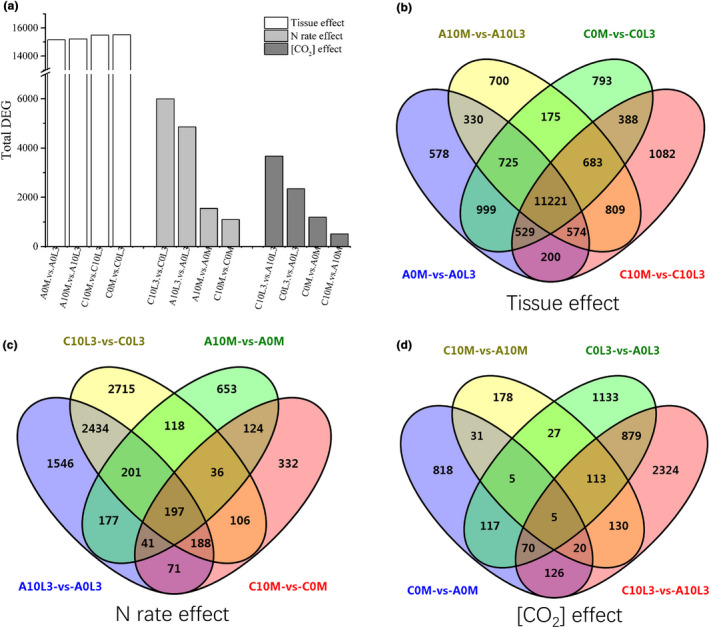
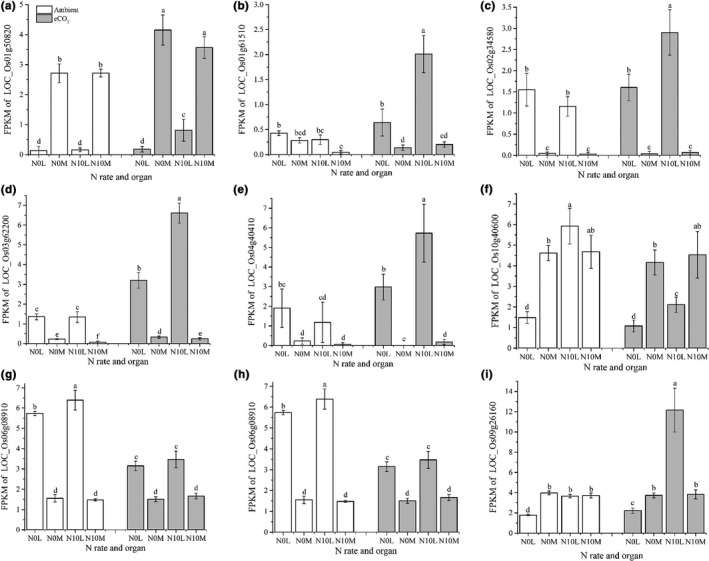
Elevated atmospheric CO2 concentration (eCO2) often reduces nitrogen (N) content in rice plants and stimulates tillering. However, there is a general consensus that reduced N would constrain rice tillering. To resolve this contradiction, we investigated N distribution and transcriptomic changes in different rice plant organs after subjecting them to eCO2 and different N application rates. Our results showed that eCO2 significantly promoted rice tillers (by 0.6, 1.1, 1.7, and 2.1 tillers/plant at 0, 75, 150, and 225 kg N ha-1 N application rates, respectively) and more tillers were produced under higher N application rates, confirming that N availability constrained tillering in the early stages of growth. Although N content declined in the leaves (-11.0 to -20.7 mg g-1) and sheaths (-9.8 to -28.8 mg g-1) of rice plants exposed to eCO2, the N content of newly emerged tillers on plants exposed to eCO2 equaled or exceeded the N content of tillers produced under ambient CO2 conditions. Apparently, the redistribution of N within the plant per se was a critical adaptation strategy to the eCO2 condition. Transcriptomic analysis revealed that eCO2 induced less extensive alteration of gene expression than did N application. Most importantly, the expression levels of multiple N-related transporters and receptors such as nitrate transporter NRT2.3a/b and NRT1.1a/b were differentially regulated in leaf and shoot apical meristem, suggesting that multiple genes were involved in sensing the N signal and transporting N metabolites to adapt to eCO2. The redistribution of N in different organs could be a universal adaptation strategy of terrestrial plants to eCO2.
Keywords: atmospheric CO2; distribution; gene expression; nitrogen; rice; tiller.
© 2021 The Authors. Plant‐Environment Interactions Published by John Wiley & Sons Ltd and New Phytologist Foundation.
Conflict of interest statement
5All authors have no conflict of interest to declare.
Figures

Similar articles
-
Elevated CO2 Priming as a Sustainable Approach to Increasing Rice Tiller Number and Yield Potential.Rice (N Y). 2023 Mar 22;16(1):16. doi: 10.1186/s12284-023-00629-0. Rice (N Y). 2023. PMID: 36947269 Free PMC article.
-
Elevated Atmospheric CO2 and Nitrogen Fertilization Affect the Abundance and Community Structure of Rice Root-Associated Nitrogen-Fixing Bacteria.Front Microbiol. 2021 Apr 21;12:628108. doi: 10.3389/fmicb.2021.628108. eCollection 2021. Front Microbiol. 2021. PMID: 33967976 Free PMC article.
-
Interactive Effects of [CO2] and Temperature on Plant Chemistry of Transgenic Bt Rice and Population Dynamics of a Non-Target Planthopper, Nilaparvata lugens (Stål) under Different Levels of Soil Nitrogen.Toxins (Basel). 2019 May 8;11(5):261. doi: 10.3390/toxins11050261. Toxins (Basel). 2019. PMID: 31072035 Free PMC article.
-
A meta-analysis of the combined effects of elevated carbon dioxide and chronic warming on plant %N, protein content and N-uptake rate.AoB Plants. 2021 May 25;13(4):plab031. doi: 10.1093/aobpla/plab031. eCollection 2021 Aug. AoB Plants. 2021. PMID: 34285792 Free PMC article. Review.
-
Effects of water deficit stress on agronomic and physiological responses of rice and greenhouse gas emission from rice soil under elevated atmospheric CO2.Sci Total Environ. 2019 Feb 10;650(Pt 2):2032-2050. doi: 10.1016/j.scitotenv.2018.09.332. Epub 2018 Sep 29. Sci Total Environ. 2019. PMID: 30290346 Review.
Cited by
-
Elevated CO2 Priming as a Sustainable Approach to Increasing Rice Tiller Number and Yield Potential.Rice (N Y). 2023 Mar 22;16(1):16. doi: 10.1186/s12284-023-00629-0. Rice (N Y). 2023. PMID: 36947269 Free PMC article.
-
Validation of Novel Reference Genes in Different Rice Plant Tissues through Mining RNA-Seq Datasets.Plants (Basel). 2023 Nov 23;12(23):3946. doi: 10.3390/plants12233946. Plants (Basel). 2023. PMID: 38068583 Free PMC article.
References
-
- Ainsworth, E. A. (2008). Rice production in a changing climate: A meta‐analysis of responses to elevated carbon dioxide and elevated ozone concentration. Global Change Biology, 14, 1642–1650. 10.1111/j.1365-2486.2008.01594.x. - DOI
-
- Andrews, M. , Condron, L. M. , Kemp, P. D. , Topping, J. F. , Lindsey, K. , Hodge, S. , & Raven, J. A. (2019). Elevated CO2 effects on nitrogen assimilation and growth of C3 vascular plants are similar regardless of N‐form assimilated. Journal of Experimental Botany, 70(2), 683–690. 10.1093/jxb/ery371. - DOI - PubMed
LinkOut - more resources
Full Text Sources
Research Materials