. 2023 Aug;10(23):e2300469.
doi: 10.1002/advs.202300469. Epub 2023 Jun 4.

Thermoresponsive Polypeptide Fused L-Asparaginase with Mitigated Immunogenicity and Enhanced Efficacy in Treating Hematologic Malignancies

Affiliations

Thermoresponsive Polypeptide Fused L-Asparaginase with Mitigated Immunogenicity and Enhanced Efficacy in Treating Hematologic Malignancies

Sanke Zhang et al. Adv Sci (Weinh). 2023 Aug.

Abstract

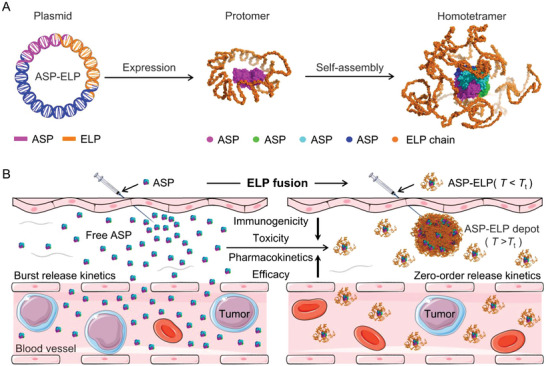
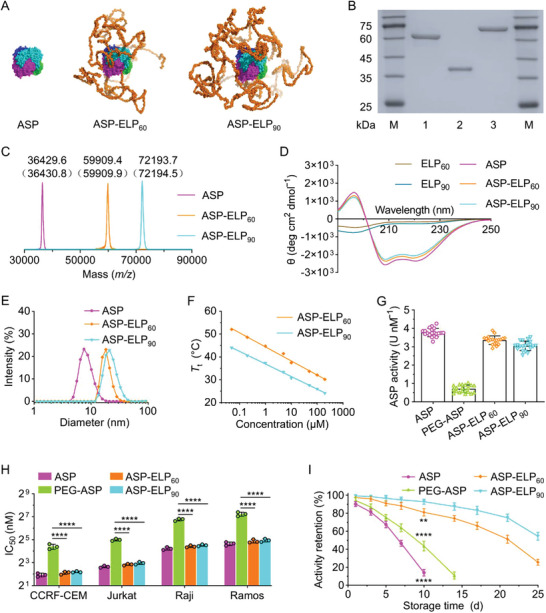
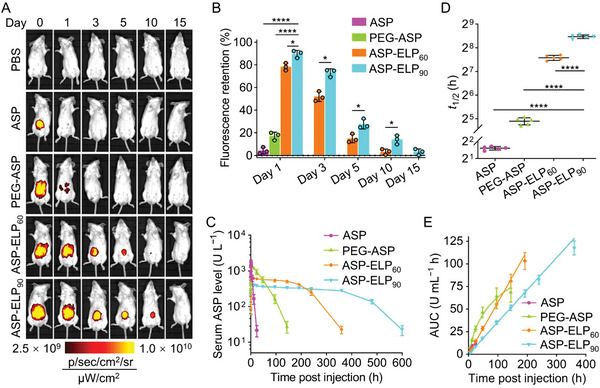
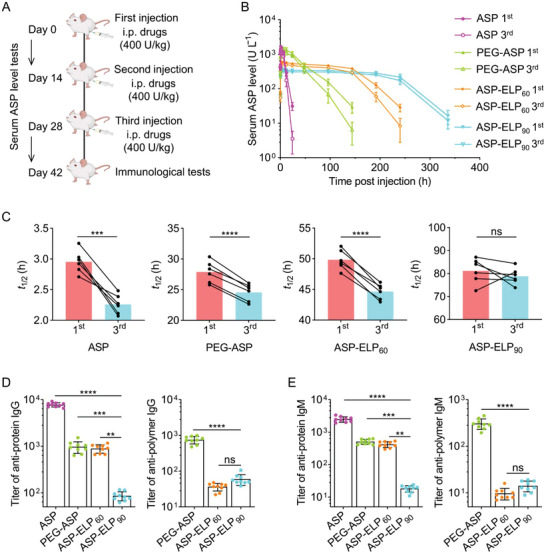
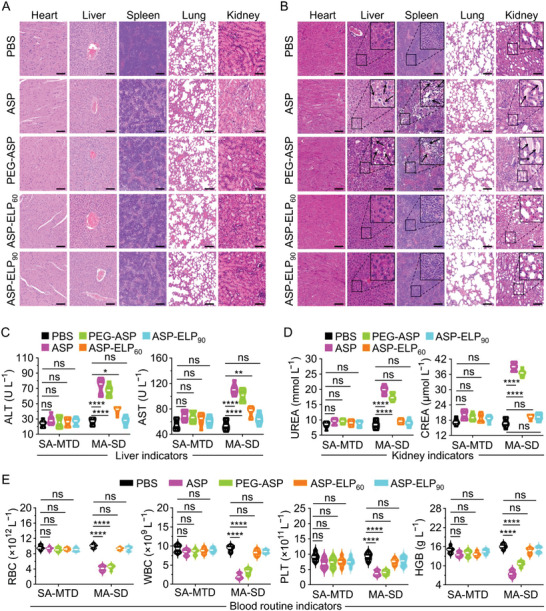
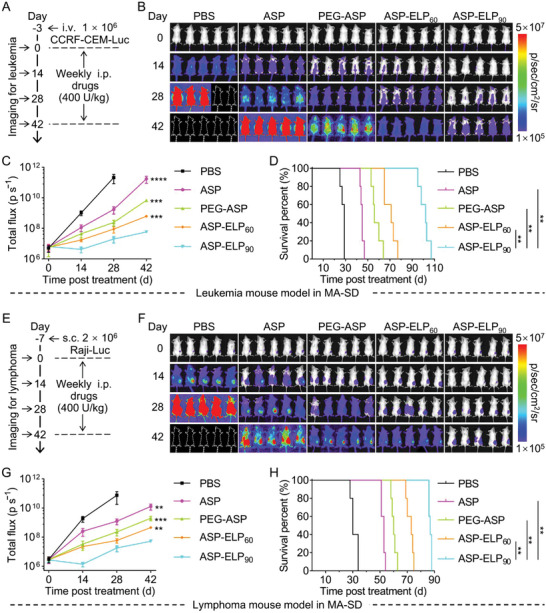
L-Asparaginase (ASP) is well-known for its excellent efficacy in treating hematological malignancies. Unfortunately, the intrinsic shortcomings of ASP, namely high immunogenicity, severe toxicity, short half-life, and poor stability, restrict its clinical usage. Poly(ethylene glycol) conjugation (PEGylation) of ASP is an effective strategy to address these issues, but it is not ideal in clinical applications due to complex chemical synthesis procedures, reduced ASP activity after conjugation, and pre-existing anti-PEG antibodies in humans. Herein, the authors genetically engineered an elastin-like polypeptide (ELP)-fused ASP (ASP-ELP), a core-shell structured tetramer predicted by AlphaFold2, to overcome the limitations of ASP and PEG-ASP. Notably, the unique thermosensitivity of ASP-ELP enables the in situ formation of a sustained-release depot post-injection with zero-order release kinetics over a long time. The in vitro and in vivo studies reveal that ASP-ELP possesses increased activity retention, improved stability, extended half-life, mitigated immunogenicity, reduced toxicity, and enhanced efficacy compared to ASP and PEG-ASP. Indeed, ASP-ELP treatment in leukemia or lymphoma mouse models of cell line-derived xenograft (CDX) shows potent anti-cancer effects with significantly prolonged survival. The findings also indicate that artificial intelligence (AI)-assisted genetic engineering is instructive in designing protein-polypeptide conjugates and may pave the way to develop next-generation biologics to enhance cancer treatment.

Keywords: L-asparaginase; artificial intelligence; elastin-like polypeptide; hematological malignancies; immunogenicity.


Conflict of interest statement

The authors declare no conflict of interest.

Figures

Figure 1
Figure 1
Schematic illustration of AI‐assisted design of a core‐shell structured tetramer of ASP‐ELP for treating hematological malignancies. A) Biosynthesis and structural prediction of ASP‐ELP. The ASP fragment was genetically fused to the N‐terminal of ELP to construct the ASP‐ELP plasmid, followed by overexpression in Escherichia coli (E coli). The homotetrameric complex structure was obtained using AlphaFold2 to predict the interaction between ASP‐ELP and ASP‐ELP. The ELP chains are wrapped around ASP's tetrameric surface to form a core‐shell structure that masks ASP's antigenic epitopes, which confers ASP‐ELP low immunogenicity and high stability. B) The unique thermosensitivity of ASP‐ELP makes it feasible to form a sustained release depot in situ with zero‐order release kinetics post‐injection, resulting in increased MTD, enhanced pharmacokinetics, mitigated immunogenicity, improved efficacy, and reduced toxicity. Conversely, the instantaneous distribution of highly immunogenic ASP into the systemic circulation system generates high‐concentration ASP that induces immunotoxicity and dose‐related toxicity, leading to poor pharmacokinetics and efficacy.
Figure 2
Figure 2
In vitro characterization of ASP‐ELPs. A) The predicted structures of the homotetrameric complexes were obtained by analyzing the interactions among ASP, ASP‐ELP60, and ASP‐ELP90 molecules by AlphaFold2. The ELP90 chains are more intensively wrapped around the ASP tetramer surface than the ELP60 chains. B) SDS‐PAGE confirmed the purity of ASP and ASP‐ELPs. Lane 1, ASP‐ELP60; lane 2, ASP; lane 3, ASP‐ELP90; lane M, Marker. C) The experimental molecular masses of ASP and ASP‐ELPs measured by MALDI‐TOF‐MS. The theoretical molecular masses calculated based on amino acid composition are in parentheses. D) The CD curves of ASP‐ELPs, ASP, and ELPs. E) DLS measurements indicated an increase in the hydrodynamic diameter of ASP‐ELPs compared to ASP. F) The T t decreased with increasing concentration or ELP chain length. The transition temperature (T t) was defined as the turbidity versus temperature curve's inflection point and calculated as the first derivative's maximum. G) The enzyme activity of freshly prepared ASP, PEG‐ASP, and ASP‐ELPs. Data are mean ± SD (n = 20). H) In vitro cytotoxicity on human acute lymphoid leukemia cell lines (Jurkat and CCRF‐CEM) and human Burkitt's lymphoma cell lines (Raji and Ramos). Half‐maximum inhibitory concentration (IC50) was calculated with non‐linear fitting (sigmoidal curve fit) in Origin Pro 2021. For each cell line, the IC50 of PEG‐ASP was significantly higher than those of ASP‐ELPs. Data are mean ± SD (n = 3). I) Long‐term storage stability in 10 mM PBS at 37 °C. The activity retention (ratio of residual activity to initial activity) of ASP‐ELPs declined significantly slower with storage time than ASP and PEG‐ASP. Data are mean ± SD (n = 4). Statistical significance was determined by one‐way ANOVA followed by Tukey's multiple comparisons test in (H,I).
Figure 3
Figure 3
ASP‐ELPs featured sustained release and improved pharmacokinetics. A) Representative images of the fluorescence intensity variation of Cy5‐labeled ASP, PEG‐ASP, ASP‐ELP60, or ASP‐ELP90 at the injection site (n  =  3). B) ASP‐ELP90 possessed a higher fluorescence retention (ratio of residual fluorescence to initial fluorescence) at the injection site than ASP, PEG‐ASP, and ASP‐ELP60. Data are mean ± SD (n  =  3). Statistical difference was determined using an unpaired two‐tailed Student's t‐test. C) Serum ASP activity levels of mice in each group at defined time points upon injection with the MTDs of ASP, PEG‐ASP, ASP‐ELP60, and ASP‐ELP90. Data are mean ± SD (n = 5). D) The t 1/2 values are calculated by fitting the databases to a one‐compartment mode. Data are mean ± SD (n = 5). Statistical significance was determined by one‐way ANOVA followed by Tukey's multiple comparisons test. E) The AUCs of ASP‐ELP90 and ASP‐ELP60 were linearly correlated with time, while the AUCs of PEG‐ASP and ASP were logarithmically correlated with time. Data are mean ± SD (n = 5).
Figure 4
Figure 4
ASP‐ELP90 possessed lower immunogenicity compared with ASP, PEG‐ASP, and ASP‐ELP60. A) Schematic illustration of the primary events of the immunogenicity assay. The “i.p.” represents “intraperitoneal injection.” Blood samples were collected at given time points after the first and third injections to measure ASP activity levels. Mice were euthanized on day 42, and blood samples were collected and tested for immunogenicity. B) Serum ASP activity levels in ASP, PEG‐ASP, and ASP‐ELP60 groups were lower after the third injection than after the first injection. Data are represented as mean ± SD (n  =  6). C) The t 1/2 values in ASP, PEG‐ASP, and ASP‐ELP60 groups were significantly lower after the third injection than after the first injection, while in the ASP‐ELP90 group, no significant changes were observed after the two injections. Data are represented as mean ± SD (n  =  6). Statistical difference was determined using a paired two‐tailed Student's t‐test. D,E) The titers of anti‐protein IgG/IgM and anti‐polymer IgG/IgM in ASP, PEG‐ASP, ASP‐ELP60, and ASP‐ELP90 groups. The anti‐protein IgG/IgM titers of ASP‐ELP90 were lower than those of ASP‐ELP60, PEG‐ASP, and ASP. There were no significant differences in anti‐ELP IgG and IgM titers between ASP‐ELP90 and ASP‐ELP60, whereas the anti‐PEG IgG/IgM titers of PEG‐ASP were higher than the anti‐ELP IgG/IgM titers of ASP‐ELPs. Data are mean ± SD (n = 9). Statistical significance was determined by one‐way ANOVA followed by Tukey's multiple comparisons test.
Figure 5
Figure 5
Toxicity assessments after two dosing regimens (SA‐MTD and MA‐SD). The “SA‐MTD” represents “a single administration of the maximum tolerated dose”; and the “MA‐SD” represents “multiple administrations of the same dose”. A) Representative images of H&E‐stained pathological sections after SA‐MTD. No apparent histopathological alterations were observed (n  =  6). Scale bar, 100 µm. B) Representative images of H&E‐stained pathological sections after MA‐SD (n  =  6). The lipid vacuoles due to hepatocyte degeneration in liver tissues (black arrows) indicated liver injury; swollen, degenerated, and necrotic splenocytes in spleen tissues (black arrows) demonstrated severe splenic injury; and homogeneous red‐stained proteinaceous depots and detached necrotic renal tubular epithelial cells in kidney tissues (black arrows) suggested acute tubular interstitial injury. Scale bar, 100 µm. C) Liver indicator analysis. Significantly elevated AST and ALT indicated ASP‐induced liver injury or abnormal liver function (n  =  6). D) Kidney indicator analysis. Markedly raised CREA and BUN suggested ASP‐induced renal failure or abnormal renal function (n  =  6). E) Blood routine indicator analysis. Decreased RBCs, WBCs, PLTs, and HGB suggested the possibility of hematopoietic suppression (n  =  6). Data in (C–E) are mean ± SD (n = 6), and the statistical difference was determined by one‐way ANOVA followed by Tukey's multiple comparisons test.
Figure 6
Figure 6
ASP‐ELP90 outperformed ASP, PEG‐ASP, and ASP‐ELP60 in anticancer efficacy after SA‐MTD in CDX mouse models of A—D) CCRF‐CEM‐Luc leukemia and E—H) Raji–Luc lymphoma. The “SA‐MTD” represents “a single administration of the maximum tolerated dose”. The “i.p.” represents “intraperitoneal injection”; the “i.v.” represents “intravenous injection”; and the “s.c.” represents “subcutaneous injection”. A,E) Schematic illustration of the primary events of the anti‐leukemia or anti‐lymphoma assay. B,F) Bioluminescence images of mice harboring CCRF‐CEM‐Luc or Raji–Luc cells in SA‐MTD (n = 5). C,G) Bioluminescence signal over time in mice carrying CCRF‐CEM‐Luc or Raji–Luc. Data are mean ± SD (n = 5 per group). Statistical difference was determined using an unpaired two‐tailed Student's t‐test. D,H) Survival curves of mice carrying CCRF‐CEM‐Luc or Raji–Luc cells upon pharmacological treatment with PBS, ASP, PEG‐ASP, ASP‐ELP60, and ASP‐ELP90 (n = 5 per group). Survival significance was assessed by a log‐rank (Mantel–Cox) test.
Figure 7
Figure 7
ASP‐ELP90 outperformed ASP, PEG‐ASP, and ASP‐ELP60 in anticancer efficacy after MA‐SD in CDX mouse models of A—D) CCRF‐CEM‐Luc leukemia and E—H) Raji–Luc lymphoma. The “MA‐SD” represents “multiple administrations of the same dose”. A,E) Schematic illustration of the primary events of the anti‐leukemia or anti‐lymphoma assay. B,F) Bioluminescence images of mice harboring CCRF‐CEM‐Luc or Raji–Luc cells in MA‐SD (n = 5). The white dashed line represents the natural death of post‐treatment mice. C,G) Bioluminescence signal over time in mice carrying CCRF‐CEM‐Luc or Raji–Luc. Data are mean ± SD (n = 5 per group). Statistical difference was determined using an unpaired two‐tailed Student's t‐test. D,H) Survival curves of mice carrying CCRF‐CEM‐Luc or Raji–Luc cells upon treatment with PBS, ASP, PEG‐ASP, ASP‐ELP60, and ASP‐ELP90 (n = 5 per group). Survival significance was assessed by a log‐rank (Mantel–Cox) test.

Similar articles

Cited by

References

    1. a) Dores G. M., Curtis R. E., Dalal N. H., Linet M. S., Morton L. M., J. Clin. Oncol. 2020, 38, 4149; - PMC - PubMed
    2. b) Ferreyro B. L., Scales D. C., Wunsch H., Cheung M. C., Gupta V., Saskin R., Thyagu S., Munshi L., Intensive Care Med. 2021, 47, 1104; - PubMed
    3. c) Gray T. F., Temel J. S., El‐Jawahri A., Blood Rev. 2021, 45, 100692. - PubMed
    1. a) Chihara D., Huang E. P., Finnigan S. R., Cordes L. M., Skorupan N., Fukuda Y. K., Rubinstein L. V., Takebe N., Blood 2020, 136, 18;
    2. b) Craddock C., Friedberg J. W., J. Clin. Oncol. 2021, 39, 343; - PubMed
    3. c) Hou J. Z., Ye J. C., Pu J. J., Liu H., Ding W., Zheng H., Liu D., J. Hematol. Oncol. 2021, 14, 66; - PMC - PubMed
    4. d) Chihara D., Huang E. P., Finnigan S. R., Cordes L. M., Skorupan N., Fukuda Y., Rubinstein L. V., Ivy S. P., Doroshow J. H., Nastoupil L. J., Flowers C. R., Takebe N., J. Clin. Oncol. 2022, 40, 1949; - PMC - PubMed
    5. e) Finck A. V., Blanchard T., Roselle C. P., Golinelli G., June C. H., Nat. Med. 2022, 28, 678. - PMC - PubMed
    1. a) Qian J., Wang Q., Liu L., Bi E., Ma X., Su P., Yang M., Yi Q., Blood 2019, 134, 5551;
    2. b) Rajewsky K., Nature 2019, 575, 47; - PubMed
    3. c) Tsao L. C., Force J., Hartman Z. C., Cancer Res. 2021, 81, 4641. - PMC - PubMed
    1. a) Alatrash G., Daver N., Mittendorf E. A., Pharmacol. Rev. 2016, 68, 1014; - PMC - PubMed
    2. b) Salik B., Smyth M. J., Nakamura K., J. Hematol. Oncol. 2020, 13, 111; - PMC - PubMed
    3. c) Mazzarella L., Enblad G., Olweus J., Malmberg K. J., Jerkeman M., J. Intern. Med. 2022, 292, 205. - PubMed
    1. a) Larson R. C., Maus M. V., Nat. Rev. Cancer 2021, 21, 145; - PMC - PubMed
    2. b) Xue L., Yi Y., Xu Q., Wang L., Yang X., Zhang Y., Hua X., Chai X., Yang J., Chen Y., Tao G., Hu B., Wang X., Cell Discovery 2021, 7, 84; - PMC - PubMed
    3. c) Li F., Zhang H., Wang W., Yang P., Huang Y., Zhang J., Yan Y., Wang Y., Ding X., Liang J., Qi X., Li M., Han P., Zhang X., Wang X., Cao J., Fu Y. X., Yang X., Nat. Commun. 2022, 13, 4334; - PMC - PubMed
    4. d) Lu J., Jiang G., Mol. Cancer 2022, 21, 194. - PMC - PubMed

LinkOut - more resources