. 2023 Aug;10(23):e2300548.
doi: 10.1002/advs.202300548. Epub 2023 Jun 4.

A T Cell-Engaging Tumor Organoid Platform for Pancreatic Cancer Immunotherapy

Affiliations

A T Cell-Engaging Tumor Organoid Platform for Pancreatic Cancer Immunotherapy

Zhuolong Zhou et al. Adv Sci (Weinh). 2023 Aug.

Abstract

Pancreatic ductal adenocarcinoma (PDA) is a clinically challenging disease with limited treatment options. Despite a small percentage of cases with defective mismatch DNA repair (dMMR), PDA is included in the most immune-resistant cancer types that are poorly responsive to immune checkpoint blockade (ICB) therapy. To facilitate drug discovery combating this immunosuppressive tumor type, a high-throughput drug screen platform is established with the newly developed T cell-incorporated pancreatic tumor organoid model. Tumor-specific T cells are included in the pancreatic tumor organoids by two-step cell packaging, fully recapitulating immune infiltration in the immunosuppressive tumor microenvironment (TME). The organoids are generated with key components in the original tumor, including epithelial, vascular endothelial, fibroblast and macrophage cells, and then packaged with T cells into their outside layer mimicking a physical barrier and enabling T cell infiltration and cytotoxicity studies. In the PDA organoid-based screen, epigenetic inhibitors ITF2357 and I-BET151 are identified, which in combination with anti-PD-1 based therapy show considerably greater anti-tumor effect. The combinatorial treatment turns the TME from immunosuppressive to immunoactive, up-regulates the MHC-I antigen processing and presentation, and enhances the effector T cell activity. The standardized PDA organoid model has shown great promise to accelerate drug discovery for the immunosuppressive cancer.

Keywords: epigenetic inhibitors; high-throughput drug screen; immunotherapy; pancreatic ductal adenocarcinoma; patient-derived organoid; tumor antigen presentation; tumor organoid.


Conflict of interest statement

M.O. received research funds from Eli Lilly and Bayer and has consulting roles with Pfizer, AstraZeneca, and Novartis. X.L. is a cofounder of Reactimm Therapeutics LLC. X.L. is an inventor on the pending patent PCT/US2021/062842, “Methods to sensitize cancer cells and standardized assay for immunotherapy”.

Figures
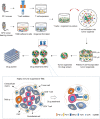
Figure 1
Figure 1
Schematic illustration of a T cell‐incorporated PDA tumor organoid‐based screen for drug discovery. The screen process is composed of pancreatic tumor organoid generation, T cell‐mediated cytotoxicity and drug screen. First, OVA+Luc+GFP+ KPC cells that can express OVA peptide SIINFEKL were orthotopically transplanted to C57BL/6 mice to generate pancreatic tumors. The tumors are harvested and dissociated into single cells. The adherent cells collected at the second day from 2D culture and F4/80 positive cells (macrophages) are combined to generate tumor organoids in 10% Matrigel‐containing culture medium. A total of 4 × 105 cells in 2 mL organoid culture medium were seeded into each well with ultra‐low attachment surface. After 5‐day culture, tumor organoids with diameter between 70 and 150 µm are mixed with CD3/CD28 antibodies pre‐activated and OVA‐specific T cells with a ratio of 1:1000 to 1:2500 in organoid culture medium containing 3% Matrigel and 10 ng mL−1 IL2 for 36 h. The T cell‐incorporated tumor organoids with diameter between 100 and 300 µm are collected and treated with each individual drugs for 48 h in the Matrigel‐free medium containing 10 ng mL−1 IL2. The tumor cell viability in tumor organoids with and without T cells incorporated was quantified using an Incucyte S3 system.
Figure 2
Figure 2
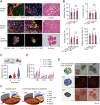
Characterization of mouse PDA tumor organoids. A) Immunofluorescence (IF) and collagen deposition (Picro Sirius red staining) images of human pancreatic cancer samples, mouse KPC tumors and tumor‐derived organoids. CK19 stains for epithelial cells; αSMA for cancer‐associated fibroblasts; CD31 for endothelial cells; and CD68 and F4/80 for human and mouse macrophages, respectively. Scale bars = 50 µm. B) The proportions of staining‐positive cells (αSMA, CD68, F4/80, or CD8) from IF (n = 7, image per group) and Picro Sirius red staining (n = 5, image per group) in total cells of the samples as indicated. TO: Tumor organoids. C) Sizes of mouse KPC tumor organoids in culture at day 3, 7, and 14. Optical images showed the corresponding organoid sizes on different days. Scale bars = 200 µm. D) T cell proportions in mouse KPC tumor organoids when packed onto the surfaces of tumor organoids with different Organoid: T cell ratios. The data were collected by flow analysis after the filtered organoids were digested into single cells and stained with T cell antibodies (sample size per group: n = 3). Organoid: T cells ratio (O:T). E) Optical, IHC and IF images (CD4, CD8) of T cell‐incorporated tumor organoids. Scale bars = 50 µm. F) Cell composition of mouse KPC orthotopic tumors harvested 30 days post orthotopic injection of KPC cells into C57BL/6 mice, and cell composition of T cell‐incorporated tumor organoids derived from the KPC tumor at the day 7 of organoid culture.
Figure 3
Figure 3
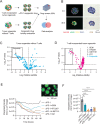
Epigenetic drug screen using mouse PDA tumor organoid platform. A) Schematic illustration of drug screening using 3D tumor organoids with and without T cells incorporated. B) IF and IHC staining of CD8 T cells in the KPC tumor organoids at 0 and 48 h after generation of the T cell‐incorporated organoids. EpCAM, αSMA, and CD31 stained cells are shown in red, green, or yellow color, respectively in the IF images. CD8 T cells showed brown color in the IHC images. C) Volcano plot analysis showing the viability of tumor cells in the OVA+Luc+GFP+ KPC tumor organoids treated with vehicle control or compounds (1.0 µm) for 48 h. The compounds within the rectangle had significant toxicity to the tumor organoids (Log2[relative viability] < −1.5; p < 0.05). D) The viability of tumor cells in the T cell‐incorporated OVA+Luc+GFP+ KPC tumor organoids treated with vehicle control or compounds (1.0 µm) in the presence of αPD‐1 (10 µg mL−1) for 48 h. The compounds within the rectangle showed significantly enhanced T cell cytotoxicity on cancer cells in the tumor organoids (Log2[relative viability]< −1.5; p < 0.05). GEM: Gemcitabine. E) The real‐time viability of tumor cells in the OVA+Luc+GFP+ KPC tumor organoids with indicated treatments (αPD‐1, GEM + αPD‐1, ITF2357 + αPD‐1, I‐BET151 + αPD‐1, and JQ1 + αPD‐1) was monitored and analyzed for 48 h using Incucyte device. The viability of cells was determined by the integrated intensity [mean intensity (CGU) × organoid area (µm2)]. F) Histogram analysis of the cell viability for (E) (sample size per group: n = 3).
Figure 4
Figure 4
Validation of epigenetic drug candidates using mouse tumor organoids. A) The cytotoxicity of tumor cells in the OVA+GFP+KPC tumor organoids with and without T cells incorporated upon treatment of isotype antibody control, ITF2357 (1.0 µm), I‐BET151 (1.0 µm), with, or without αPD‐1 (10 µg mL−1) for 48 h. The images are overlapped with optical light and green/red fluorescence channels. The GFP+ KPC tumor cells are shown in green color; red color (Sartorius Cytotox Dye) stains dead cells. Scale bars = 200 µm. B) Quantification of organoid size of the sample groups from (A). The organoid size was analyzed using ImageJ software. Data were presented as mean ± SD by One‐way ANOVA test. **, p < 0.01; ****, p < 0.0001; n.s., no significance. C) Death rates of the tumor cells in the tumor organoids treated with control, αPD‐1, ITF2357, I‐BET151, ITF2357 + αPD‐1, or I‐BET151 + αPD‐1, were measured by flow cytometry analysis (sample size per group: n = 3). Data were presented as mean ± SD by One‐way ANOVA test. **, p < 0.01; ***, p < 0.001; ****, p < 0.0001; n.s., no significance. D) GZMB and IFNγ positive cells in the CD8 T cells incorporated in the tumor organoids treated with control or epigenetic compounds (sample size per group: n = 3). Data were presented as mean ± SD by Two‐way ANOVA test. *, p < 0.05; **, p < 0.01. E,F) The mean fluorescence intensity (MFI) of H‐2Kb on the mouse OVA+GFP+ KPC cells treated with control, ITF2357, or I‐BET151, determined by flow cytometry analysis (sample size per group: n = 3). Data were presented as mean ± SD by One‐way ANOVA test. **, p < 0.01; ****, p < 0.0001.
Figure 5
Figure 5
Epigenetic inhibitors augment anti‐tumor activity of immune checkpoint blockade in vivo. A) Drug treatment and bioluminescent imaging scheme of the KPC tumor‐bearing mice. The tumor‐bearing C57BL/6 mice were randomized into six groups with eight mice (4 males +4 females) per group. B) The KPC tumors from the tumor‐bearing C57BL/6 mice and IHC staining images of KPC tumors from control, ITF2357, and I‐BET151 treatment groups. C) Bioluminescent images of KPC tumors from the tumor‐bearing C57BL/6 mice treated with isotype antibody control, αPD‐1, ITF2357, I‐BET151, ITF2357 + αPD‐1, or I‐BET151 + αPD‐1 at day 14, 17, 35, and 50 post orthotopic injection. D) The total flux of KPC tumors from the tumor‐bearing C57BL/6 mice treated with isotype antibody control, αPD‐1, ITF2357, I‐BET151, ITF2357 + αPD‐1, or I‐BET151 + αPD‐1 by bioluminescent Imaging (sample size per group: n = 8). E) Survival curves of the KPC tumor‐bearing C57BL/6 mice treated with isotype antibody control, αPD‐1, ITF2357, I‐BET151, ITF2357 + αPD‐1, or I‐BET151 + αPD‐1 combo group. Data were analyzed by the Kaplan–Meier method. *, p < 0.05; **, p < 0.01; ***, p < 0.001; ****, p < 0.0001; n.s., no significance.
Figure 6
Figure 6
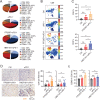
ITF2357 or I‐BET151 in combination with αPD‐1 enhances T cell infiltration and cytotoxicity in mouse KPC tumors. A) Pie charts of immune cells in KPC tumors isolated from the KPC‐bearing C57BL/6 mice treated with control, αPD‐1, ITF2357 + αPD‐1, or I‐BET151 + αPD‐1. The control or αPD‐1 group has five mice (3 males + 2 females) in each group and both combo treatment groups have six mice (3 males + 3 females) per group. B) t‐distributed stochastic neighbor embedding (t‐SNE) representation of CD8 T positive cells in the KPC tumor‐bearing mice treated with control, αPD‐1, ITF2357 + αPD‐1, or I‐BET151 + αPD‐1. The cell subtypes and proportions in total immune cell populations in the tumors are shown in t‐SNE. The dot plot presenting each channel is spectrum colored and the spectrum value represents the expression intensity of the indicated cell subtype. C) Quantitative analysis of CD8 T positive cells subtypes from t‐SNE results in (B) (sample size per group: n = 3 or 4). Data shown as mean ± SD by One‐way ANOVA test. *, p < 0.05; **, p < 0.01; n.s., no significance. D) IHC images and quantitative results of CD8 T cells in the tumors with indicated treatments (sample size per group: n = 8). Data shown as mean ± SD by One‐way ANOVA test. *, p < 0.05; **, p < 0.01; ***, p < 0.001; n.s., no significance. E) GZMB expression levels on CD8 T cells with indicated treatments, measured by Cytek device, and quantified by FlowJo software (sample size per group: n = 3 or 4). Data shown as mean ± SD by one‐way ANOVA test. *, p < 0.05; **, p < 0.01; n.s., no significance.
Figure 7
Figure 7
Epigenetic drug treatment up‐regulates antigen processing and presentation of mouse KPC cells. A) Gene pathway analysis of up‐regulated DEGs pathways in the ITF2357 treated KPC cells. B) Gene pathway analysis of up‐regulated DEGs pathways in the I‐BET151 treated KPC cells. C) Heatmap showing the ITF2357‐induced up‐regulation of DEGs enriched in Antigen presentation: folding, assembly, and peptide loading of class I MHC‐I. D) Heatmap showing the I‐BET151‐induced up‐regulation of DEGs enriched in Antigen presentation: folding, assembly and peptide loading of class I MHC‐I. E,F) qPCR validation of up‐regulated genes from (C, D) in mouse KPC cells (sample size per group: n = 3). The control group was shared in the two drug treatment conditions. Data were presented as mean ± SD by Two‐way ANOVA test. *, p < 0.05; **, p < 0.01; ***, p < 0.001; ****, p < 0.0001.
Figure 8
Figure 8
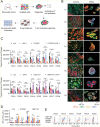
Epigenetic drug treatment enhances the cytotoxicity of autologous T cells in PDOs in combination with ICB. A) Schematic illustration of drug evaluation determined by the cytotoxicity of autologous T cell incorporated in the PDOs. B) Characterization of PDOs from eight pancreatic cancer patients using immunofluorescence analysis. EpCAM+, SMA+, and CD31+ cells represent pancreatic cancer epithelial cells, cancer‐associated fibroblast cells, and endothelial cells, respectively. C) Quantification of T cell‐mediated cytotoxicity in the PDOs treated with control, ITF2357, I‐BET151, αPD‐1, ITF2357 + αPD‐1, or I‐BET151 + αPD‐1 (sample size per group: n = 4). Smaller organoid size indicates higher cytotoxicity in the PDOs. The PDOs were treated for 48 h and imaged under the Incucyte device. Control and αPD‐1 groups were shared in the two drug treatment conditions. Data were presented as mean ± SD by Two‐way ANOVA test. *, p < 0.05; **, p < 0.01; ***, p < 0.001; ****, p < 0.0001; ns, no significance. D) The mean fluorescence intensity (MFI) of HLA‐A,B,C on the Human pancreatic cancer cells treated with control, ITF2357, or I‐BET151 in flow cytometry analysis (sample size per group: n = 2). Data were presented as mean ± SD by Two‐way ANOVA test. *, p < 0.05; **, p < 0.01; ***, p < 0.001; ns, no significance. E) Representative flow cytometry data of (D).

Similar articles

Cited by

References

    1. Kleeff J., Korc M., Apte M., Vecchia C. L.a, Johnson C. D., Biankin A. V., Neale R. E., Tempero M., Tuveson D. A., Hruban R. H., Neoptolemos J. P., Nat. Rev. Dis. Primers 2016, 2, 16022. - PubMed
    1. Bear A. S., Vonderheide R. H., O'Hara M. H., Cancer Cell 2020, 38, 788. - PMC - PubMed
    1. Feig C., Gopinathan A., Neesse A., Chan D. S., Cook N., Tuveson D. A., Clin. Cancer Res. 2012, 18, 4266. - PMC - PubMed
    1. Kerk S. A., Papagiannakopoulos T., Shah Y. M., Lyssiotis C. A., Nat. Rev. Cancer 2021, 21, 510. - PMC - PubMed
    1. Kamisawa T., Wood L. D., Itoi T., Takaori K., Lancet 2016, 388, 73. - PubMed