Review
. 2023 Oct;23(10):e202300113.
doi: 10.1002/tcr.202300113. Epub 2023 Jun 2.

Understanding the Rhodopsin Worldview Through Atomic Force Microscopy (AFM): Structure, Stability, and Activity Studies

Affiliations
Review

Understanding the Rhodopsin Worldview Through Atomic Force Microscopy (AFM): Structure, Stability, and Activity Studies

Subhadip Senapati et al. Chem Rec. 2023 Oct.

Abstract

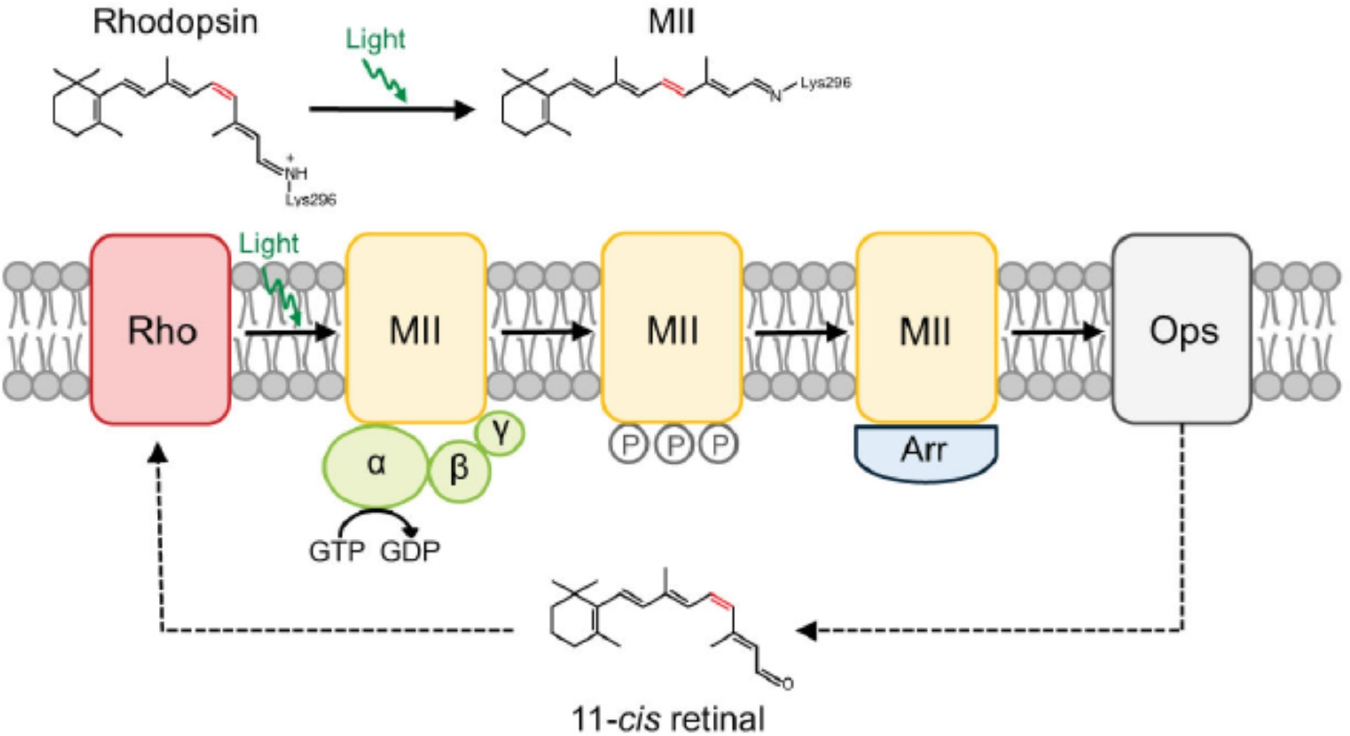
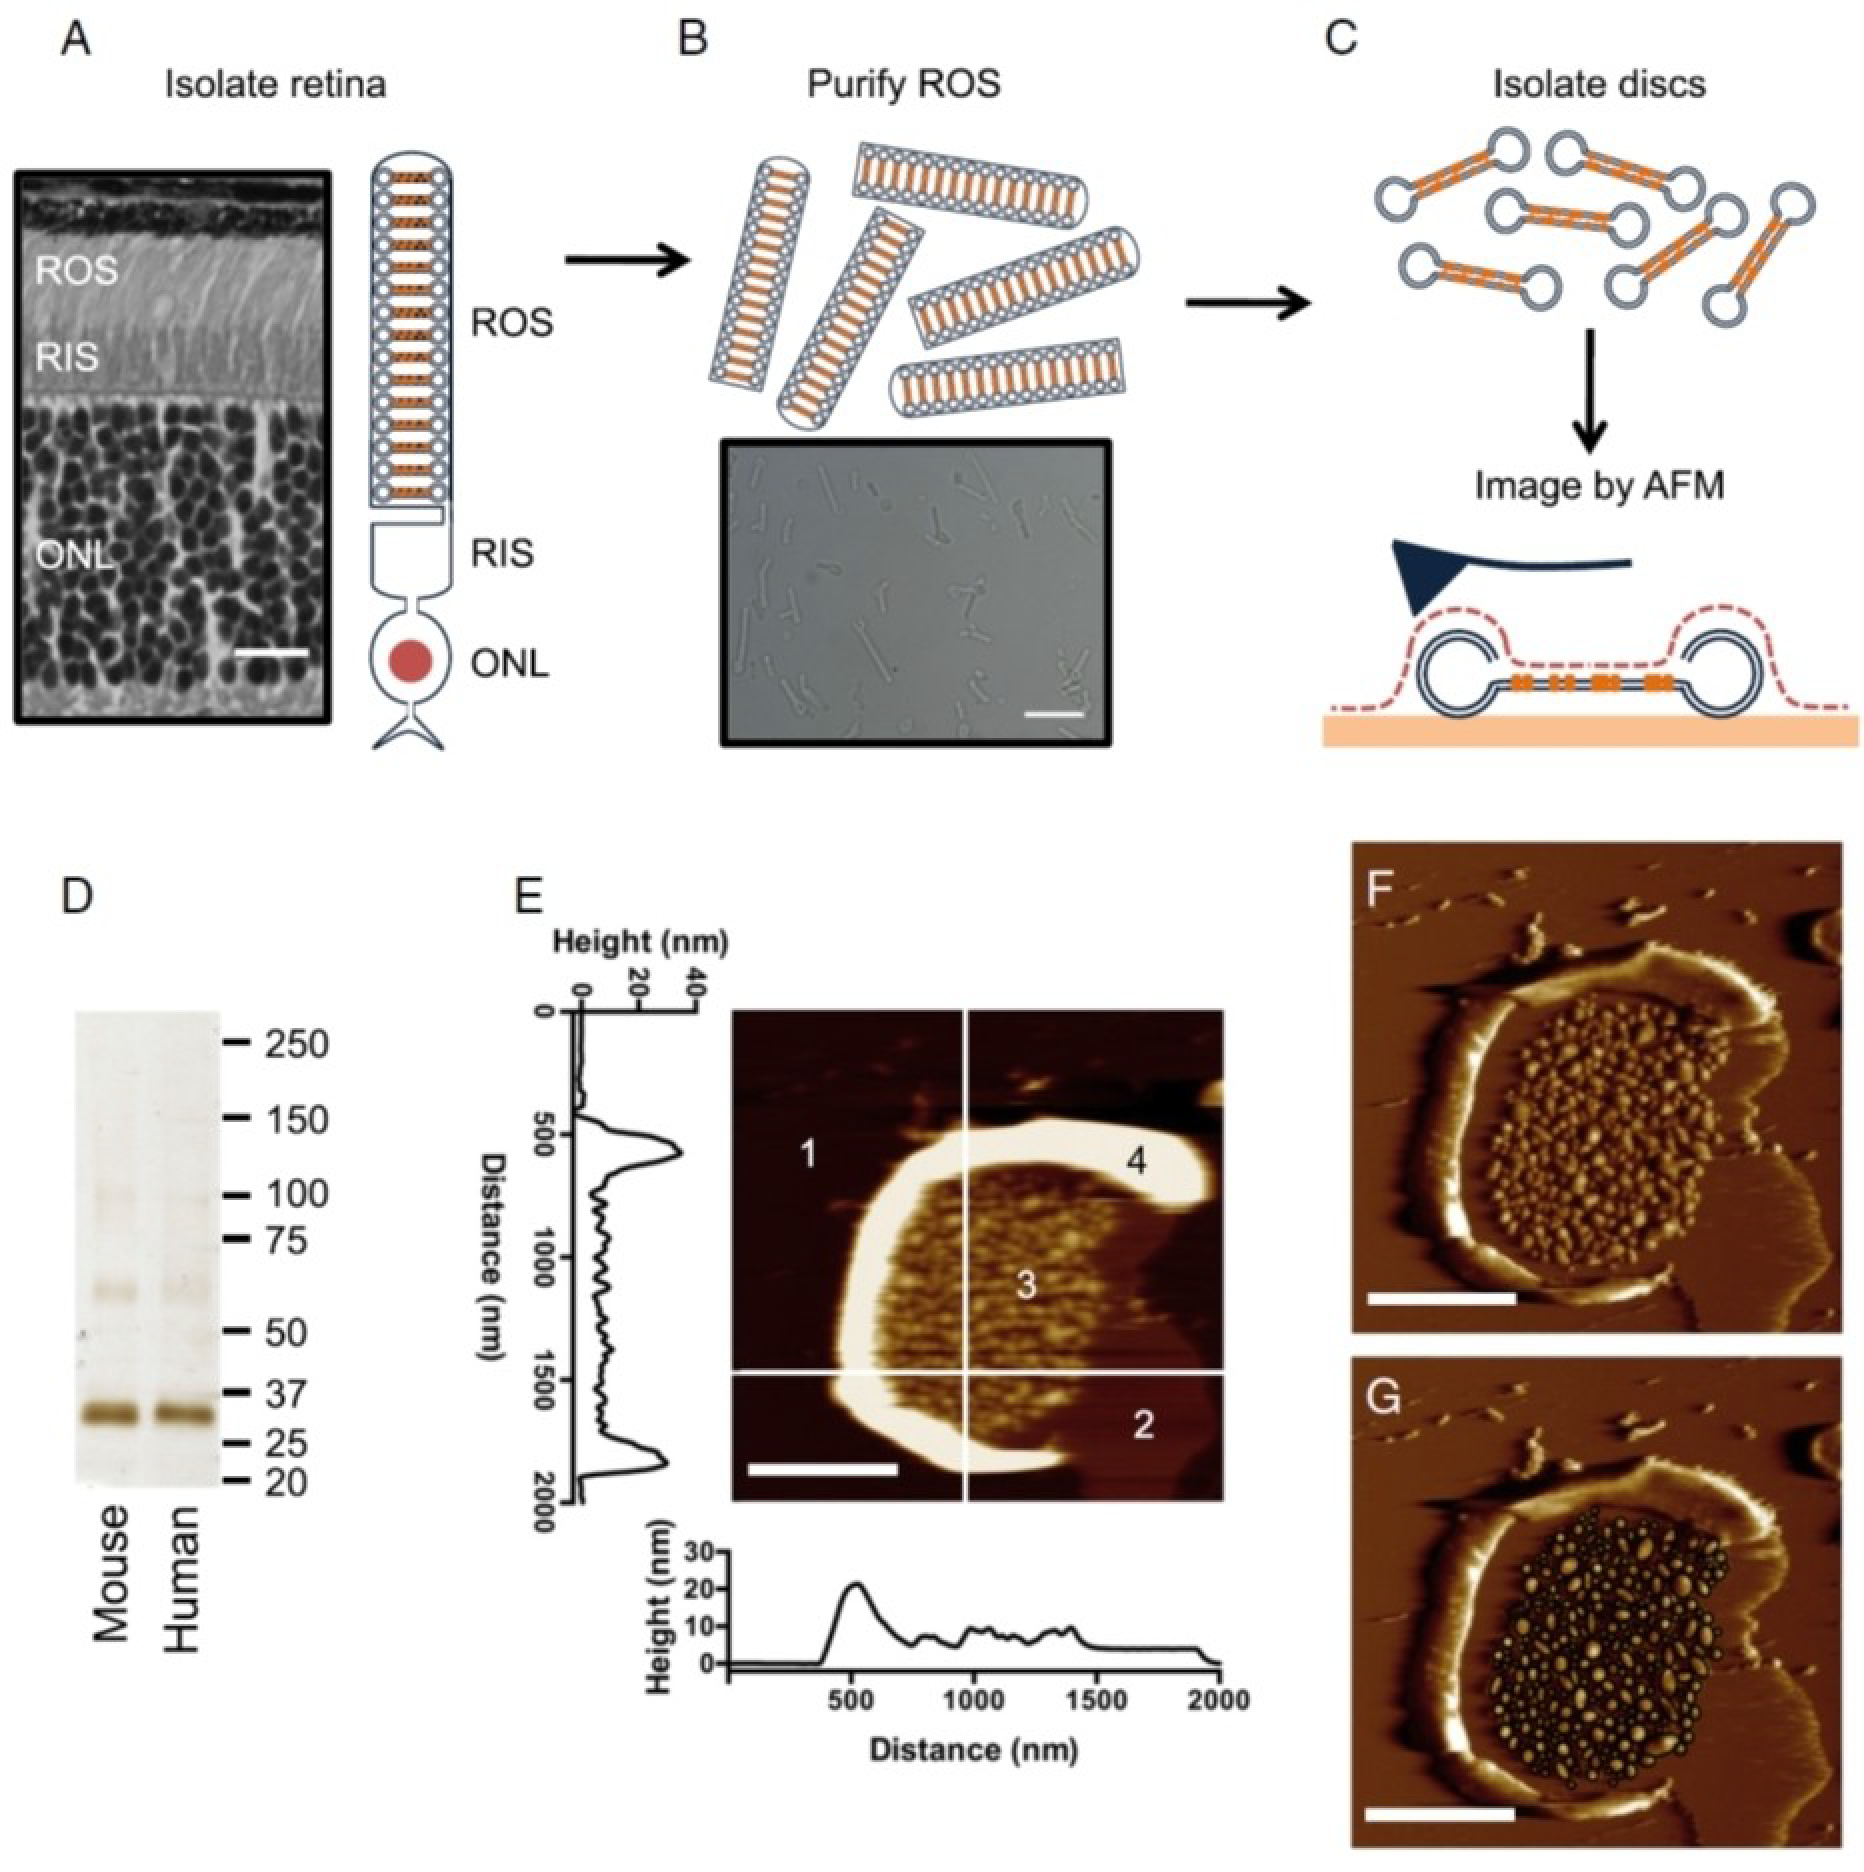
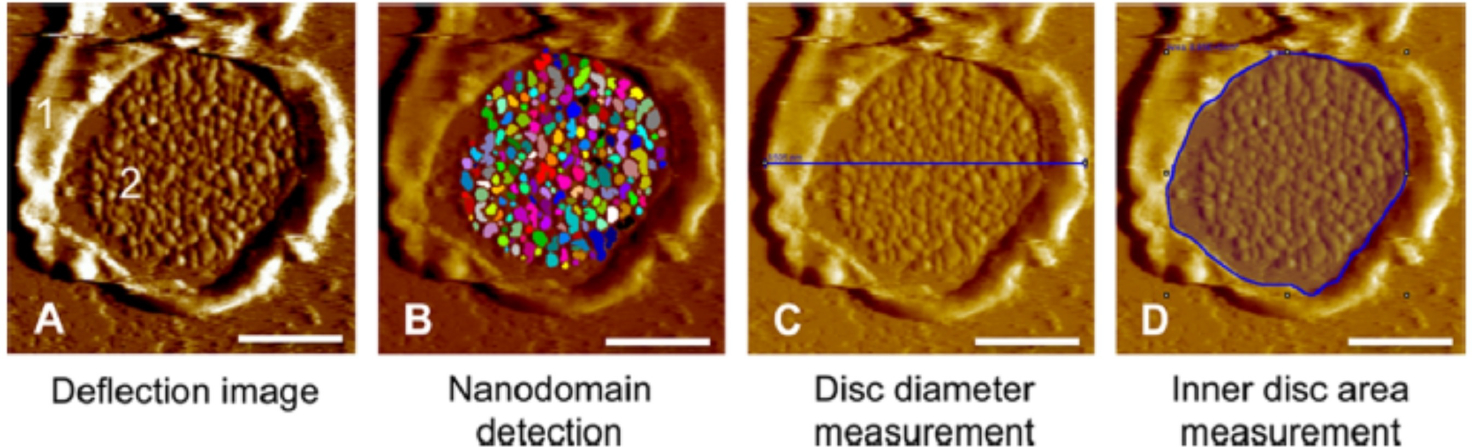
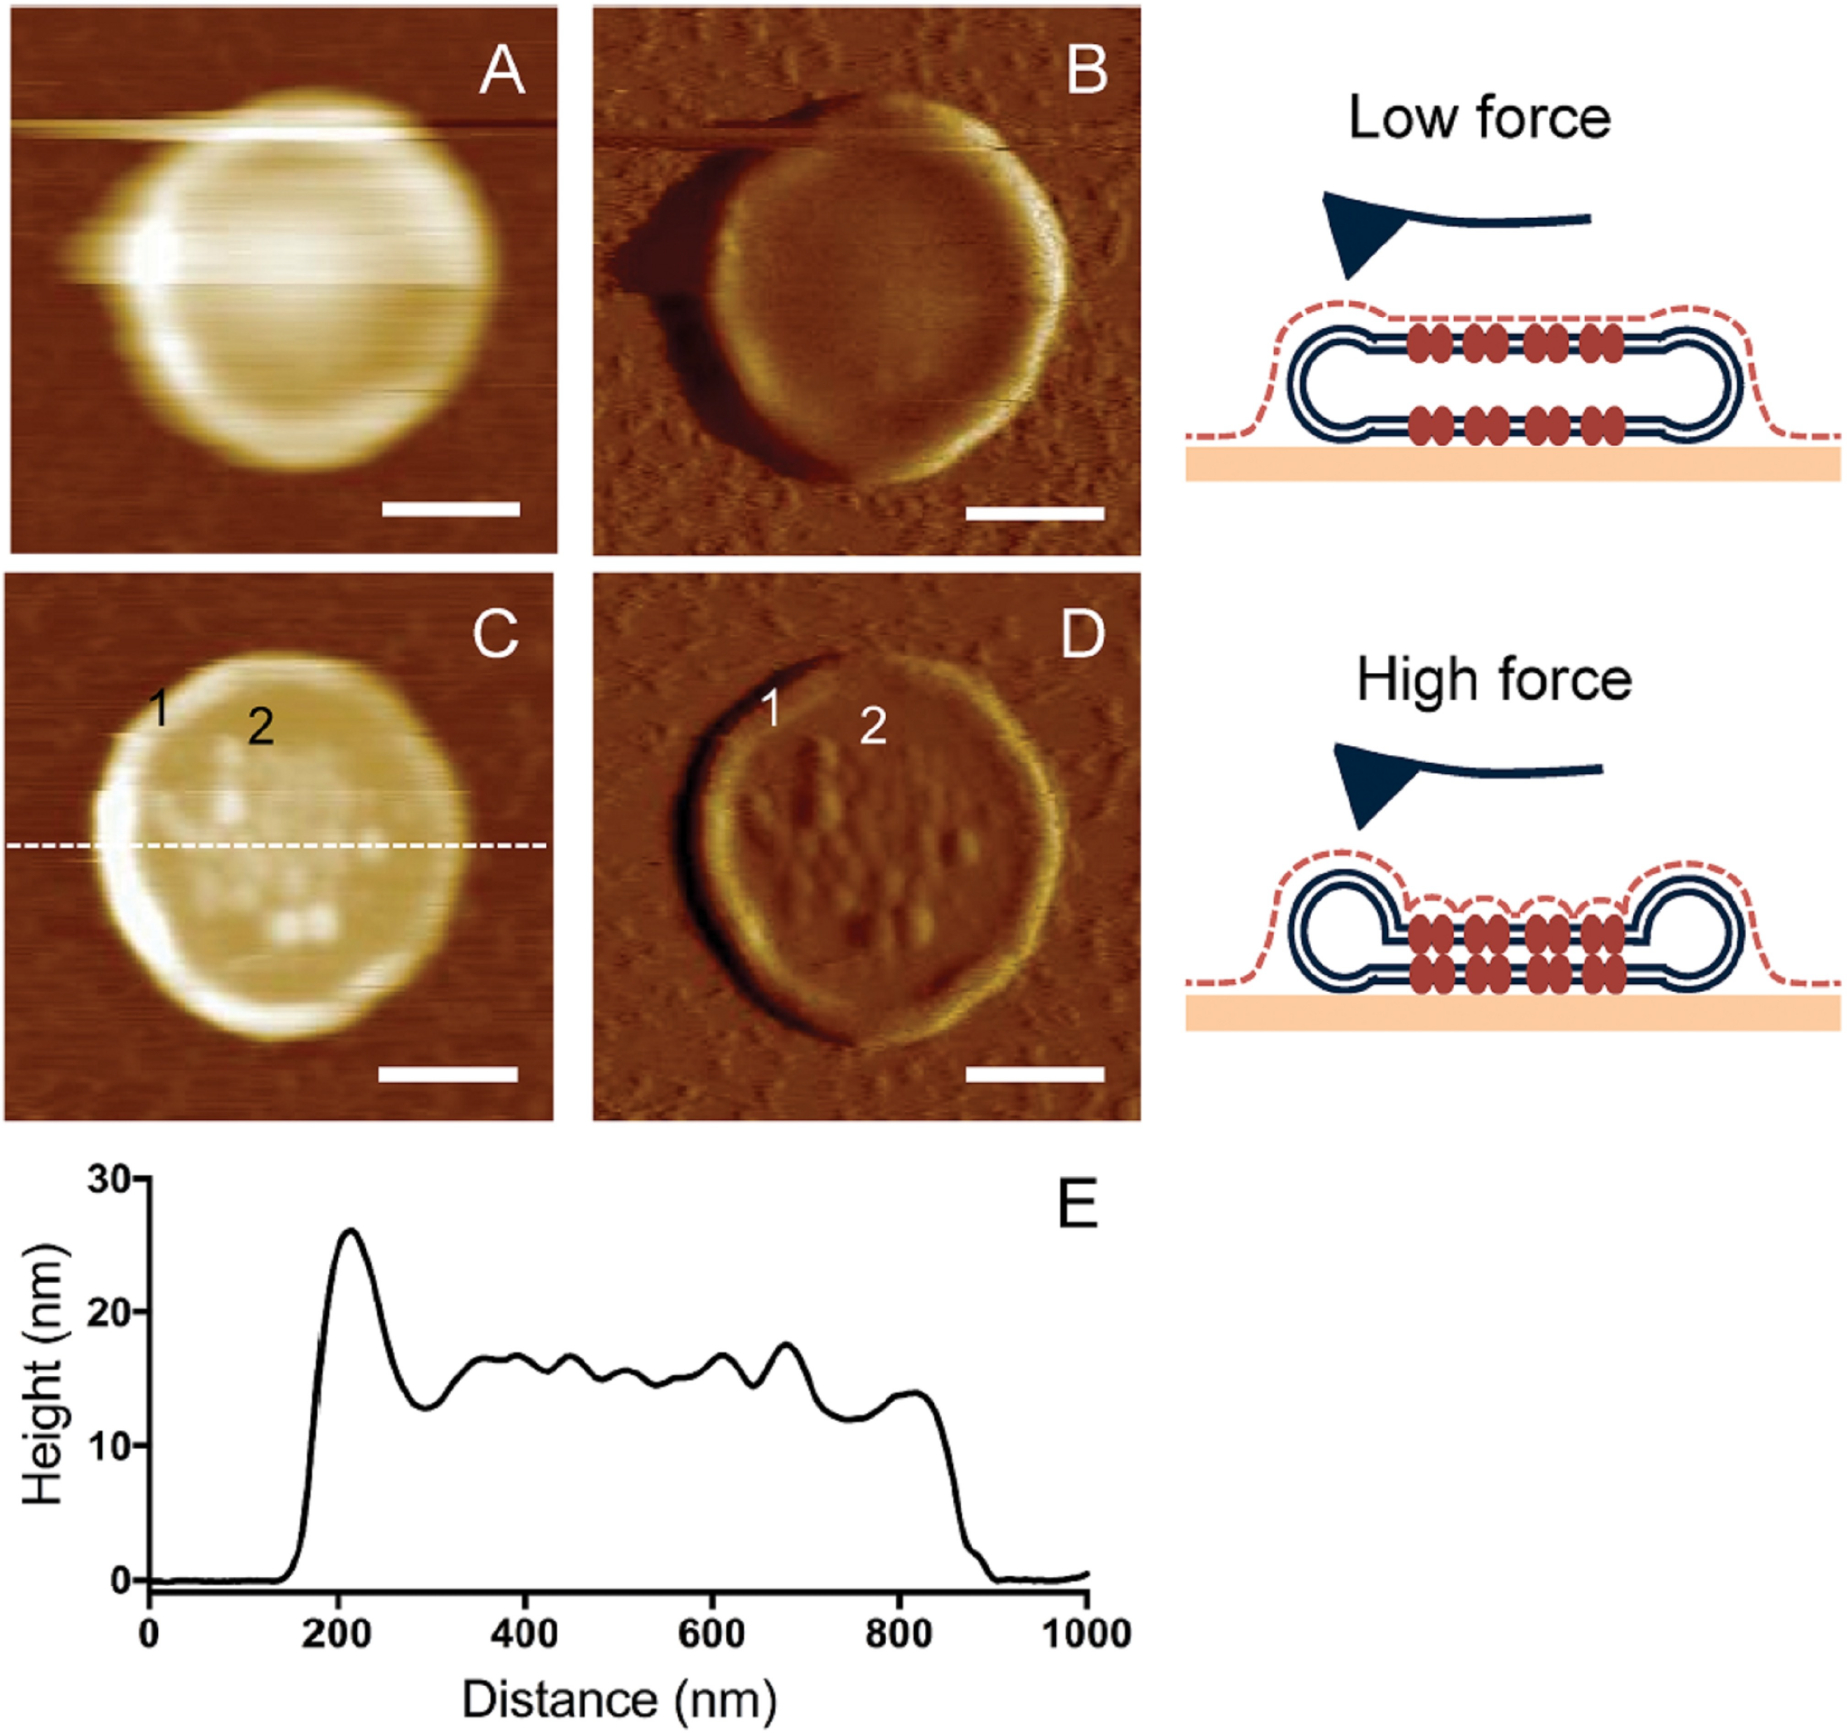
Rhodopsin is a G protein-coupled receptor (GPCR) present in the rod outer segment (ROS) of photoreceptor cells that initiates the phototransduction cascade required for scotopic vision. Due to the remarkable advancements in technological tools, the chemistry of rhodopsin has begun to unravel especially over the past few decades, but mostly at the ensemble scale. Atomic force microscopy (AFM) is a tool capable of providing critical information from a single-molecule point of view. In this regard, to bolster our understanding of rhodopsin at the nanoscale level, AFM-based imaging, force spectroscopy, and nano-indentation techniques were employed on ROS disc membranes containing rhodopsin, isolated from vertebrate species both in normal and diseased states. These AFM studies on samples from native retinal tissue have provided fundamental insights into the structure and function of rhodopsin under normal and dysfunctional states. We review here the findings from these AFM studies that provide important insights on the supramolecular organization of rhodopsin within the membrane and factors that contribute to this organization, the molecular interactions stabilizing the structure of the receptor and factors that can modify those interactions, and the mechanism underlying constitutive activity in the receptor that can cause disease.

Keywords: Atomic force microscopy (AFM); Constitutive activity; G protein-coupled receptor (GPCR); Phototransduction; Rhodopsin.


Figures

Figure 1.
Figure 1.
In the dark, rhodopsin is covalently bound to the chromophore 11-cis retinal and locked in the inactive state. Upon photon activation, 11-cis retinal isomerizes to all-trans retinal and forms the active MII state. MII binds with the heterotrimeric G protein transducin and activates it, resulting in the initiation of the phototransduction cascade. MII is inactivated via phosphorylation and decays to opsin by releasing all-trans-retinal from the chromophore-binding pocket. All-trans-retinal is converted back to 11-cis retinal through a series of enzymatic reactions referred to as the retinoid cycle. Opsin then binds with 11-cis retinal to regenerate rhodopsin and remains locked in the inactive state. Reproduced from ref. [50] Copyright (2014), with permission from Elsevier.
Figure 2.
Figure 2.
Isolation of ROS disc membranes and subsequent AFM imaging. (A) The rod outer segment (ROS), rod inner segment (RIS), and outer nuclear layer (ONL) are present in a histological section of a mouse retina and a cartoon of the rod photoreceptor cell. Scale bar, 15 μm. (B) Purified ROS as seen using a light micrograph. Scale bar, 15 μm. (C) ROS disc membranes are isolated and adsorbed onto mica for AFM imaging. In AFM imaging, a sharp probe is raster-scanned over the sample surface to generate topographical images. (D) SDS-PAGE on isolated disc membranes from mouse and human samples indicates that rhodopsin is the predominant protein present. The most prominent band corresponds to rhodopsin monomer and the faint bands above may represent rhodopsin dimer and higher-order oligomers. The sizes of protein standards are indicated in kDa. (E) AFM height image of a typical ROS disc membrane. Four different components are observed: 1, mica; 2, protein-free lipid bilayer; 3, rhodopsin nanodomains; and 4, rim region. The height profiles of the highlighted line scans can be seen. Scale bar, 500 nm. (F) AFM deflection image of the same ROS disc membrane. Scale bar, 500 nm. (G) The deflection image with nanodomains circled as black ellipses, whose diameters were measured to determine the surface area of the nanodomains. Reproduced from ref. [38] Copyright (2015), with permission from Elsevier.
Figure 3.
Figure 3.
Outline of the quantitative assessment of ROS disc membrane images using the software SPIP. (A) AFM deflection image of a ROS disc membrane with the rim region (1) and lamellar region (2), attached to mica support. (B) The deflection image is quantitatively analyzed by the SPIP ‘Particle and Pore’ feature to detect rhodopsin nanodomains, (C) measurement of the disc diameter, and (D) measurement of the inner disc area. Scale bar, 500 nm. Reproduced from ref. [46] Copyright (2015), with permission from American Chemical Society (ACS).
Figure 4.
Figure 4.
(A) Height image of an intact murine ROS disc obtained by contact mode AFM applying low force. (B) Deflection image corresponding to the image (A). (C) Height image of an intact murine ROS disc obtained by contact mode AFM applying higher force. (D) Deflection image corresponding to the image (C). The rim region (1) and nanodomains in the lamellar region (2) are distinctly visible. Scale bar, 250 nm. (E) A height profile matching that of an intact disc is shown for the cross-section highlighted by a dotted line in panel C. Reproduced from ref. [44] Copyright (2015), with permission from Public Library of Science (PLoS).
Figure 5.
Figure 5.
Adaptations in terms of rhodopsin density and nanodomain size in response to different lighting environments have been shown. A) Histograms generated for nanodomain size from all the disc membranes isolated from wild-type mice kept under cyclic, 10 days dark, and 10 days light conditions, B) Variation of rhodopsin density in disc membranes for wild-type mice kept under cyclic, 10 days dark, and 10 days light conditions, C) Histograms generated for nanodomain size from all the disc membranes isolated from wild-type mice kept under 10, 20, and 30 days dark conditions, D) Variation of rhodopsin density in disc membranes for wild-type mice kept under 10, 20, and 30 days dark conditions. E) The size distribution data points towards the presence of a 24-mer as the predominant oligomeric species of rhodopsin in disc membranes. The variances in the nanodomain sizes illustrated in panels A and C originated due to a shift in equilibrium between a 24-mer and larger sized oligomers. Adapted from ref. [45] Copyright (2017), with permission from Elsevier.
Figure 6.
Figure 6.
ROS disc properties for wild-type, Grm6−/−, Gnat−/−, and Grm6−/−/Gnat−/− mice housed under cyclic light conditions and for Grm6−/− mice housed under prolonged darkness (10 days dark). Mean values with individual data points and the standard deviation are presented. The same coloring of the plots indicates that the differences among those data are not statistically significant, whereas the different coloring indicates significant statistical differences among those data (as determined by one-way ANOVA and Tukey’s post-hoc test analysis). The p-values obtained from one-way ANOVA for data in each panel are as follows: A, 0.3448; B, < 0.0001; C, < 0.0001; D, 0.0022; E, < 0.0001; F, < 0.0001. Reproduced from ref. [41] Copyright (2020), with permission from Elsevier.
Figure 7.
Figure 7.
ROS disc membrane properties are shown for control or regular diet (i), DHA-adequate (ii), DHA-deficient (iii), DHA-replenished (iv), and Gnat−/− (v) mice. Mean values with individual data points and the standard deviation are presented. No significant differences were found by one-way ANOVA for the disc diameter (p = 0.7731), mean (p = 0.6048) and median (p = 0.0506) nanodomain size. Significant differences were detected by one-way ANOVA for the number (p = 0.002) and density (p = < 0.0001) of nanodomains and for the number (p = 0.009) and density (p = < 0.0001) of rhodopsin. Reproduced from ref. [43] Copyright (2018), with permission from Elsevier.
Figure 8.
Figure 8.
ROS disc properties for wild-type, RhoG90D/G90D, RhoG90D/+, and Rpe65−/− mice housed under cyclic light conditions and for RhoG90D/G90D and Rpe65−/− mice housed under prolonged darkness (10 days dark). Mean values with individual data points and the standard deviation are presented. Statistical analyses indicated no significant differences (p-value >.05) for any of the ROS disc properties among the different mouse lines examined. Reproduced from ref. [41] Copyright (2020), with permission from Elsevier.
Figure 9.
Figure 9.
Representative AFM images of ROS disc membranes isolated from (A–C) mature wild-type mice (at postnatal days 120), (D–F) young Prcd-KO mice (at postnatal days 30), and (G–I) mature Prcd-KO mice (at postnatal days 120). Asterisks indicate large areas within the discs without rhodopsin nanodomains, giving the discs an irregular structure. Scale bar = 500 nm. (J) Increase in the population of irregular discs as the disease progresses with age for the Prcd-KO mice. (K) A considerable decrease in rhodopsin density in the discs for Prcd-KO mice in comparison to the wild-type mice or the regular discs present in the Prcd-KO mice. Adapted from ref. [42] Copyright (2020), with permission from Springer Nature.
Figure 10.
Figure 10.
A) Example of a force-distance curve obtained from unfolding a membrane protein in SMFS. Each force peak corresponds to the force required to unfold the segment of the protein in the corresponding number. B) DFS provides information on properties shown in the unfolding energy barrier for a stable structural segment in rhodopsin. Mechanical properties of the segment can be assessed by xu, energetic properties of the segment can be assessed by ΔGu and kinetic properties can be assessed by ku. Adapted from ref. [37] Copyright (2014) and ref. [39] Copyright (2010), with permissions from Elsevier and American Chemical Society (ACS), respectively.
Figure 11.
Figure 11.
A) Example of force-distance curve obtained from unfolding rhodopsin from ROS disc membranes. Force peaks are fit with the worm-like-chain model to determine how many amino acid residues are stretched above the sample surface. Each force peak represents the force required to unfold a stable structural segment. B) Stable structural segments corresponding to peaks in A are colored on the secondary structure of rhodopsin. Adapted from ref. [39] Copyright (2010), with permissions from American Chemical Society (ACS).
Figure 12.
Figure 12.
AFM-based stiffness mapping of a ROS disc membrane. (A) AFM Deflection image of a ROS disc membrane is shown. The mica surface (1), rim region (2), lamellar region with rhodopsin nanodomains (3), and lipid bilayer (4) are noted. Scale bar, 500 nm. (B) Stiffness mapping data in terms of Young’s moduli, experimentally determined for the ROS disc membrane shown in (A). Reproduced from ref. [40] Copyright (2019), with permissions from American Chemical Society (ACS).
Figure 13.
Figure 13.
Young’s modulus maps of rhodopsin nanodomains in the dark state and after photobleaching, present in the ROS disc membranes isolated from B6 mice (A), Rpe65−/− mice (B), homozygous G90D rhodopsin (RhoG90D/G90D or Rho-G90D+/+) mice (C), or heterozygous G90D rhodopsin (RhoG90D/+ or Rho-G90D+/−) mice (D). The left and right map represents Young’s modulus of rhodopsin nanodomains investigated under dark conditions and after photobleaching, respectively. Scale bar, 5 nm. Histograms generated from mean Young’s modulus data obtained under dark conditions or after photobleaching are presented in blue and red, respectively and were fitted with a Gaussian function. Adapted from ref. [40] Copyright (2019), with permissions from American Chemical Society (ACS).
Figure 14.
Figure 14.
Proposed models of receptor activation to describe low levels of constitutive activity. (A) In the classical two-state model, the receptor exists in equilibrium between a single inactive state (blue) and a single active state (red). A small population of receptors adopting an active state results in low levels of constitutive activity. Based on the activity-stiffness correlation, Young’s modulus histograms are expected to exhibit a major population corresponding to an inactive state and a minor population corresponding to an active state (black line). The dashed red line represents the case of all receptors adopting an active conformation. (B) In multistate models, the receptor can adopt multiple active states (red and pink) in either a nonsequential or sequential manner. Low constitutive activity can result from a shift of the equilibrium to a low-activity active state (pink). In this case, Young’s modulus histograms are predicted to exhibit a single population of receptors in the active conformation (black line), as can be seen in the experimentally determined data. The dashed blue line represents the case of all receptors adopting an inactive conformation. Reproduced from ref. [40] Copyright (2019), with permissions from American Chemical Society (ACS).

Similar articles

Cited by

References

    1. Latorraca NR, Venkatakrishnan AJ, Dror RO, Chem. Rev. 2017, 117, 139–155, 10.1021/acs.chemrev.6b00177. - DOI - PubMed
    1. Syrovatkina V, Alegre KO, Dey R, Huang XY, J. Mol. Biol. 2016, 428, 3850–68, 10.1016/j.jmb.2016.08.002. - DOI - PMC - PubMed
    1. Fredriksson R, Lagerstrom MC, Lundin LG, Schioth HB, Mol. Pharmacol. 2003, 63, 1256–72, 10.1124/mol.63.6.1256. - DOI - PubMed
    1. Pierce KL, Premont RT, Lefkowitz RJ, Nat. Rev. Mol. Cell Biol. 2002, 3, 639–50, 10.1038/nrm908. - DOI - PubMed
    1. Rosenbaum DM, Rasmussen SG, Kobilka BK, Nature 2009, 459, 356–63, 10.1038/nature08144. - DOI - PMC - PubMed

MeSH terms

LinkOut - more resources