

Telomere DNA length regulation is influenced by seasonal temperature differences in short-lived but not in long-lived reef-building corals
- PMID: 37263999
- PMCID: PMC10235076
- DOI: 10.1038/s41467-023-38499-1
Telomere DNA length regulation is influenced by seasonal temperature differences in short-lived but not in long-lived reef-building corals
Abstract
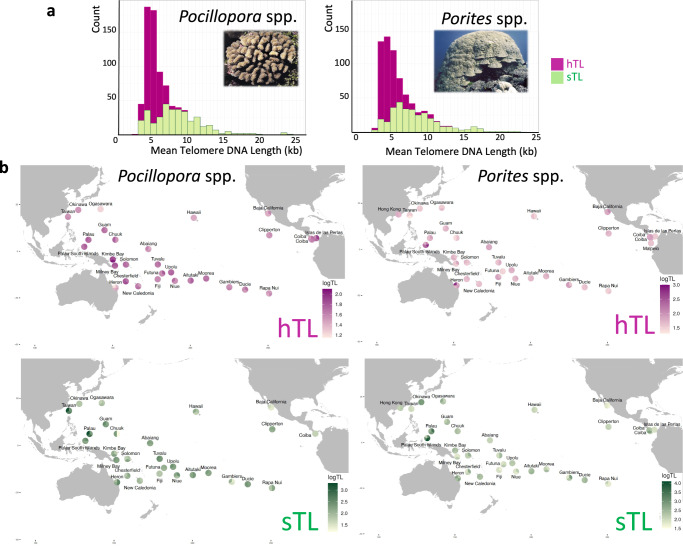
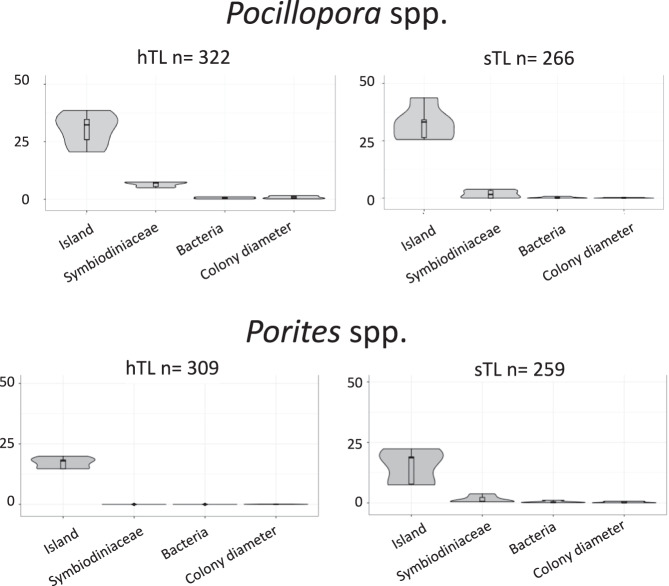
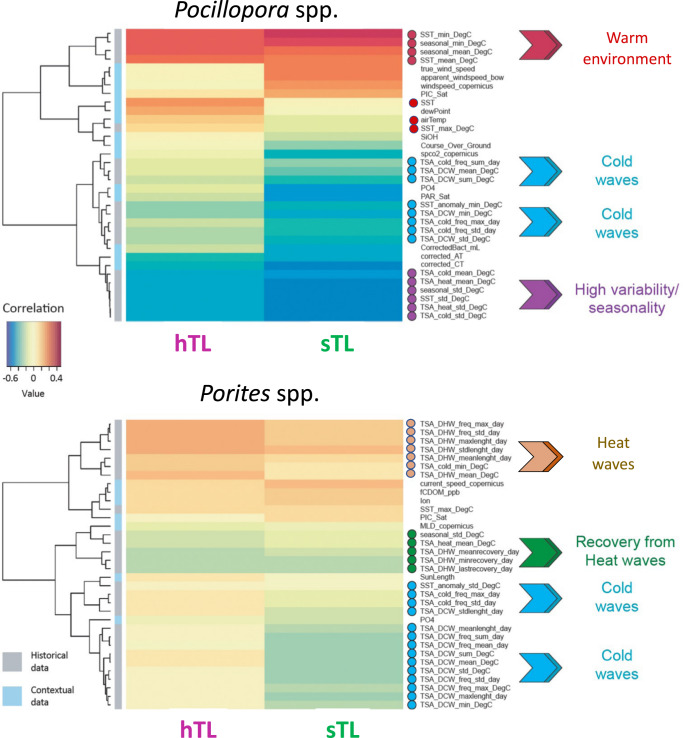
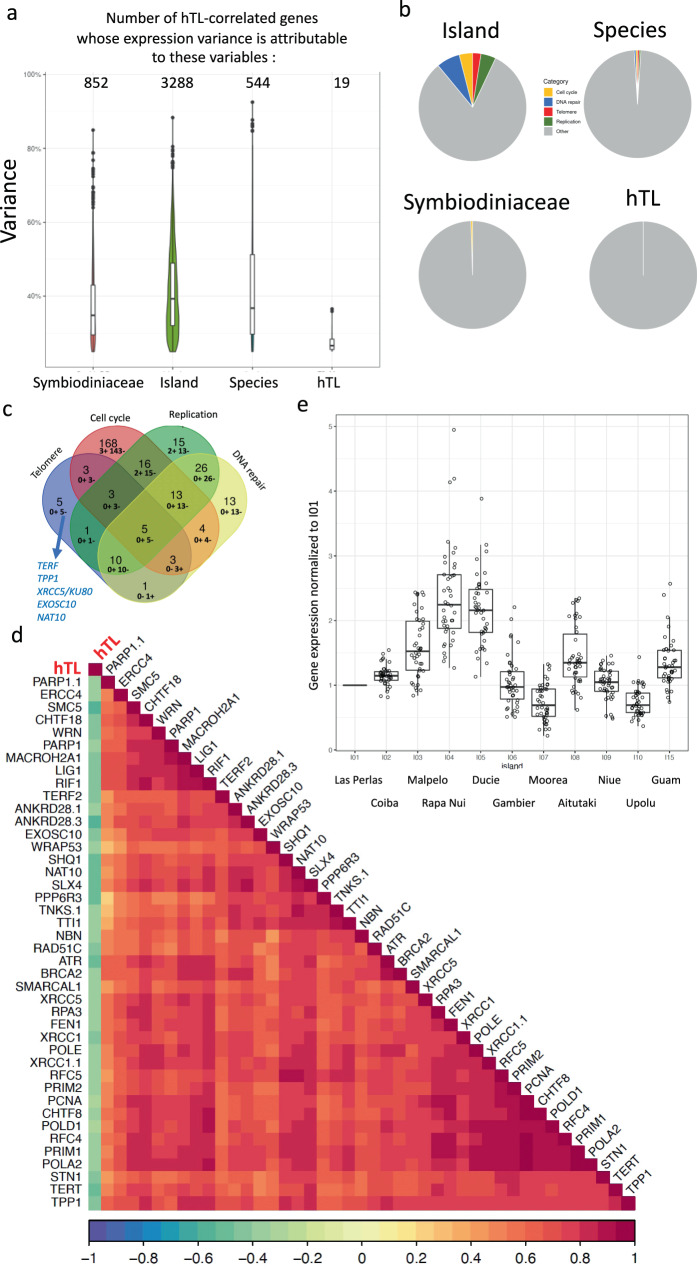
Telomeres are environment-sensitive regulators of health and aging. Here,we present telomere DNA length analysis of two reef-building coral genera revealing that the long- and short-term water thermal regime is a key driver of between-colony variation across the Pacific Ocean. Notably, there are differences between the two studied genera. The telomere DNA lengths of the short-lived, more stress-sensitive Pocillopora spp. colonies were largely determined by seasonal temperature variation, whereas those of the long-lived, more stress-resistant Porites spp. colonies were insensitive to seasonal patterns, but rather influenced by past thermal anomalies. These results reveal marked differences in telomere DNA length regulation between two evolutionary distant coral genera exhibiting specific life-history traits. We propose that environmentally regulated mechanisms of telomere maintenance are linked to organismal performances, a matter of paramount importance considering the effects of climate change on health.
© 2023. The Author(s).
Conflict of interest statement
The authors declare no competing interests.
Figures
Similar articles
-
Baseline dynamics of Symbiodiniaceae genera and photochemical efficiency in corals from reefs with different thermal histories.PeerJ. 2023 Jun 1;11:e15421. doi: 10.7717/peerj.15421. eCollection 2023. PeerJ. 2023. PMID: 37283898 Free PMC article.
-
Different functional traits among closely related algal symbionts dictate stress endurance for vital Indo-Pacific reef-building corals.Glob Chang Biol. 2021 Oct;27(20):5295-5309. doi: 10.1111/gcb.15799. Epub 2021 Aug 2. Glob Chang Biol. 2021. PMID: 34255912 Free PMC article.
-
Sensitivity of calcification to thermal stress varies among genera of massive reef-building corals.PLoS One. 2012;7(3):e32859. doi: 10.1371/journal.pone.0032859. Epub 2012 Mar 1. PLoS One. 2012. PMID: 22396797 Free PMC article.
-
Resilience in reef-building corals: The ecological and evolutionary importance of the host response to thermal stress.Mol Ecol. 2020 Feb;29(3):448-465. doi: 10.1111/mec.15337. Epub 2020 Jan 14. Mol Ecol. 2020. PMID: 31845413 Review.
-
Environmental impacts of dredging and other sediment disturbances on corals: a review.Mar Pollut Bull. 2012 Sep;64(9):1737-65. doi: 10.1016/j.marpolbul.2012.05.008. Epub 2012 Jun 7. Mar Pollut Bull. 2012. PMID: 22682583 Review.
Cited by
-
Insights and achievements from the Tara Pacific expedition.Nat Commun. 2023 Jun 1;14(1):3131. doi: 10.1038/s41467-023-38896-6. Nat Commun. 2023. PMID: 37264031 Free PMC article.
-
Pervasive tandem duplications and convergent evolution shape coral genomes.Genome Biol. 2023 Jun 1;24(1):123. doi: 10.1186/s13059-023-02960-7. Genome Biol. 2023. PMID: 37264421 Free PMC article.
-
Reproductive aging weakens offspring survival and constrains the telomerase response to herpesvirus in Pacific oysters.Sci Adv. 2024 Sep 13;10(37):eadq2311. doi: 10.1126/sciadv.adq2311. Epub 2024 Sep 11. Sci Adv. 2024. PMID: 39259784 Free PMC article.
-
Acclimation during Embryogenesis Remodulates Telomerase Activity and Gene Expression in Baikal Whitefish Larvae, Mitigating the Effects of Acute Temperature Stress.Animals (Basel). 2024 Oct 2;14(19):2839. doi: 10.3390/ani14192839. Animals (Basel). 2024. PMID: 39409788 Free PMC article.
-
Linking telomere dynamics to evolution, life history and environmental change: perspectives, predictions and problems.Biogerontology. 2024 Apr;25(2):301-311. doi: 10.1007/s10522-023-10081-8. Epub 2024 Jan 22. Biogerontology. 2024. PMID: 38252370 Free PMC article. Review.
References
Publication types
MeSH terms
Substances
LinkOut - more resources
Full Text Sources
Miscellaneous
