. 2023 May 31;19(5):e1011359.
doi: 10.1371/journal.ppat.1011359. eCollection 2023 May.

Viral vector delivered immunogen focuses HIV-1 antibody specificity and increases durability of the circulating antibody recall response

Affiliations

Viral vector delivered immunogen focuses HIV-1 antibody specificity and increases durability of the circulating antibody recall response

LaTonya D Williams et al. PLoS Pathog. .

Abstract

The modestly efficacious HIV-1 vaccine regimen (RV144) conferred 31% vaccine efficacy at 3 years following the four-shot immunization series, coupled with rapid waning of putative immune correlates of decreased infection risk. New strategies to increase magnitude and durability of protective immunity are critically needed. The RV305 HIV-1 clinical trial evaluated the immunological impact of a follow-up boost of HIV-1-uninfected RV144 recipients after 6-8 years with RV144 immunogens (ALVAC-HIV alone, AIDSVAX B/E gp120 alone, or ALVAC-HIV + AIDSVAX B/E gp120). Previous reports demonstrated that this regimen elicited higher binding, antibody Fc function, and cellular responses than the primary RV144 regimen. However, the impact of the canarypox viral vector in driving antibody specificity, breadth, durability and function is unknown. We performed a follow-up analysis of humoral responses elicited in RV305 to determine the impact of the different booster immunogens on HIV-1 epitope specificity, antibody subclass, isotype, and Fc effector functions. Importantly, we observed that the ALVAC vaccine component directly contributed to improved breadth, function, and durability of vaccine-elicited antibody responses. Extended boosts in RV305 increased circulating antibody concentration and coverage of heterologous HIV-1 strains by V1V2-specific antibodies above estimated protective levels observed in RV144. Antibody Fc effector functions, specifically antibody-dependent cellular cytotoxicity and phagocytosis, were boosted to higher levels than was achieved in RV144. V1V2 Env IgG3, a correlate of lower HIV-1 risk, was not increased; plasma Env IgA (specifically IgA1), a correlate of increased HIV-1 risk, was elevated. The quality of the circulating polyclonal antibody response changed with each booster immunization. Remarkably, the ALVAC-HIV booster immunogen induced antibody responses post-second boost, indicating that the viral vector immunogen can be utilized to selectively enhance immune correlates of decreased HIV-1 risk. These results reveal a complex dynamic of HIV-1 immunity post-vaccination that may require careful balancing to achieve protective immunity in the vaccinated population. Trial registration: RV305 clinical trial (ClinicalTrials.gov number, NCT01435135). ClinicalTrials.gov Identifier: NCT00223080.


Conflict of interest statement

The authors have declared that no competing interests exist.

Figures
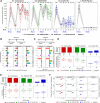
Fig 1
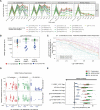
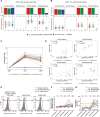
Fig 1. ALVAC-HIV elicits V2, V3, and CD4 inducible (CD4i) binding antibody responses.
(A) Magnitude and kinetics of plasma IgG to A244 D11 gp120 (vaccine strain boost immunogen) measured by BAMA in 70 RV305 participants at RV144 weeks 0 (pre-vaccination) and 26 (2 weeks post final RV144 vaccination) and RV305 weeks 0 (RV305 baseline; time point of first RV305 boost), 2 (two weeks post RV305 first boost), 24 (time point of second RV305 boost), 26 (two weeks post second RV305 boost), 48 (6 months post second boost), and 72 (1 year post second boost). IgG BAMA response magnitude is expressed as mean fluorescence intensity (MFI) after blank bead subtraction (MFI-Blank). Red, Combination group (ALVAC-HIV + AIDSVAX B/E) (n = 20 vaccinees); green, AIDSVAX B/E only group (n = 18 vaccinees); blue, ALVAC-HIV only group (n = 19 vaccinees); black, RV305 placebo group (RV144 vaccinees administered RV305 placebo) (n = 13 participants). Boxplots depict the median (midline) and 25th and 75th percentiles, with the colored symbols indicating the response for a single participant measured at a 1:50 dilution. Open gray triangles indicate negative responders. Gray lines connect the response from a single participant between time points. Response rates at each time point are shown at the top of each plot.(B) Log2 fold difference in post second boost (RV305 week 26) / post first boost (RV305 week 2) plasma IgG binding to linear epitopes in C1.2, V2 hotspot (V2.hs), V3, and C5.2 within AE.A244 and AE.TH023 gp120 assessed by peptide microarray mapping assay. Horizontal bar pointing to the left of the x = 0 line (solid black vertical line) indicates a higher response magnitude measured at RV305 week 2 compared to RV305 week 26; horizontal bar pointing the right indicates a higher response magnitude measured at RV305 week 26 versus RV305 week 2. (C) Log2 fold difference in Combination (ALVAC-HIV + AIDSVAX B/E) group / AIDSVAX B/E only group plasma IgG binding to linear epitopes in C1.2, V2.hs, V3, and C5.2 within AE.A244 gp120 and AE.92TH023 gp120 assessed by peptide microarray mapping assay. Horizontal bar pointing to the left of the x = 0 line at indicates a higher response magnitude measured in the AIDSVAX B/E only group; horizontal bar pointing to the right indicates a higher response magnitude measured in the Combination group. (D) Response rate and magnitude of post first boost (RV305 week 2) and post second (RV305 week 26) boost plasma IgG binding to linear AE.A244 V2.hs. The number of positive responders is shown over the total number of individuals analyzed at each time point, represented as a bar graph displaying percent responders. Box plots depict the median (midline) and 25th and 75th percentiles, with the colored symbols indicating the epitope mapping response magnitude for a single participant. (E) Response rate and magnitude of plasma IgG binding to AE.A244 V3 linear peptide. (F) Prevalence of CD4-induced (CD4i) IgG antibodies among RV305 participants. Differential binding plots displaying BAMA MFI-Blank values for IgG binding to YU2 gp120 WT (y-axis) and YU2 gp120 I420R mutant (x-axis) proteins at RV144 week 26 and RV305 weeks 0, 2, and 26. The diagonal dashed gray line indicates a wild-type to mutant binding ratio of 2.5 (cut-off for positivity). The CD4-induced (CD4i) monoclonal antibody 17b was used as a positive control for YU2 gp120 WT/I420R differential binding. Colored symbols represent positive responders with differential binding ratios of ≥ 2.5, indicating the presence of CD4i specificities. Response rate (percent responders over the total number of participants analyzed) is shown at the top of each plot.
Fig 2
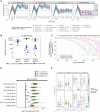
Fig 2. Delayed boosting with ALVAC-HIV/AIDSVAX B/E or AIDSVAX B/E increases V1V2-specific IgG concentration and breadth.
(A) Longitudinal plasma IgG binding antibody responses to AE.A244 V1V2 tags (V1V2 from RV144 vaccine boost–A244 gp120) and a panel of 16 geographically and genetically diverse gp70 V1V2 scaffold proteins representing global HIV-1 diversity determined by BAMA. Group median MFI among positive responders is plotted for each strain, color-coded by HIV-1 subtype; blue, clade A; red, CRF01_AE; purple, clade B; gray, CRF01_BC, green, clade C. Dotted black horizontal line, showing MFI equal to 100 indicates the minimum threshold for positivity for individual samples. (B) BAMA IgG breadth scores for binding to the gp70 V1V2 breadth panel. Scores were calculated based on averaging the mean fluorescence intensities (MFIs) of the individual antigens in the panel. Each symbol represents the breadth score for a single vaccine recipient. Red, Combination group (ALVAC-HIV + AIDSVAX B/E); green, AIDSVAX B/E only group; blue, ALVAC-HIV only group. Boxplots depict the median (midline) and 25th and 75th percentiles for the Combination (ALVAC-HIV/AIDSVAX B/E) and AIDSVAX B/E only groups. Differences in breadth scores between RV144 and RV305 post boost time points was assessed using the two-sided Wilcoxon Signed Rank test, combining data for Combination and AIDSVAX B/E only groups (Table 1). (C) Magnitude-breadth (MB) plot showing the number of antigens in the V1V2 panel (n = 16) with positive binding (breadth) (y-axis) at a given response magnitude (log10 binding antibody MFI) (x-axis) among positive responders in the Combination (ALVAC-HIV + AIDSVAX B/E) and AIDSVAX B/E only groups. Dashed lines display MB curves for each individual plasma sample measured at RV144 week 26 (turquoise), RV305 week 2 (pink), and RV305 week 26 (orange). Solid bold lines show the median MB among positive responders at each immunization time point. AUC values summarize the MB at a given time point across the entire range of MFI values. (D) Plasma IgG concentrations to V1V2 antigens associated with RV144 vaccine efficacy extrapolated by 4-parameter logistic (4-PL) regression of V2-specific monoclonal antibody CH58 standard curve titrations run in each BAMA. Concentrations are plotted in μg/mL for positive responders in each group across the studied immunogenicity time points, with each dot representing the concentration for a single plasma sample. The midline of the box plot denotes the median concentration, and the ends of the box plot denote the 25th and 75th percentiles among positive responses. (E) Durability of V1V2 IgG responses. Fold decline in binding V1V2 IgG MFI between 2 weeks after the last RV305 boost (week 26) to 12 months post last boost (week 72). Results are presented as log2 fold change, with the midline of the box plots indicating median and ends of the box plots indicating the 25th and 75th percentiles. The whiskers denote the minimum and maximum data points no more than 1.5 times the interquartile range (IQR). Black dots represent data points that lie outside of the median ± 1.5 times the IQR. Criteria for the fold (wk26/wk72) calculation: 1) response is positive at week 26, 2) MFI < 23000 at week 26, 3) MFI > 100 at week 72. Antigens with greater than or equal to 6 data points meeting this criteria for both the Combination (ALVAC-HIV/AIDSVAX B/E) and AIDSVAX B/E only groups are plotted for each vaccine boost regimen. Proximity of the bar to the y-axis indicates better durability.
Fig 3
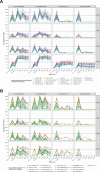
Fig 3. Delayed boosting with ALVAC-HIV/AIDSVAX B/E or AIDSVAX B/E increases breadth of Env-specific IgG response.
(A) Kinetics of plasma IgG responses in RV305 vaccine recipients to vaccine strain (92TH023 gp120, A244 gp120, and MN gp120) and gp120 (n = 8) and gp140 (n = 8) Env breadth panel antigens representing genetic and geographic HIV-1 diversity. Group median BAMA MFI binding values among positive responders, color coded by HIV-1 subtype, are shown for two RV144 and 6 RV305 sampling time points; blue, clade A; red, CRF01_AE; purple, clade B; gray, CRF01_BC, green, clade C. (B) BAMA IgG breadth scores to the gp140 Env breadth panel at RV144 and RV305 post boost time points. Box and whisker plots show the median and interquartile ranges of scores across the Combination and AIDSVAX B/E only groups. Comparison of median breadth scores (aggregated for the Combination and AIDSVAX B/E only groups) across post RV144 boost (week 26) and RV305 boost time points (weeks 2 and 26) were performed using the two-sided Wilcoxon Signed Rank Test (Table 1). (C) Magnitude-breadth plot of IgG binding antibody responses to the gp140 breadth panel among Combination and AIDSVAX B/E only positive responders at 2 weeks post final RV144 vaccination (week 26) and 2 weeks post first and second RV305 boosts (weeks 2 and 26). Breadth is defined as the proportion of antigens in the 8 antigen gp140 breadth panel (y-axis) with log10 (MFI-Blank) greater than the threshold on the x-axis. Dashed lines display MB curves for each individual plasma sample measured at RV144 week 26 (turquoise), RV305 week 2 (pink), and RV305 week 26 (orange). Solid bold lines show the median MB among positive responders at each immunization time point. AUC values summarize the MB at a given time point across the entire range of MFI values. (D) Durability of Env gp140 IgG responses. Fold decline in IgG antibody binding magnitude to gp140 antigens from two weeks post last RV305 boost (week 26) to 12 months post last boost (week 72). Results are presented as log2 fold change, with the midline of the box plots indicating median and ends of the box plots indicating the 25th and 75th percentiles. The whiskers denote the minimum and maximum data points no more than 1.5 times the interquartile range (IQR). Data points that lie outside of the median ± 1.5 times the IQR are shown as black dots. Criteria for the fold (wk26/wk72) calculation: 1) response is positive at week 26, 2) MFI < 23000 at week 26, 3) MFI > 100 at week 72. Antigens with greater than or equal to 6 data points meeting this criteria for both the Combination (ALVAC-HIV/AIDSVAX B/E) and AIDSVAX B/E only groups are plotted for each vaccine boost regimen. Proximity of the bar to the y-axis indicates better durability. (E) Magnitude-breadth scores across C1.2, V2 hotspot (V2.hs), V3, and C5.2 linear epitopes in gp120 calculated as weighted means, using a hierchical clustering tree method (R package “mdw”) for binding to all strains with a positivity rate of >20% for any time point for each epitope. Box plots depict the median (midline) and 25th and 75th percentiles, with each symbol, color coded by group, indicating the epitope mapping breadth score for a single participant.
Fig 4
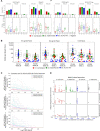
Fig 4. Binding antibody multiplex assay plasma IgG subclass (IgG1-IgG4) responses.
Plasma from a subset of 70 RV305 recipients was tested for IgG1-IgG4 subclass binding to (A) vaccine strain immunogens (92TH023, A244 gp120, MN gp120), gp120 (n = 8) and gp140 (n = 8) Env breadth panel and (B) V1V2 (n = 16) breadth panel antigens and to AE.A244 V1V2 tags. Group median BAMA MFI is shown at each time point. Dotted black horizontal line, showing MFI equal to 100 indicates the minimum threshold for positivity for individual samples.
Fig 5
Fig 5. Delayed boost lowers IgG3.
(A) Response rate (top panel) and response magnitude (bottom panel) for HIV-1 envelope-specific IgG3 in plasma at two weeks post final RV144 vaccination (week 26) and two weeks post first and second RV305 boosts (weeks 2 and 26, respectively) against four vaccine-matched antigens (A244 D11 gp120, MN gp120, 92TH023 gp120, and AE.A244 V1V2 tags) identified as primary immune variables. The number of positive responders is shown over the total number of individuals analyzed at each time point, represented as a bar graph displaying percent responders. Box plots depict the median (midline) and 25th and 75th percentiles, with the colored symbols indicating the BAMA IgG3 response magnitude for a single participant expressed as MFI. Open gray triangles depict negative responders. (B) IgG3 breadth scores, defined as the mean of IgG3 responses to Env gp120, gp140, and gp70 V1V2 breadth panel antigens (panel size = 8, 8, and 16 antigens, respectively), are shown for RV144 week 26 and RV305 weeks 2 and 26. Each symbol represents the breadth score for a single participant. Red, Combination (ALVAC-HIV + AIDSVAX B/E) group; green, AIDSVAX B/E only group; blue, ALVAC-HIV only group. Box plots show the distribution of breadth scores among Combination and AIDSVAX B/E only boost recipients, displaying the median (midline), 25th and 75th percentiles. (C) Magnitude breadth (MB) plots of IgG3 binding antibody responses to the gp70 V1V2 breadth panel (top plot), gp120 breadth panel (middle plot), and gp140 breadth panel (bottom plot) measured at RV144 week 26 (turquoise), RV305 week 2 (pink), and RV305 week 26 (orange) for positive responders that received ALVAC-HIV + AIDSVAX B/E or AIDSVAX B/E only boosts. The y-axes depicts breadth (number of antigens in a given panel with positive response, depicted as a percentage) at a given response magnitude (log 10 binding antibody MFI) across the x-axes. Sample-specific and group averaged MB curves are represented by dashed and solid lines, respectively. AUC values summarize the MB profile at a given time point across the entire range of binding values across the x-axis. (D) Concentration of IgG3 antibodies to three V1V2 antigens associated with decreased HIV-1 risk in RV144 plotted for BAMA positive responders by vaccine group across longitudinal RV144 and RV305 time points. V2-specific microgram per milliter (μg/ml) equivalent concentrations for each plasma sample were quantified by 4 parameter logistic (4PL) regression based on standard curve titration of the IgG3 V2-specific monoclonal antibody CH58 curves run in each BAMA. Each symbol represents the concentration for a single plasma sample. The midline of the box plot denotes the median concentration, and the ends of the box plot denote the 25th and 75th percentiles among positive responses.
Fig 6
Fig 6. Delayed boost increases IgG4 and IgA1.
(A) HIV-1-specific plasma IgG4 levels to vaccine-matched gp120 Envelope (A244 D11 gp120, MN gp120, 92TH023 gp120) and V1V2 (AE.A244 V1V2 tags) primary antigens determined by BAMA. Response rates (top panel) and binding magnitudes (bottom panel) are plotted for each group at two weeks post final RV144 vaccination (week 26) and two weeks post first and second RV305 boosts (weeks 2 and 26, respectively). Box plots (bottom panel) denote the median (midline) and interquartile ranges among positive responses. Solid dots depict positive responders, and open gray triangles depict non responders. (B) BAMA analysis of plasma IgA1 subclass levels in 32 randomly selected RV305 vaccinees (n = 12, 8, and 12 in groups 1, 2, and 3, respectively) against a panel of 5 Envelope proteins encompassing vaccine immunogens (A244 D11 gp120, MN gp120, 92TH023 gp120), 00MSA gp140, and clade A consensus (A.con.env03 gp140) proteins. Response rates (top panel) and binding magnitudes (bottom panel) are plotted for each group at two weeks post final RV144 vaccination (week 26) and two weeks post first and second RV305 boosts (weeks 2 and 26, respectively). Box plots (bottom panel) denote the median (midline) and interquartile ranges among positive responses. Solid dots depict positive responders, and open gray triangles depict non responders.
Fig 7
Fig 7. Antibody-dependent cellular phagocytosis (ADCP) is boosted by RV305 vaccination and is associated with IgG1 binding response.
Plasma antibody-mediated uptake of (A) Con S gp140 or (B) A244 gp120-conjugated fluorescent beads in THP-1 cells was quantified by flow cytometry for vaccinees in the down-selected set of 70 RV305 participants. Top panels in A and B show the number of responders over the total number of participants analyzed whereas bottom panels denote the mean phagocytosis score per group at RV144 peak immunogenicity (week 26), RV305 baseline (week 0) and post boost time points (weeks 2 and 26). The box plots show the distribution of positive responses, with the mid-line denoting the median and the ends of the boxplot denoting the 25th and 75th percentiles. Data are representative of two independent experiments. (C) Phagocytosis AUC was calculated for a subset of 38 vaccinees (n = 14, 11, and 13 in groups 1, 2, and 3, respectively) whose plasma was tested for Con S gp140 ADCP. AUC for ADCP scores from a 5 point, 5-fold dose response curve from 50 μg/ml to 0.08 μg/ml is shown. (D) Spearman correlations between Con S gp140 phagocytosis AUC and IgG1 or IgG4 Con S gp140 BAMA MFI (aggregated for Combination and AIDSVAX B/E only groups) at RV305 week 2 and week 26; two-sided P values are shown for Spearman’s rho correlation coefficients. IgG2 and IgG3 binding levels were too low to perform correlation analysis. (E) Representative histograms of HIV-1CM235Tomato virion internalization by primary monocytes in the presence of Ab8367, a gp120-specific native IgG3 monoclonal antibody (mAb) isolated from a RV305 vaccinee by antigen-specific single memory B cell sorting. Ab8367 IgG1 and IgG3 recombinant mAbs mediated phagocytosis, showing greater potency when expressed as IgG3 (middle panel) compared to IgG1 (right panel). Red lines represent antibody-mediated internalization of virions; black lines represent internalization of virions in the absence of antibody. The shaded gray region represents the negative control in the absence of virus. The influenza hemagglutinin (HA)-specific broadly neutralizing antibody CH65 IgG3 was used as a negative control. Data are representative of two independent experiments. (F) Purified plasma IgG from 15 RV305 vaccine recipients (n = 5 in each group) was tested for antibody-mediated HIV-192TH023-Tomato virion internalization in primary monocytes, analyzed across RV144 and RV305 baseline and immunogenicity time points by flow cytometry. Each solid line, color coded by vaccination group, represents one vaccinee. The horizontal dashed black line denotes the threshold for positivity. Response rates at each time point are shown at the top of the graph. (G) HIV-192TH023 infectious virion capture was measured in 15 RV305 vaccinees (n = 5 in each group) using purified IgG from longitudinal plasma samples. The horizontal dashed black line represents the threshold for positivity. Each solid line represents one vaccinee. The percentage of vaccinees with vaccine-elicited antibodies capable of infectious virion capture is shown at the top of the graph for each time point.
Fig 8
Fig 8. Antibody-dependent cellular cytotoxicity (ADCC) of HIV-1-infected target cells is boosted by RV305 vaccination.
Plasma samples from 70 participants, drawn at RV305 study enrollment (week 0) and 2 weeks after the first and second RV305 boosts (weeks 2 and 26, respectively), were serially diluted and tested for ADCC-mediating antibody responses against (A) HIV-1 AE.TH023 (RV144 vaccine strain prime), (B) AE.CM235 (RV144 vaccine strain boost), and (C) AE.427299 (infected RV144 placebo strain)-infected CEM.NKRCCR5 target cells using the luciferase ADCC assay. Results are reported as AUC fold change from week 0 (bottom panel), and response rates are shown in the top panel. Box plots depict the distribution of AUC fold change values, with the midline denoting the median and ends of the box plot representing the interquartile range. Each dot represents one sample, with the gray lines connecting samples from the same donor. Solid dots indicate positive responders, and open gray triangles indicate non-responders.
Fig 9
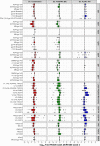
Fig 9. Fold change in humoral and cellular response magnitudes from RV305 week 2 to week 26.
The fold change in magnitude of humoral and cellular immune measurements (n = 54) from 2 weeks post first boost (week 2) to 2 weeks post second boost (week 26) was calculated for each participant (n = 70) and then log 10 transformed. Measurements were grouped by generalized features (BAMA IgG, IgG1, IgG2, IgG3, IgG4, IgA, IgA1, linear peptide microarray binding, CD4 and CD8 T cell polyfunctionality, neutralizing antibody (nAb), ADCC, or ADCP effector functions) indicated by the gray bars on the right. The boxplots span the 25th percentile to the 75th percentile, with a black bar at the median. Whiskers extend from the greater of the minimum data point and median—1.5 times the interquartile range (IQR) to the lesser of the maximum data point and median + 1.5 times the IQR, where IQR = 75th-25th percentile. Data points that lie outside of the median ± 1.5 times the IQR are shown as black dots. Horizontal bar pointing to the left of the x = 0 line indicates a higher response magnitude measured at RV305 week 2 compared to RV305 week 26; horizontal bar pointing to the right of the x = 0 line indicates a higher response magnitude measured at RV305 week 26 compared to RV305 week 2.
Fig 10
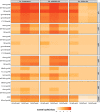
Fig 10. Addition of a boost improved anti-viral immunity associated with correlates of HIV-1 risk.
Heatmap of 28 immune response variables longitudinally analyzed at RV144 peak immunogenicity (week 26) and two weeks post first and second RV305 boosts (weeks 2 and 26, respectively). All data was log10-transformed and then each variable [measurement type (BAMA MFI, BAMA breadth score, and ADCP score)] was scaled across participant, visit, antigen, and in the case of BAMA isotype/subclass for vaccinees in the down-selected set of 70 RV305 participants. The median of the scaled values are plotted by visit and treatment group, ordered by assay type [BAMA (IgG, IgG1, IgG3, IgG4, IgA, IgA1), and antigen-conjugated bead antibody-dependent phagocytosis (ADCP)]; scaling precludes comparison of variables with each other, but variables can be compared across groups and visits. Columns designate immunogenicity time points whereas rows represent immune measurements. Color intensity is directly proportional to response magnitude, with the darker colors indicating higher magnitudes and the lighter colors indicating lower magnitudes.

Similar articles

Cited by

References

    1. Rerks-Ngarm S, Pitisuttithum P, Nitayaphan S, Kaewkungwal J, Chiu J, Paris R, et al.. Vaccination with ALVAC and AIDSVAX to prevent HIV-1 infection in Thailand. The New England journal of medicine. 2009;361(23):2209–20. doi: 10.1056/NEJMoa0908492 . - DOI - PubMed
    1. Haynes BF, Gilbert PB, McElrath MJ, Zolla-Pazner S, Tomaras GD, Alam SM, et al.. Immune-correlates analysis of an HIV-1 vaccine efficacy trial. N Engl J Med. 2012;366(14):1275–86. doi: 10.1056/NEJMoa1113425 ; PubMed Central PMCID: PMC3371689. - DOI - PMC - PubMed
    1. Robb ML, Rerks-Ngarm S, Nitayaphan S, Pitisuttithum P, Kaewkungwal J, Kunasol P, et al.. Risk behaviour and time as covariates for efficacy of the HIV vaccine regimen ALVAC-HIV (vCP1521) and AIDSVAX B/E: a post-hoc analysis of the Thai phase 3 efficacy trial RV 144. Lancet Infect Dis. 2012;12(7):531–7. doi: 10.1016/S1473-3099(12)70088-9 ; PubMed Central PMCID: PMC3530398. - DOI - PMC - PubMed
    1. Tomaras GD, Ferrari G, Shen X, Alam SM, Liao HX, Pollara J, et al.. Vaccine-induced plasma IgA specific for the C1 region of the HIV-1 envelope blocks binding and effector function of IgG. Proc Natl Acad Sci U S A. 2013;110(22):9019–24. doi: 10.1073/pnas.1301456110 ; PubMed Central PMCID: PMC3670311. - DOI - PMC - PubMed
    1. Gottardo R, Bailer RT, Korber BT, Gnanakaran S, Phillips J, Shen X, et al.. Plasma IgG to linear epitopes in the V2 and V3 regions of HIV-1 gp120 correlate with a reduced risk of infection in the RV144 vaccine efficacy trial. PLoS One. 2013;8(9):e75665. doi: 10.1371/journal.pone.0075665 ; PubMed Central PMCID: PMC3784573. - DOI - PMC - PubMed

Publication types

Associated data