. 2023 May 30;14(1):3128.
doi: 10.1038/s41467-023-37953-4.

Hydrogel-in-hydrogel live bioprinting for guidance and control of organoids and organotypic cultures

Affiliations

Hydrogel-in-hydrogel live bioprinting for guidance and control of organoids and organotypic cultures

Anna Urciuolo et al. Nat Commun. .

Abstract

Three-dimensional hydrogel-based organ-like cultures can be applied to study development, regeneration, and disease in vitro. However, the control of engineered hydrogel composition, mechanical properties and geometrical constraints tends to be restricted to the initial time of fabrication. Modulation of hydrogel characteristics over time and according to culture evolution is often not possible. Here, we overcome these limitations by developing a hydrogel-in-hydrogel live bioprinting approach that enables the dynamic fabrication of instructive hydrogel elements within pre-existing hydrogel-based organ-like cultures. This can be achieved by crosslinking photosensitive hydrogels via two-photon absorption at any time during culture. We show that instructive hydrogels guide neural axon directionality in growing organotypic spinal cords, and that hydrogel geometry and mechanical properties control differential cell migration in developing cancer organoids. Finally, we show that hydrogel constraints promote cell polarity in liver organoids, guide small intestinal organoid morphogenesis and control lung tip bifurcation according to the hydrogel composition and shape.


Conflict of interest statement

N.E. and O.G. have an equity stake in ONYEL Biotech s.r.l. A.U. and N.E. are inventors of a patent for the use of HCC- and CMM-hydrogels (patent applicant: ONYEL Biotech s.r.l.; patent number EP4138941). All other authors have no competing interests.

Figures
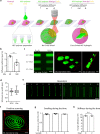
Fig. 1
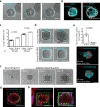
Fig. 1. Performance of hydrogel-in-hydrogel printing.
a Strategy and set-up for hydrogel-in-hydrogel live bioprinting. HCC-hydrogel 2P-printing can be performed within solid gel of a 3D organ-like culture at any experimentally required time point of cell growth by (i) allowing liquid HCC-polymers to diffuse within the pre-existing solid gel, (ii) fabricating 3D hydrogel objects by using a multiphoton microscope equipped with a motorized xyz stage and a femtosecond near-infrared tightly-focused pulsed laser emission, (iii) removing the un-crosslinked HCC-polymers from the 3D organ-like culture via diffusion. b Quantification of the diffusion coefficient of 40 (grey) or 500 (black) kDa FITC-dextrans within Matrigel. Data are shown as mean ± s.d. of three independent replicates; unequal variance Student’s t-test; *P < 0.0213. c Left, representative confocal z-stack images of sequentially fabricated HCC–gel hydrogels (green) within the same Matrigel drop and printed at different xyz positions by using near-infrared laser pulses through a multiphoton microscope; total Δz = 100 μm or 50 μm or 25 μm. Scale bars, 100 μm. Middle and right, 3D-volume reconstruction reveals the volumetric position of the various objects; coordinates are shown in red. d Quantification of the minimum line width obtained using scan or freeline scanning mode, respectively scan and line scan. Data are shown as mean ± s.d. of three independent replicates. e Multiple HCC–Gel structures of three independent replicates fabricated by near-infrared multiphoton laser pulses. Δz = 20 μm. Scale bar, 20 μm. f Representative 3D reconstruction of three independent replicates of a HCC–Gel spiral-shaped hydrogel fabricated using the free line-scan mode. Δz = 30 μm. Coordinates are shown in red; scale bar, 100 μm. g Quantification of the area of hydrogels sequentially fabricated at fixed laser power (1 mW) and wavelength (800 nm) within the same Matrigel drop; each hydrogel series was analyzed just after photo-crosslinking (day 0) or at 2 days after the last 3D bioprinting. Data are shown as mean ± s.d. of three independent replicates. h Young’s modulus measured by atomic force microscopy of hydrogels photo-crosslinked at fixed laser power (1 mW) and wavelength (800 nm). Each hydrogel series was analyzed just after photo-crosslinking (day 0) or at 2 days after the last 3D bioprinting. Data are shown as mean ± s.d. of three independent replicates; multiple comparison one-way ANOVA was used; n.s., not statistically significant.
Fig. 2
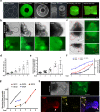
Fig. 2. Temporal control of hydrogel-in-hydrogel live bioprinting and controlled axon guidance of oSpCs.
a Confocal fluorescence images acquired at different ΔZ (Z0, Z1, Z3, Z4) and relative Z-stack imaging analysis showing the presence of hydrogels (blue) fabricated above the central body of the oSpC cultured in 3D matrigel droplet for 7 days before bioprinting. Phalloidin (green) was used to detect cellular projections. Scale bar, 100 μm. b Confocal fluorescence images acquired at different ΔZ (Z0, Z1) and relative Z-stack imaging analysis showing the presence of multiple hydrogels (blue) fabricated at different Z planes that embed alive (calcein-positive, green) cellular projections of the oSpC cultured in 3D matrigel droplet for 7 days before bioprinting. Scale bars, 100 μm. c Quantification of vital (calceine-positive) neuronal projections embedded within bioprinted hydrogel volume. Data are shown as mean ± s.d. of five independent replicates; unequal variance Student’s t-test was used; P < 0.05 was considered statistically significant. d Representative images showing integrity of single-line bioprinted hydrogel (blue) and vital (calcein-positive, green) cellular projection of the oSpC cultured in 3D matrigel droplet for 7 days before bioprinting. Scale bar, 10 μm. e Representative fluorescence images of a spinal cord culture showing alignment of axons protruding within fabricated hydrogel (i) as opposed to randomly oriented axon organization in absence of the hydrogel (ii). Scale bar, 200 μm. f Quantification of neural projection directionality performed in area where the neural projections were far (no bioprinting) or in proximity (bioprinted hydrogels) of the fabricated hydrogel-in-hydrogel structures.
Fig. 3
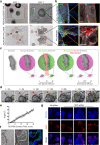
Fig. 3. Hydrogel-in-hydrogel live bioprinting for studying cancer cell migration in organoid 3D cultures.
a Brightfield time lap images (0, 8, 20 h) of a hydrogel-embedded tumor spheroid (day 6 post printing) growing within a cage of HCC-PEG pillars fabricated 1 day post organoid culture. Scale bar, 100 μm. b Fluorescent images of the tumor spheroid in c, showing different stages of cellular migration through the pillars day 7 post printing. Scale bars, 100 μm. c Young’s modulus measured by atomic force microscopy of 4-arm (black) or 8-arm (gray) HCC-PEG hydrogels photo-crosslinked at increasing laser power (300 or 500 μW) and wavelength (800 nm). Hydrogels were sequentially fabricated within the same Matrigel drop. Data are shown as mean ± s.d. of three independent replicates; all measurements performed are reported; unequal variance Student’s t-test was used; P < 0.05 was considered statistically significant. d Brightfield time lapse images of hydrogel-embedded tumor spheroid 5 or 7 days after bioprinting of 4-arm (upper panels) or 8-arm (lower panels) HCC-PEG pillars fabricated 1 day of organoid culture. Scale bars, 100 μm. e Quantification of nuclei detected out of the pillars of the hydrogel-embedded tumor spheroid 7 days after bioprinting of 4-arm (black) or 8-arm (gray) HCC-PEG pillars fabricated 1 day of organoid culture. Representative images of 3D reconstructions with xyz coordinates and 50 μm scale bar are shown. f Four-arm HCC-PEG hydrogel pillars were fabricated 1 day or 7 days post organoid culture (days 0 and 6 post printing, respectively) around a hydrogel-embedded growing tumor organoid. The brightfield images show the growth of the caged tumor spheroid at different time points. Scale bar, 100 μm. g Representative fluorescent image of tumor spheroid as in e at 14 days from first bioprinting step (day 15 of organoid culture). Scale bar, 100 μm. h Representative fluorescent images of cancer cells protruding through the bars of the first bioprinted hydrogel cage, invading the surrounding space and migrating through the pillars of the second fabrication step. Scale bars, 100 μm.
Fig. 4
Fig. 4. Supra-organoid driven intestinal organoid morphogenesis via hydrogel-in-hydrogel live bioprinting.
a Representative bright field and fluorescence images showing 60°primordial small intestine design and HCC-gel hydrogels (left panel, top view; right panel, 3D reconstruction view). Scale bars 200 μm. b Representative bright field (upper) and fluorescence (lower) images of mSIOs just after primordial small intestine HCC-gel hydrogel printing or 2, 4, 5 or 6 days of culture and bioprinting. Budding was observed according to the defied shape of the hydrogel. Scale bars 100 μm. c Representative bright field and fluorescence images showing mSIO buds invading multiple crypts at different Z-levels of the primordial small intestine design after 6 days of culture post-printing. Scale bar 200 μm. d Quantification of the ratio between the area of the organoid at day 0 of culture (dashed line) and the area of the organoid during the following culture days (1–6 days). Statistical analysis is shown in Supplementary Table 1. e Ratio between the central area of the primordial intestine-shaped hydrogels with the organoid at seeding time (dashed line) and the area occupied by the organoid from day 1–6 of culture. Statistical analysis is shown in Supplementary Table 2.f Quantification of the percentage of central area occupied by the mSIOs during the culture (0–6 days). Calculation of the percentage was shown for 5 independent mSIO cultures. g Quantification of the percentage of branched areas occupied by 5 independent mSIO during the cultures (4–9 days). h Upper panels, representative bright field (upper) and fluorescence (lower) images showing mSIO budding after 10 days of culture within the primordial small intestine-shaped HCC-gel hydrogel. The arrow points at the LGR5 (green) cells. Lower panels, representative images showing immunofluorescence analysis for OLM4 (red) (corresponding to the LGR5-GFP in (i) and FABP1 (yellow) of mSIO cultured for 10 days within the primordial small intestine-shaped HCC-gel hydrogel). Nuclei are stained with Hoechst (blue). The arrows point at the branched (red) or central (yellow) portion of the mSIO in respect to the hydrogel. Scale bars 100 μm (upper panels), 50 μm (lowe panels).
Fig. 5
Fig. 5. 3D geometrical constrains imposed by hydrogel-in-hydrogel live bioprinting on organoid and organotypic cultures.
a, b Induction of polarization in human fetal hepatocyte organoids. a Bright field images showing two printing strategies: distant walls not touching the growing organoid (above) and adjacent pillars touching the growing organoids (below) after 7 days of culture. Scale bar 100 µm. b Immunofluorescent panels showing non-polarized organoid distant from the printed structures (above) and a polarized organoid in correspondence of the printed pillars (below). Integrin beta-4 (INTβ4) shown in green, multidrug resistance-associated protein 2 (MRP2) shown in red, zonula occludens-1 (ZO-1) shown in cyan. Nuclei are stained with Hoechst (blue). Scale bars, 50 µm (large images, left) and 10 µm (higher magnification, right). cf Ex vivo culture of mesenchyme-free lung epithelium rudiments, isolated from embryonic mice at stage E12.5. c Schematic of isolated fetal lung tips ex vivo culture and guided branching morphogenesis following 2 P bioprinting of gelatin pillars (red circles) in Matrigel. d 5-h interval snapshots of time-lapse reconstruction of budding lung tip during guided morphogenesis around pillar (red circle, indicated by red arrow). See full time-lapse in Supplementary Video. 3. Scale bar 150 µm. e Plot showing angle of tip bifurcation vs time from tip-pillar contact time (time 0) to 24 h of culture. Data are shown as mean ± s.e.m. of 8 independent replicates. f Bright-field images and immunofluorescent panel showing lung tip branching in between two pillars (red circles) and inner (luminal) polarity maintained (F-actin, green). Nuclei are stained with Hoechst (blue). Scale bar 100 µm. g Immunofluorescent panel showing lung tip branching in between pillar (red circle) with downregulation of sox9 (red) in correspondence of the pillar. Nuclei are stained with Hoechst (blue). Scale bars 50 µm.

Similar articles

Cited by

References

    1. Rossi G, Manfrin A, Lutolf MP. Progress and potential in organoid research. Nat. Rev. Genet. 2018;19:671–687. doi: 10.1038/s41576-018-0051-9. - DOI - PubMed
    1. Shamir ER, Ewald AJ. Three-dimensional organotypic culture: experimental models of mammalian biology and disease. Nat. Rev. Mol. Cell Biol. 2014;15:647–664. doi: 10.1038/nrm3873. - DOI - PMC - PubMed
    1. Brassard JA, Lutolf MP. Engineering stem cell self-organization to build better organoids. Cell Stem Cell. 2019;24:860–876. doi: 10.1016/j.stem.2019.05.005. - DOI - PubMed
    1. Moysidou CM, Barberio C, Owens RM. Advances in engineering human tissue models. Front. Bioeng. Biotechnol. 2021;8:620962. doi: 10.3389/fbioe.2020.620962. - DOI - PMC - PubMed
    1. Park Y, Huh KM, Kang SW. Applications of biomaterials in 3d cell culture and contributions of 3d cell culture to drug development and basic biomedical research. Int. J. Mol. Sci. 2021;22:1–21. - PMC - PubMed

Publication types