. 2023 Jul 3;133(13):e169993.
doi: 10.1172/JCI169993.

Therapeutic targeting of metabolic vulnerabilities in cancers with MLL3/4-COMPASS epigenetic regulator mutations

Affiliations

Therapeutic targeting of metabolic vulnerabilities in cancers with MLL3/4-COMPASS epigenetic regulator mutations

Zibo Zhao et al. J Clin Invest. .

Abstract

Epigenetic status-altering mutations in chromatin-modifying enzymes are a feature of human diseases, including many cancers. However, the functional outcomes and cellular dependencies arising from these mutations remain unresolved. In this study, we investigated cellular dependencies, or vulnerabilities, that arise when enhancer function is compromised by loss of the frequently mutated COMPASS family members MLL3 and MLL4. CRISPR dropout screens in MLL3/4-depleted mouse embryonic stem cells (mESCs) revealed synthetic lethality upon suppression of purine and pyrimidine nucleotide synthesis pathways. Consistently, we observed a shift in metabolic activity toward increased purine synthesis in MLL3/4-KO mESCs. These cells also exhibited enhanced sensitivity to the purine synthesis inhibitor lometrexol, which induced a unique gene expression signature. RNA-Seq identified the top MLL3/4 target genes coinciding with suppression of purine metabolism, and tandem mass tag proteomic profiling further confirmed upregulation of purine synthesis in MLL3/4-KO cells. Mechanistically, we demonstrated that compensation by MLL1/COMPASS was underlying these effects. Finally, we demonstrated that tumors with MLL3 and/or MLL4 mutations were highly sensitive to lometrexol in vitro and in vivo, both in culture and in animal models of cancer. Our results depicted a targetable metabolic dependency arising from epigenetic factor deficiency, providing molecular insight to inform therapy for cancers with epigenetic alterations secondary to MLL3/4 COMPASS dysfunction.

Keywords: Colorectal cancer; Epigenetics; Genetics; Metabolism.


Conflict of interest statement

Conflict of interest: The authors have declared that no conflict of interest exists.

Figures

Figure 1
Figure 1. Genome-wide Screen Identifies Purine and Pyrimidine Synthesis Pathways as Essential for viability in MLL3/4-KO mESCs.
(A) Flowchart showing CRISPR KO-based dropout screening in WT and KO cells. (B) GO biological process pathway analysis (using MAGeCK) of the top 300 negatively selected genes in MLL3/4-KO cells. (C) Rank plot showing the distribution of negative RRA score with the scores of the 12 genes involved in purine/pyrimidine synthesis that were identified as essential in MLL3/4 KO. (D) β scores of gene essentiality were calculated for WT and KO cells. The 12 screen-identified genes involved in purine/pyrimidine synthesis are shown in the 9-square view. Orange, genes selectively essential in KO not WT; light purple, genes selectively essential in WT not KO; green, genes depletion of which enhanced survival in KO not WT; dark purple, genes depletion of which enhanced survival in WT not KO. (E) Distribution of sgRNA read counts (normalized) of the 2 representative genes Ppat and Mthfd1 in WT and KO cells at different time points. The four colors represent the four distinct sgRNAs in the Brie CRISPR library.
Figure 2
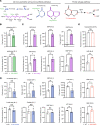
Figure 2. Loss of MLL3 and MLL4 increases flux through purine synthesis in mESCs.
(A) The flowchart of 15N glutamine and 13C HTX isotope-labeled metabolite tracing. (B) Levels and fractional abundance (out of total glutamine) of the tracer-labeled glutamine (M+1) in WT and KO cells. (C) Incorporation of 15N tracer from labeled glutamine into purines. (D) Incorporation of 15N tracer from labeled glutamine into pyrimidines. (E) Incorporation of 13C tracer from labeled HTX into purines. WT, n = 3; MLL3/4 KO, n = 3. Data are presented as mean ± SD. *P < 0.05, **P < 0.01, ***P < 0.001 with unpaired t test.
Figure 3
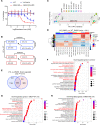
Figure 3. MLL3/4-KO mESCs display enhanced sensitivity to purine synthesis inhibition.
(A) WT and MLL3/4-KO cells were treated with 0–2.5 μM LTX with a 2-fold dilution in the presence or absence of 50 μM HPX for 48 hours. A CellTiter-Glo luminescent cell viability assay was performed to determine the percentage of cell growth inhibition under these conditions. WT, n = 3; MLL3/4 KO, n = 3. (B) WT and KO cells were treated with 0.3 μM LTX ± 50 μM HPX for 48 hours, and cells were harvested for RNA-Seq (n = 2 for each condition). Differential gene expression analyses were performed with the indicated comparisons. (C) PC analysis of RNA-Seq in B. The 500 most variable genes among all the conditions were included by default. (D) Hierarchical clustering heatmap showing differentially expressed genes in KO cells compared with WT cells. Differentially expressed genes with Benjamini-Hochburg Padj < 0.01 were selected. (E) Venn diagram showing the overlap of genes downregulated upon LTX treatment in WT or KO cells. (F) Pathway enrichment analysis of the genes downregulated upon LTX treatment in both WT and KO cells. (G) Pathway enrichment analysis of the genes uniquely downregulated upon LTX treatment in WT cells. (H) Pathway enrichment analysis of the genes uniquely downregulated upon LTX treatment in MLL3/4-KO cells.
Figure 4
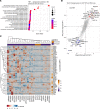
Figure 4. Purine metabolism gene upregulation in MLL3/4-KO cells.
(A) The biological process sub-terms within the top upregulated gene ontology term (Group 1). (B) Correlation plot showing the log2 fold change in abundance or expression of all the targets detected by both TMT and RNA-Seq, n = 6,700. The top 20 up- or down-regulated genes that were changed both at RNA and protein levels are highlighted. (C) Z-score hierarchical heatmap showing the change in expression of purine metabolism genes in the TMT-identified, Group 1–enriched gene set, upon knockdown of each target compared with PLKO control. The log2FC of MLL3/4 KO versus WT RNA-Seq values were plotted with the same gene cluster order.
Figure 5
Figure 5. Gene expression compensation by MLL1/COMPASS in MLL3/4-KO cells.
(A) MLL3/4 KO versus WT log2FC average plot showing the relative genomic binding of H3K4me3, MLL1, MLL2, Menin, and SET1A surrounding the TSS of genes that were significantly upregulated in MLL3/4-KO versus WT cells (selected based on Padj < 0.01 and logFC > 1, n = 1548). (B) The significantly downregulated genes in MLL3/4 KO v.s. WT were selected based on Padj < 0.01 and logFC < –1. The log2FC average plot showing the relative genomic binding of H3K4me3, MLL1, MLL2, Menin, and SET1A surrounding the TSS of genes that were significantly downregulated in MLL3/4 KO versus WT (selected based on Padj < 0.01 and logFC < –1, n = 1,377). (C) MLL1C (MLL1 Carboxyl-terminal antibody) ChIP-Seq peaks in both WT and MLL3/4-KO cells were merged and sorted. Average plot showing the MLL1C signal in WT and MLL3/4-KO cells centered on all MLL1 peaks. n = 11,687. (D) Venn diagram showing the overlap of MLL1C peaks found in WT and MLL3/4-KO cells. Approximately 82.9% of MLL1C peaks detected in MLL3/4-KO cells are de novo peaks. (E) Change in cell viability of WT and MLL3/4-KO cells in response to WDR5-0103 inhibitor treatment. n = 3 for each specific concentration in WT and MLL3/4 KO.
Figure 6
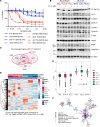
Figure 6. MLL4 mutant colorectal cancer cells are selectively sensitive to LTX treatment.
(A) Cells were treated with 0–30 μM LTX with 3-fold dilution for 72 hours. A CellTiter-Glo luminescent cell viability assay was performed to determine the percentage of inhibition under these conditions. The line plot compares the sensitivity of all cell lines tested. n = 3 for each specific concentration in each cell line. (B) Cells were treated with DMSO or 1 μM LTX for 24 hours and whole cell lysates were used for Western blot against cell cycle (H3 Ser10-p, CDT1, CyclinB1, Geminin, CyclinE1, CyclinA2, and p-cdc2) and apoptosis (PARP and Caspase3) markers using Hsp90 and β-tubulin as loading controls. (C) Venn diagram showing the overlap of genes downregulated by LTX treatment versus control in RKO, HCT116, and DLD1 cells. (D) Hierarchical clustering heatmap showing the genes with expression downregulated by LTX treatment versus control in common among RKO, HCT116, and DLD1 cells (n = 885). (E) Box plot showing the logFC of the 885 downregulated genes in common among RKO, HCT116, and DLD1 cells upon LTX treatment. An unpaired t test was used to calculate the P value. Gene expression was significantly different in all the MLL4 mutant cell lines compared with MLL4 WT cells. (F) A network was constructed from a subset of representative cluster terms. Each term is represented by a circular node, where node size is proportional to the number of input genes falling under that term, and where color represents cluster identity. Terms with a similarity score > 0.3 are linked by an edge (for which thickness represents the similarity score). The network was visualized using Cytoscape with “force-directed” layout and with edges bundled for clarity. One representative term from each cluster was selected to be labeled with its term description.
Figure 7
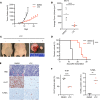
Figure 7. Inhibition of de novo purine synthesis by LTX inhibits MLL4 mutant tumor growth.
Tumor development after inoculation of 4 × 10⁶ of HCT116 cells into nude mice. Mice with HCT116 s.c. tumors were treated with either vehicle (DMSO, n = 9) or LTX (25 mg/kg, n = 9) daily for 7 days. (A) Growth plots for s.c. tumors in each treatment group are shown with mean tumor volumes (mm3) and upper SD. (B) Dot plot representation of s.c. tumor volume in mice at day 12 after tumor cell injection. Unpaired t test values for comparisons between DMSO and LTX treatment: ****P < 0.0001 with unpaired t test. DMSO, n = 9, LTX (25 mg/kg), n = 9. (C) Photographs of nude mice (left) in which HCT116 cells were inoculated into the right flank and s.c. tumors taken from these mice (right). (D) Animal survival at the indicated days after inoculation. Log-rank test was used for comparisons between DMSO and LTX treatment: ****P < 0.0001 with Log-rank (Mantel-Cox) test. (E) H&E staining and IHC showing the proliferation and apoptosis in tumors with Ki-67 and TUNEL staining. (F) The signals for Ki-67 and TUNEL are quantified and shown in the bar plots. DMSO, n = 3, LTX (25 mg/kg), n = 3. **P < 0.01, ****P < 0.0001 with unpaired t test.
Figure 8
Figure 8. The roadmap of molecular changes and cellular phenotypes when cells lose MLL3/4-COMPASS.
To identify targetable cellular vulnerabilities that arise when MLL3/4 are compromised, a variety of multiomics approaches were utilized including a synthetic lethality screen and metabolic, transcriptomic, and proteomic profiling. In addition to the downregulation of MLL3/4 target genes, the loss of MLL3/4 also leads to the activation of MLL1/COMPASS, which drives the upregulated expression of de novo purine metabolism genes. This upregulation was found to be reversible by the specific inhibition of interaction between MLL1 and the cofactor WDR5. These findings led to the therapeutic evaluation of the de novo purine nucleotide synthesis pathway targeting in MLL4 mutant colorectal cancer using lometrexol, a specific inhibitor of the purine synthesis enzyme GART. This promising approach may offer new hope for patients with MLL4 mutant colorectal cancer.

Similar articles

Cited by

References

    1. Hu D, et al. The MLL3/MLL4 branches of the COMPASS family function as major histone H3K4 monomethylases at enhancers. Mol Cell Biol. 2013;33(23):4745–4754. doi: 10.1128/MCB.01181-13. - DOI - PMC - PubMed
    1. Herz HM, et al. Enhancer-associated H3K4 monomethylation by Trithorax-related, the Drosophila homolog of mammalian Mll3/Mll4. Genes Dev. 2012;26(23):2604–2620. doi: 10.1101/gad.201327.112. - DOI - PMC - PubMed
    1. Cao K, et al. SET1A/COMPASS and shadow enhancers in the regulation of homeotic gene expression. Genes Dev. 2017;31(8):787–801. doi: 10.1101/gad.294744.116. - DOI - PMC - PubMed
    1. Rickels R, et al. A small UTX stabilization domain of Trr is conserved within mammalian MLL3-4/COMPASS and is sufficient to rescue loss of viability in null animals. Genes Dev. 2020;34(21-22):1493–1502. doi: 10.1101/gad.339762.120. - DOI - PMC - PubMed
    1. Kim JH, et al. UTX and MLL4 coordinately regulate transcriptional programs for cell proliferation and invasiveness in breast cancer cells. Cancer Res. 2014;74(6):1705–1717. doi: 10.1158/0008-5472.CAN-13-1896. - DOI - PMC - PubMed

Publication types

Substances