. 2023 May 12:14:1092743.
doi: 10.3389/fimmu.2023.1092743. eCollection 2023.

The internal dose makes the poison: higher internalization of polystyrene particles induce increased perturbation of macrophages

Affiliations

The internal dose makes the poison: higher internalization of polystyrene particles induce increased perturbation of macrophages

Véronique Collin-Faure et al. Front Immunol. .

Abstract

Plastics are emerging pollutants of great concern. Macroplastics released in the environment degrade into microplastics and nanoplastics. Because of their small size, these micro and nano plastic particles can enter the food chain and contaminate humans with still unknown biological effects. Plastics being particulate pollutants, they are handled in the human body by scavenger cells such as macrophages, which are important players in the innate immune system. Using polystyrene as a model of micro and nanoplastics, with size ranging from under 100 nm to 6 microns, we have showed that although non-toxic, polystyrene nano and microbeads alter the normal functioning of macrophages in a size and dose-dependent manner. Alterations in the oxidative stress, lysosomal and mitochondrial functions were detected, as well as changes in the expression of various surface markers involved in the immune response such as CD11a/b, CD18, CD86, PD-L1, or CD204. For each beads size tested, the alterations were more pronounced for the cell subpopulation that had internalized the highest number of beads. Across beads sizes, the alterations were more pronounced for beads in the supra-micron range than for beads in the sub-micron range. Overall, this means that internalization of high doses of polystyrene favors the emergence of subpopulations of macrophages with an altered phenotype, which may not only be less efficient in their functions but also alter the fine balance of the innate immune system.

Keywords: integrins; macrophages; microplastics; mitochondria; oxidative stress; polystyrene.


Conflict of interest statement

The authors declare that the research was conducted in the absence of any commercial or financial relationships that could be construed as a potential conflict of interest.

Figures

Figure 1
Figure 1
Latex bead uptake observed by confocal microscopy. J774A.1 were exposed to beads for 24 hours. Representative picture of the polystyrene beads internalization, Z-stack reconstitution. (A) Control cells, without bead exposure (B) Cells exposed to 40-90 nm beads (C) Cells exposed to 0.7-0.9 µm beads (D) Cells exposed to 1.7-2.2 µm beads (E) Cells exposed to 2.5-4.5 µm beads (F) Cells exposed to 6-8 µm beads. Nucleus is colored in blue (SytoxBlue), actin is colored in green (atto390), beads are in red (Skyblue).
Figure 2
Figure 2
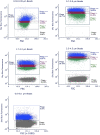
distribution of the fluorescence observed by flow cytometry on cells exposed to polystyrene beads of different sizes. The total population having internalized plastic beads is designated as Phago. It is subdivised in three thirds, graded by their fluorescence from Phago+ to Phago+++, except for the largest beads (6-8 µm), where only 7% of the cells are phagocytic and thus grouped in only one population. The distribution of the fluorescence is shown in the diagram of the figures by different colors. The population of the cells that have not internalized beads after 24 hours of exposure is designated as Phago-. The increase in this subpopulation with increasing bead size is due both to the fact that larger beads are more difficult to internalize and to the fact that at a given concentration, the number of beads decreases when beads size increases. For example, at the concentration of 20µg/ml used in the experiments, there is only 1 bead for 10 cells for 7µm diameter beads, 1.3 bead per cell for 3µm diameter beads and 4.5 beads per cell for 2µm diameter beads.
Figure 3
Figure 3
Phagocytic activity. The cells were exposed to plastic beads of different sizes for 24 hours, and finally for 3 (A, B) or 24 hours (C) to 1µm green-fluorescent beads. They were then analyzed by flow cytometry, gated for the plastic beads red fluorescence first and then analyzed for the green fluorescence. Dotted bars: cells having internalized no beads (P-). Hatched bars: total population of cells having internalized beads (P). Solid bars: subpopulations of beads-positive cells, ranked left-right from cells showing the smallest beads fluorescence (P+) to cells showing the highest beads fluorescence (P+++). Color code:Pink: cells unexposed to beads; Blue: cells exposed to 40-90 nm beads; Light orange: cells exposed to 700-900 nm beads; Green: cells exposed to 1.7-2.2 µm beads; Purple: cells exposed to 2.5-5.5 µm beads; Grey: cells exposed to 6-8 µm beads; Dotted line: value of negative control (unexposed cells); Number of experimental replicates: 5. Data are represented as mean+standard deviation. *: p<0.05 (Student T test), mean value lower than control cells. †: p<0.05 (Student T test), mean value higher than control cells. (A) Percentage of green fluorescence-positive cells (3 hours second exposure) (B) Mean fluorescence index of green fluorescence-positive cells (3 hours second exposure) (C) Mean fluorescence index of green fluorescence-positive cells (24 hours second exposure). All cells were positive for green fluorescence.
Figure 4
Figure 4
Lysosomal function, measured with the Lysosensor indicator. The cells were exposed to plastic beads of different sizes for 24 hours, and finally for 1 hour to the Lysosensor probe. They were then analyzed by flow cytometry, gated for the beads fluorescence first and then analyzed for the Lysosensor fluorescence. Dotted bars: cells having internalized no beads (P-). Hatched bars: total population of cells having internalized beads (P). Solid bars: subpopulations of beads-positive cells, ranked left-right from cells showing the smallest beads fluorescence (P+) to cells showing the highest beads fluorescence (P+++). Color code: Pink: cells unexposed to beads; Blue: cells exposed to 40-90 nm beads; Light orange: cells exposed to 700-900 nm beads; Green: cells exposed to 1.7-2.2 µm beads; Purple: cells exposed to 2.5-5.5 µm beads; Grey: cells exposed to 6-8 µm beads; Dotted line: value of negative control (unexposed cells); Number of experimental replicates: 5. Data are represented as mean+standard deviation. *: p<0.05 (Student T test), mean value lower than control cells. †: p<0.05 (Student T test), mean value higher than control cells.
Figure 5
Figure 5
Mitochondrial transmembrane potential, measured with the Rhodamine 123 indicator. The cells were exposed to plastic beads of different sizes for 24 hours, and finally for 30 minutes to the Rh123 probe. They were then analyzed by flow cytometry, gated for the beads fluorescence first and then analyzed for the Rh123 fluorescence. Dotted bars: cells having internalized no beads (P-). Hatched bars: total population of cells having internalized beads (P). Solid bars: subpopulations of beads-positive cells, ranked left-right from cells showing the smallest beads fluorescence (P+) to cells showing the highest beads fluorescence (P+++). Color code: Pink: cells unexposed to beads; Blue: cells exposed to 40-90 nm beads.; Light orange: cells exposed to 700-900 nm beads; Green: cells exposed to 1.7-2.2 µm beads; Purple: cells exposed to 2.5-5.5 µm beads; Grey: cells exposed to 6-8 µm beads; Dark blue: cells exposed to butanedione monoxime (BDM) for 30 minutes; Dark green: cells exposed to FCCP for 30 minutes; Dotted line: value of negative control (unexposed cells); Number of experimental replicates: 5. Data are represented as mean+standard deviation. *: p<0.05 (Student T test), mean value lower than control cells. †: p<0.05 (Student T test), mean value higher than control cells.
Figure 6
Figure 6
Cellular oxidative stress, measured with the dihydrorhodamine 123 (DHR123) indicator. The cells were exposed to plastic beads of different sizes for 24 hours, and finally for 30 minutes to the Rh123 probe. They were then analyzed by flow cytometry, gated for the beads fluorescence first and then analyzed for the Rh123 fluorescence. Dotted bars: cells having internalized no beads (P-). Hatched bars: total population of cells having internalized beads (P). Solid bars: subpopulations of beads-positive cells, ranked left-right from cells showing the smallest beads fluorescence (P+) to cells showing the highest beads fluorescence (P+++). Color code: Pink: cells unexposed to beads; Blue: cells exposed to 40-90 nm beads; Light orange: cells exposed to 700-900 nm beads; Green: cells exposed to 1.7-2.2 µm beads; Purple: cells exposed to 2.5-5.5 µm beads; Grey: cells exposed to 6-8 µm beads; Dark blue: cells exposed to menadione for 2 hours; Dotted line: value of negative control (unexposed cells); Number of experimental replicates: 5. Data are represented as mean+standard deviation. *: p<0.05 (Student T test), mean value lower than control cells. †: p<0.05 (Student T test), mean value higher than control cells.
Figure 7
Figure 7
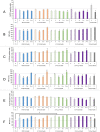
CD11a/CD11b/CD18 surface expression. The cells were exposed to plastic beads of different sizes for 24 hours, and finally tested for the surface expression of the CD11a/CD11b/CD18 integrins. They were then analyzed by flow cytometry, gated for the beads fluorescence first and then analyzed for the conjugated antibodies fluorescence. Dotted bars: cells having internalized no beads (P-). Hatched bars: total population of cells having internalized beads (P). Solid bars: subpopulations of beads-positive cells, ranked left-right from cells showing the smallest beads fluorescence (P+) to cells showing the highest beads fluorescence (P+++). Color code: Pink: cells unexposed to beads; Blue: cells exposed to 40-90 nm beads; Light orange: cells exposed to 700-900 nm beads; Green: cells exposed to 1.7-2.2 µm beads; Purple: cells exposed to 2.5-5.5 µm beads; Grey: cells exposed to 6-8 µm beads; Dotted line: value of negative control (unexposed cells); Number of experimental replicates: 5. Data are represented as mean+standard deviation. *: p<0.05 (Student T test), mean value lower than control cells. †: p<0.05 (Student T test), mean value higher than control cells. (A) Percentage of CD11a-positive cells (B) Mean fluorescence index of CD11a-positive cells (C) Percentage of CD11b-positive cells (D) Mean fluorescence index of CD11b-positive cells (E) Percentage of CD18-positive cells (F) Mean fluorescence index of CD18-positive cells.
Figure 8
Figure 8
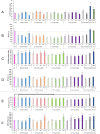
CD74/CD86 surface expression. The cells were exposed to plastic beads of different sizes for 24 hours, and finally tested for the surface expression of CD74 and CD86. They were then analyzed by flow cytometry, gated for the beads fluorescence first and then analyzed for the conjugated antibodies fluorescence. Dotted bars: cells having internalized no beads (P-). Hatched bars: total population of cells having internalized beads (P). Solid bars: subpopulations of beads-positive cells, ranked left-right from cells showing the smallest beads fluorescence (P+) to cells showing the highest beads fluorescence (P+++). Color code: Pink: cells unexposed to beads; Blue: cells exposed to 40-90 nm beads; Light orange: cells exposed to 700-900 nm beads; Green: cells exposed to 1.7-2.2 µm beads; Purple: cells exposed to 2.5-5.5 µm beads; Grey: cells exposed to 6-8 µm beads; Dark blue: cells exposed to colloidal silica; Dark green: cells exposed to LPS; Dotted line: value of negative control (unexposed cells); Number of experimental replicates: 5. Data are represented as mean+standard deviation. *: p<0.05 (Student T test), mean value lower than control cells. †: p<0.05 (Student T test), mean value higher than control cells. (A) Percentage of CD74-positive cells (B) Mean fluorescence index of CD74-positive cells (C) Percentage of CD86-positive cells (D) Mean fluorescence index of CD86-positive cells (E) Percentage of CD86-positive cells when treated with LPS and plastic particles (F) Mean fluorescence index of CD86-positive cells when treated with LPS and plastic particles.
Figure 9
Figure 9
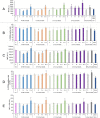
TLR7/CD204 surface expression. The cells were exposed to plastic beads of different sizes for 24 hours, and finally tested for the expression of TLR7 and the surface expression of CD204. They were then analyzed by flow cytometry, gated for the beads fluorescence first and then analyzed for the conjugated antibodies fluorescence. Dotted bars: cells having internalized no beads (P-). Hatched bars: total population of cells having internalized beads (P). Solid bars: subpopulations of beads-positive cells, ranked left-right from cells showing the smallest beads fluorescence (P+) to cells showing the highest beads fluorescence (P+++). Color code: Pink: cells unexposed to beads; Blue: cells exposed to 40-90 nm beads; Light orange: cells exposed to 700-900 nm beads; Green: cells exposed to 1.7-2.2 µm beads; Purple: cells exposed to 2.5-5.5 µm beads; Grey: cells exposed to 6-8 µm beads; Dark blue: cells exposed to colloidal silica; Dotted line: value of negative control (unexposed cells); Number of experimental replicates: 5. Data are represented as mean+standard deviation. *: p<0.05 (Student T test), mean value lower than control cells. †: p<0.05 (Student T test), mean value higher than control cells. (A) Mean fluorescence index of cells for TLR7 (all cells were positive) (B) Percentage of CD204-positive cells (C) Mean fluorescence index of CD204-positive cells (D) Percentage of CD204-positive cells when treated with LPS and plastic particles (E) Mean fluorescence index of CD204-positive cells when treated with LPS and plastic particles.
Figure 10
Figure 10
PD-L1 surface expression. The cells were exposed to plastic beads of different sizes for 24 hours, and finally tested for the surface expression of PD-L1. They were then analyzed by flow cytometry, gated for the beads fluorescence first and then analyzed for the conjugated antibodies fluorescence. Dotted bars: cells having internalized no beads (P-). Hatched bars: total population of cells having internalized beads (P). Solid bars: subpopulations of beads-positive cells, ranked left-right from cells showing the smallest beads fluorescence (P+) to cells showing the highest beads fluorescence (P+++). Color code:Pink: cells unexposed to beads; Blue: cells exposed to 40-90 nm beads; Light orange: cells exposed to 700-900 nm beads; Green: cells exposed to 1.7-2.2 µm beads; Purple: cells exposed to 2.5-5.5 µm beads; Grey: cells exposed to 6-8 µm beads; Dotted line: value of negative control (unexposed cells); Number of experimental replicates: 5. Data are represented as mean+standard deviation. *: p<0.05 (Student T test), mean value lower than control cells. †: p<0.05 (Student T test), mean value higher than control cells. (A) Percentage of PL-L1-positive cells (B) Mean fluorescence index of PD-L1-positive cells.

Similar articles

Cited by

References

    1. Lehner R, Weder C, Petri-Fink A, Rothen-Rutishauser B. Emergence of nanoplastic in the environment and possible impact on human health. Environ Sci Technol (2019) 53:1748–65. doi: 10.1021/acs.est.8b05512 - DOI - PubMed
    1. Fan YV, Jiang P, Tan RR, Aviso KB, You F, Zhao X, et al. . Forecasting plastic waste generation and interventions for environmental hazard mitigation. J Hazard Mater (2022) 424:127330. doi: 10.1016/j.jhazmat.2021.127330 - DOI - PubMed
    1. Collard F, Gasperi J, Gilbert B, Eppe G, Azimi S, Rocher V, et al. . Anthropogenic particles in the stomach contents and liver of the freshwater fish squalius cephalus. Sci Total Environ (2018) 643:1257–64. doi: 10.1016/j.scitotenv.2018.06.313 - DOI - PubMed
    1. Senathirajah K, Attwood S, Bhagwat G, Carbery M, Wilson S, Palanisami T. Estimation of the mass of microplastics ingested - a pivotal first step towards human health risk assessment. J Hazard Mater (2021) 404:124004. doi: 10.1016/j.jhazmat.2020.124004 - DOI - PubMed
    1. Schwabl P, Köppel S, Königshofer P, Bucsics T, Trauner M, Reiberger T, et al. . Detection of various microplastics in human stool: a prospective case series. Ann Internal Med (2019) 171:453. doi: 10.7326/M19-0618 - DOI - PubMed

Publication types

Grants and funding

This work used the flow cytometry facility supported by GRAL, a project of the University Grenoble Alpes graduate school (Ecoles Universitaires de Recherche) CBH-EUR-GS (ANR-17-EURE-0003). This work was carried out in the frame of the PlasticHeal project, which has received funding from the European Union’s Horizon 2020 research and innovation programme under grant agreement No. 965196.