

Unraveling the O3-NOX-VOCs relationships induced by anomalous ozone in industrial regions during COVID-19 in Shanghai
- PMID: 37250918
- PMCID: PMC10204281
- DOI: 10.1016/j.atmosenv.2023.119864
Unraveling the O3-NOX-VOCs relationships induced by anomalous ozone in industrial regions during COVID-19 in Shanghai
Abstract
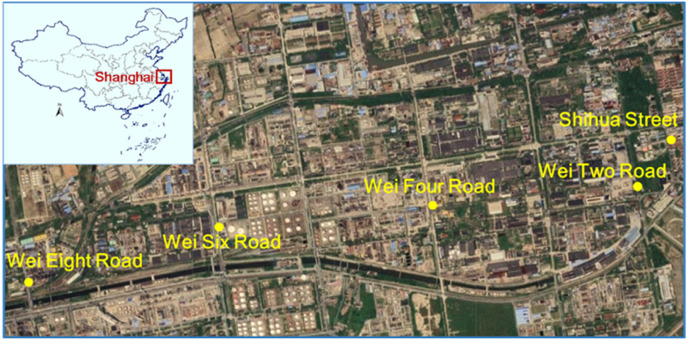
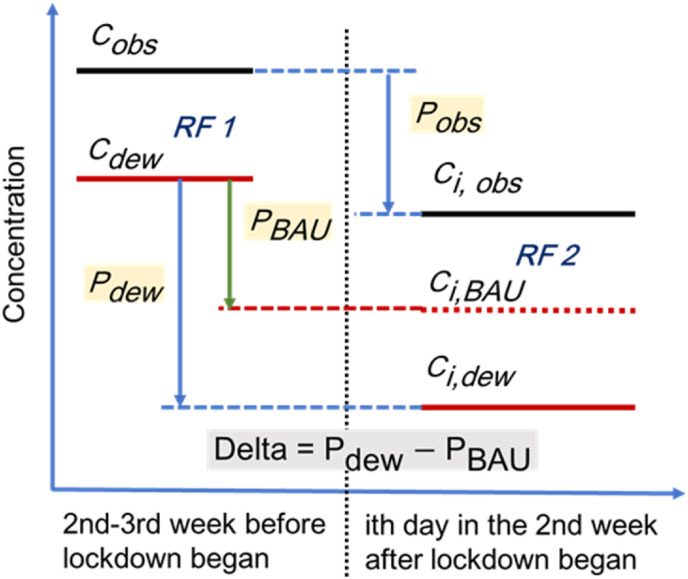
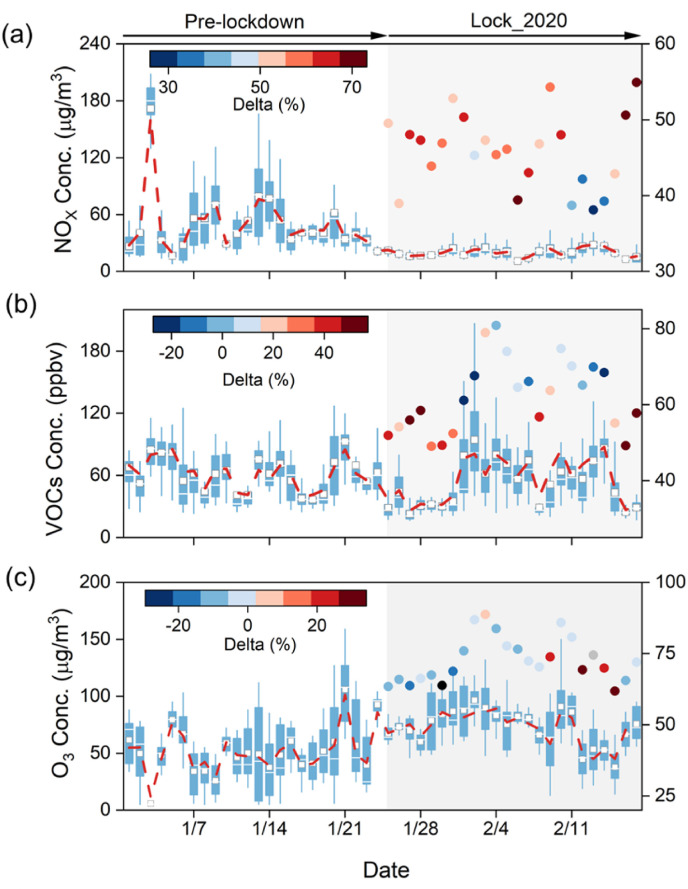
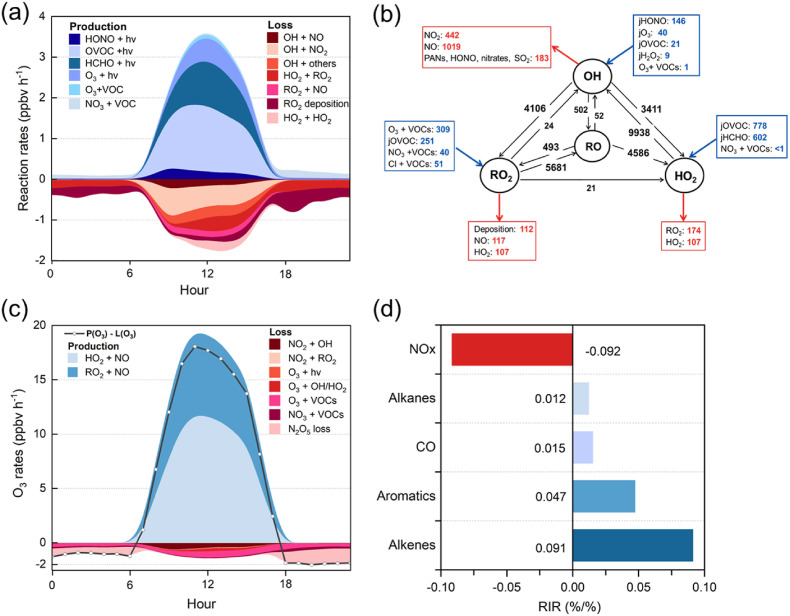
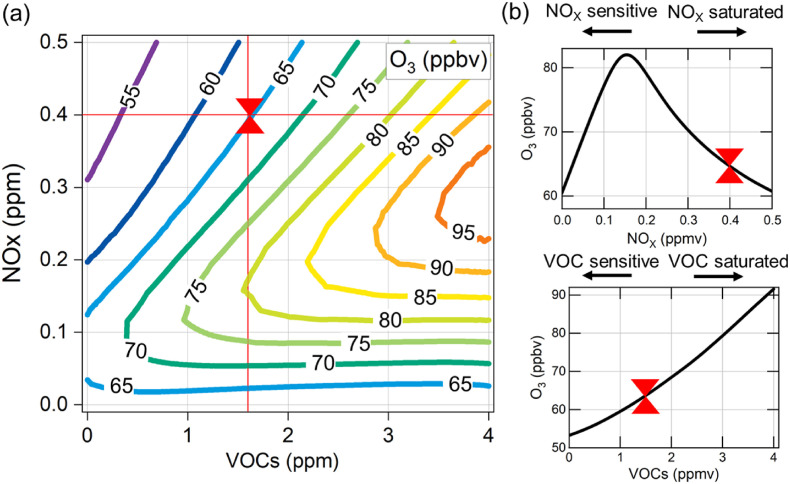
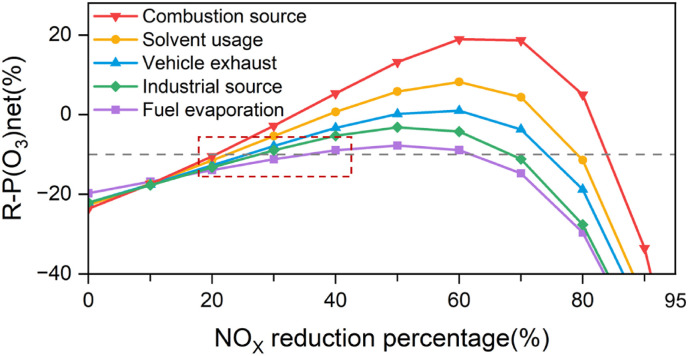
The COVID-19 pandemic promoted strict restrictions to human activities in China, which led to an unexpected increase in ozone (O3) regarding to nitrogen oxides (NOx) and volatile organic compounds (VOCs) co-abatement in urban China. However, providing a quantitative assessment of the photochemistry that leads to O3 increase is still challenging. Here, we evaluated changes in O3 arising from photochemical production with precursors (NOX and VOCS) in industrial regions in Shanghai during the COVID-19 lockdowns by using machine learning models and box models. The changes of air pollutants (O3, NOX, VOCs) during the COVID-19 lockdowns were analyzed by deweathering and detrending machine learning models with regard to meteorological and emission effects. After accounting for effects of meteorological variability, we find increase in O3 concentration (49.5%). Except for meteorological effects, model results of detrending the business-as-usual changes indicate much smaller reduction (-0.6%), highlighting the O3 increase attributable to complex photochemistry mechanism and the upward trends of O3 due to clear air policy in Shanghai. We then used box models to assess the photochemistry mechanism and identify key factors that control O3 production during lockdowns. It was found that empirical evidence for a link between efficient radical propagation and the optimized O3 production efficiency of NOX under the VOC-limited conditions. Simulations with box models also indicate that priority should be given to controlling industrial emissions and vehicle exhaust while the VOCs and NOX should be managed at a proper ratio in order to control O3 in winter. While lockdown is not a condition that could ever be continued indefinitely, findings of this study offer theoretical support for formulating refined O3 management in industrial regions in Shanghai, especially in winter.
Keywords: COVID-19 confinement; Machine learning; Ozone; Photochemical box model; Volatile organic compounds.
© 2023 Elsevier Ltd. All rights reserved.
Conflict of interest statement
The authors declare that they have no known competing financial interests or personal relationships that could have appeared to influence the work reported in this paper.
Figures
Similar articles
-
Attributing Increases in Ozone to Accelerated Oxidation of Volatile Organic Compounds at Reduced Nitrogen Oxides Concentrations.PNAS Nexus. 2022 Nov 18;1(5):pgac266. doi: 10.1093/pnasnexus/pgac266. eCollection 2022 Nov. PNAS Nexus. 2022. PMID: 36712335 Free PMC article.
-
Long-term trend of O3 in a mega City (Shanghai), China: Characteristics, causes, and interactions with precursors.Sci Total Environ. 2017 Dec 15;603-604:425-433. doi: 10.1016/j.scitotenv.2017.06.099. Epub 2017 Jun 23. Sci Total Environ. 2017. PMID: 28636977
-
Dispersion-box modeling investigation of the influences of gasoline, diesel, M85 and E85 vehicle exhaust emission on photochemistry.Environ Pollut. 2019 Sep;252(Pt B):1863-1871. doi: 10.1016/j.envpol.2019.05.142. Epub 2019 Jun 8. Environ Pollut. 2019. PMID: 31369942
-
Overview on the spatial-temporal characteristics of the ozone formation regime in China.Environ Sci Process Impacts. 2019 Jun 19;21(6):916-929. doi: 10.1039/c9em00098d. Environ Sci Process Impacts. 2019. PMID: 31089656 Review.
-
A review of the factors affecting the emission of the ozone chemical precursors VOCs and NOx from the soil.Environ Int. 2023 Feb;172:107799. doi: 10.1016/j.envint.2023.107799. Epub 2023 Feb 4. Environ Int. 2023. PMID: 36758299 Review.
References
-
- Cai C.J., Geng F.H., Tie X.X., Yu Q.O., An J.L. Characteristics and source apportionment of VOCs measured in Shanghai, China. Atmos. Environ. 2010;44:5005–5014.
-
- Cardelino C.A., Chameides W.L. An observation-based model for analyzing ozone precursor relationships in the urban atmosphere. J. Air Waste Manage. 1995;45:161–180. - PubMed
-
- Chan C.K., Yao X. Air pollution in mega cities in China. Atmos. Environ. 2008;42:1–42.
LinkOut - more resources
Full Text Sources