

Computational structural-based GPCR optimization for user-defined ligand: Implications for the development of biosensors
- PMID: 37249971
- PMCID: PMC10220229
- DOI: 10.1016/j.csbj.2023.05.004
Computational structural-based GPCR optimization for user-defined ligand: Implications for the development of biosensors
Abstract
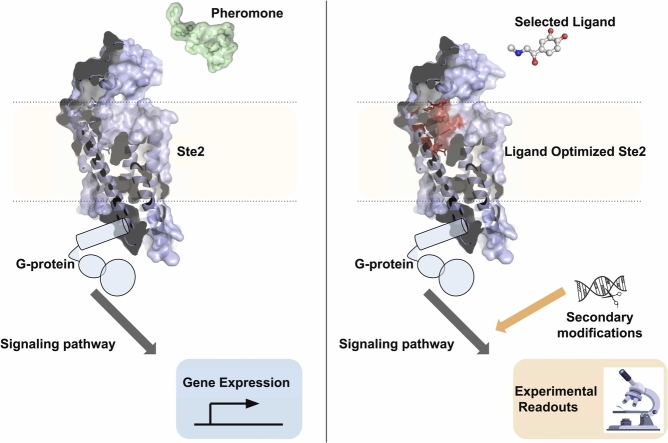
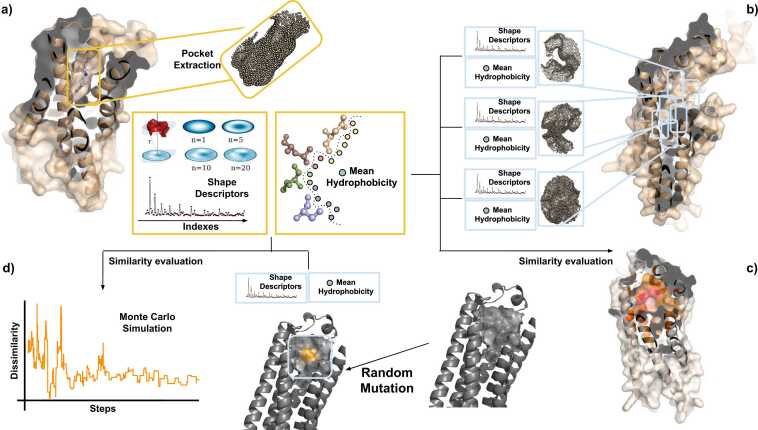
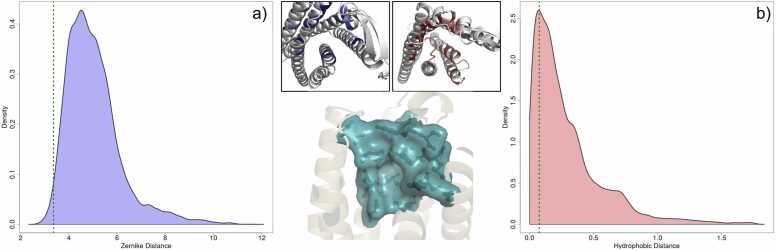
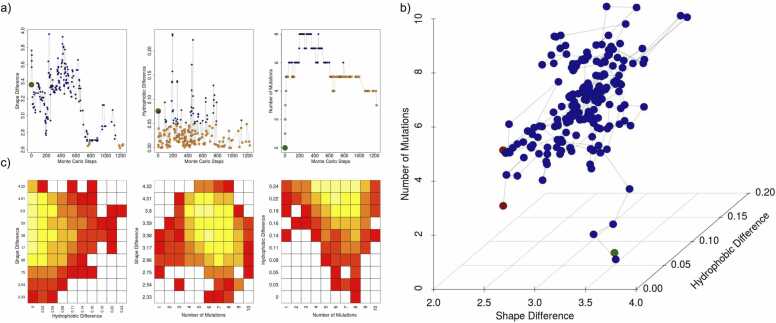
Organisms have developed effective mechanisms to sense the external environment. Human-designed biosensors exploit this natural optimization, where different biological machinery have been adapted to detect the presence of user-defined molecules. Specifically, the pheromone pathway in the model organism Saccharomyces cerevisiae represents a suitable candidate as a synthetic signaling system. Indeed, it expresses just one G-Protein Coupled Receptor (GPCR), Ste2, able to recognize pheromone and initiate the expression of pheromone-dependent genes. To date, the standard procedure to engineer this system relies on the substitution of the yeast GPCR with another one and on the modification of the yeast G-protein to bind the inserted receptor. Here, we propose an innovative computational procedure, based on geometrical and chemical optimization of protein binding pockets, to select the amino acid substitutions required to make the native yeast GPCR able to recognize a user-defined ligand. This procedure would allow the yeast to recognize a wide range of ligands, without a-priori knowledge about a GPCR recognizing them or the corresponding G protein. We used Monte Carlo simulations to design on Ste2 a binding pocket able to recognize epinephrine, selected as a test ligand. We validated Ste2 mutants via molecular docking and molecular dynamics. We verified that the amino acid substitutions we identified make Ste2 able to accommodate and remain firmly bound to epinephrine. Our results indicate that we sampled efficiently the huge space of possible mutants, proposing such a strategy as a promising starting point for the development of a new kind of S.cerevisiae-based biosensors.
Keywords: Bio-sensors; GPCR; Protein engineering.
© 2023 The Authors.
Conflict of interest statement
The authors declare no conflict of interest.
Figures

Similar articles
-
Unnatural amino acid replacement in a yeast G protein-coupled receptor in its native environment.Biochemistry. 2008 May 20;47(20):5638-48. doi: 10.1021/bi701866e. Epub 2008 Apr 18. Biochemistry. 2008. PMID: 18419133
-
Specific α-arrestins negatively regulate Saccharomyces cerevisiae pheromone response by down-modulating the G-protein-coupled receptor Ste2.Mol Cell Biol. 2014 Jul;34(14):2660-81. doi: 10.1128/MCB.00230-14. Mol Cell Biol. 2014. PMID: 24820415 Free PMC article.
-
The directed evolution of ligand specificity in a GPCR and the unequal contributions of efficacy and affinity.Sci Rep. 2017 Nov 22;7(1):16012. doi: 10.1038/s41598-017-16332-2. Sci Rep. 2017. PMID: 29167562 Free PMC article.
-
G protein-coupled receptors expressed and studied in yeast. The adenosine receptor as a prime example.Biochem Pharmacol. 2021 May;187:114370. doi: 10.1016/j.bcp.2020.114370. Epub 2020 Dec 16. Biochem Pharmacol. 2021. PMID: 33338473 Review.
-
Exploring G protein-coupled receptors and yeast surface display strategies for viral detection in baker's yeast: SARS-CoV-2 as a case study.FEMS Yeast Res. 2021 Mar 4;21(1):foab004. doi: 10.1093/femsyr/foab004. FEMS Yeast Res. 2021. PMID: 33469649 Free PMC article. Review.
Cited by
-
Design of protein-binding peptides with controlled binding affinity: the case of SARS-CoV-2 receptor binding domain and angiotensin-converting enzyme 2 derived peptides.Front Mol Biosci. 2024 Jan 5;10:1332359. doi: 10.3389/fmolb.2023.1332359. eCollection 2023. Front Mol Biosci. 2024. PMID: 38250735 Free PMC article.
-
Computational Approaches to Predict Protein-Protein Interactions in Crowded Cellular Environments.Chem Rev. 2024 Apr 10;124(7):3932-3977. doi: 10.1021/acs.chemrev.3c00550. Epub 2024 Mar 27. Chem Rev. 2024. PMID: 38535831 Free PMC article. Review.
References
-
- Yáñez-Sedeño P., Agüí L., Villalonga R., Pingarrón J. Anal Chim Acta. 2014;823:1. - PubMed
-
- Mello L.D., Kubota L.T. Food Chem. 2002;77:237.
-
- Eggins B.R. Springer-Verlag; 2013. Biosensors: an introduction.
Grants and funding
LinkOut - more resources
Full Text Sources
Molecular Biology Databases