. 2023 Apr 30;15(5):1385.
doi: 10.3390/pharmaceutics15051385.

Therapeutic Applications of Mesenchymal Stem Cell Loaded with Gold Nanoparticles for Regenerative Medicine

Affiliations

Therapeutic Applications of Mesenchymal Stem Cell Loaded with Gold Nanoparticles for Regenerative Medicine

Wen-Yu Cheng et al. Pharmaceutics. .

Abstract

In the present study, the various concentrations of AuNP (1.25, 2.5, 5, 10 ppm) were prepared to investigate the biocompatibility, biological performances and cell uptake efficiency via Wharton's jelly mesenchymal stem cells and rat model. The pure AuNP, AuNP combined with Col (AuNP-Col) and FITC conjugated AuNP-Col (AuNP-Col-FITC) were characterized by Ultraviolet-visible spectroscopy (UV-Vis), Fourier-transform infrared spectroscopy (FTIR) and Dynamic Light Scattering (DLS) assays. For in vitro examinations, we explored whether the Wharton's jelly MSCs had better viability, higher CXCR4 expression, greater migration distance and lower apoptotic-related proteins expression with AuNP 1.25 and 2.5 ppm treatments. Furthermore, we considered whether the treatments of 1.25 and 2.5 ppm AuNP could induce the CXCR4 knocked down Wharton's jelly MSCs to express CXCR4 and reduce the expression level of apoptotic proteins. We also treated the Wharton's jelly MSCs with AuNP-Col to investigate the intracellular uptake mechanisms. The evidence demonstrated the cells uptake AuNP-Col through clathrin-mediated endocytosis and the vacuolar-type H+-ATPase pathway with good stability inside the cells to avoid lysosomal degradation as well as better uptake efficiency. Additionally, the results from in vivo examinations elucidated the 2.5 ppm of AuNP attenuated foreign body responses and had better retention efficacy with tissue integrity in animal model. In conclusion, the evidence demonstrates that AuNP shows promise as a biosafe nanodrug delivery system for development of regenerative medicine coupled with Wharton's jelly MSCs.

Keywords: biological performance; gold nanoparticle; mesenchymal stem cell; nanodrug delivery.


Conflict of interest statement

The authors declare no conflict of interest.

Figures

Figure 1
Figure 1
Identification of AuNP-derived nanomaterials. (A) The UV-Vis spectrum indicated the typical peak of AuNP at the wavenumber of 520 nm in AuNP-Col-FITC, which demonstrated the presence of AuNP. (B) The FTIR spectrum of pure AuNP, pure Col, and AuNP-Col nanomaterials. (C,D) The size distribution intensity and diameter of nanoparticles were measured by DLS assay. The result is displayed as mean ± SD (n = 3).
Figure 2
Figure 2
Cell viability of Wharton’s jelly MSCs with various treatments after 48 h incubation. The MSCs were treated with different treatments: AuNP 0 ppm group (No AuNP, SDF-1α, CXCR4 siRNA + SDF-1α), AuNP 1.25 ppm (pure AuNP, SDF-1α, CXCR4 siRNA + SDF-1α), and AuNP 2.5 ppm (pure AuNP, SDF-1α, CXCR4 siRNA + SDF-1α). The results were quantified and compared with the AuNP 0 ppm group in triplicate. * p < 0.05, ** p < 0.01, *** p < 0.001: compared to AuNP 0 ppm group.
Figure 3
Figure 3
The CXCR4 expression intensity after 48 h of AuNP treatments. The Wharton’s jelly MSCs were treated with various treatments (SDF-1α, CXCR4 siRNA + SDF-1α) prior to the addition of 0 ppm, 1.25 ppm and 2.5 ppm AuNP, to further investigate the CXCR4 expression through immunofluorescence (IF) and FACS methods. (A) The images of CXCR4 expression were captured with a fluorescence microscope. Green color: CXCR4 expression intensity; red color: F-actin; blue color: cell nuclear staining by DAPI. Scale bars: 20 μm. (B) The quantitative results of CXCR4 expression based on fluorescence intensity. (C) The fluorescein-positive cells were detected by flow cytometry and analyzed with the FACS method. The results were quantified and compared with the AuNP 0 ppm group in triplicate. * p < 0.05, ** p < 0.01, *** p < 0.001: compared to AuNP 0 ppm group.
Figure 4
Figure 4
The expression of matrix metalloproteinases (MMPs) in Wharton’s jelly MSCs induced by various concentrations of AuNP after 48 h. (A) The zymogram of MMP-9 and MMP-2 expression in MSCs are shown. The expression of (B) MMP-9 and (C) MMP-2 was quantified by Image J 5.0 software based on the expression intensity. The results were quantified and compared with the AuNP 0 ppm group in triplicate. * p < 0.05, ** p < 0.01: compared to AuNP 0 ppm group.
Figure 5
Figure 5
Wharton’s jelly MSCs migration ability with AuNP treatment for 48 h. The MSCs were assigned to three groups: No treatment, SDF-1α treatment, and CXCR4 si + SDF-1α treatment. In addition, AuNP 0 ppm, 1.25 ppm and 2.5 ppm were added to the above three groups to observe the induction of migration ability. (A) The movement of MSCs into the boundary area was observed by fluorescence intensity within each group. The scale bars are equal to 200 μm. (B) The distance of MSC movement in the boundary area was further quantified, and the results were compared with the AuNP 0 ppm group in triplicate. * p < 0.05, ** p < 0.01: compared to AuNP 0 ppm group.
Figure 6
Figure 6
Expression of cell apoptotic-related proteins in Wharton’s jelly MSCs with various treatments for 48 h. The MSCs were assigned to three groups: No treatment, SDF-1α treatment and CXCR4 si + SDF-1α treatment. Next, the different concentrations of AuNP solution were added for investigation of cell apoptosis. (A) The immunoblots of apoptotic-related proteins expressed in MSC are depicted. The expression of each protein was quantified as: (B) Cyclin D1, (C) p21, (D) Bcl-2, (E) Bax and (F) Act-Caspase-3. The results were compared with the AuNP 0 ppm group in triplicate. * p < 0.05, ** p < 0.01, *** p < 0.001: compared to AuNP 0 ppm group.
Figure 7
Figure 7
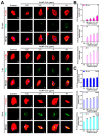
The AuNP-Col uptake efficiency in Wharton’s jelly MSCs at 30 min, 2 h and 24 h. Various concentrations of AuNP were combined with Type I collagen, and the resultant compound was named AuNP-Col. Further conjugation with FITC was performed (green fluorescence). (A) The fluorescence images were captured by fluorescence microscopy, and the scale bars are equal to 20 μm. Cell nuclei were located by DAPI (blue color), and F-actin was stained by rhodamine phalloidin (red color). (B,C) The MSC uptake efficiency was determined by both IF and FACS methods. The results were quantified in triplicate. * p < 0.05: compared to the AuNP 1.25 ppm group in IF method. * p < 0.05, ** p < 0.01, *** p < 0.001: compared to the control group in the FACS method (treatment without AuNP-Col).
Figure 8
Figure 8
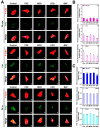
The endocytosis mechanisms of MSC uptake AuNP-Col (2.5 ppm) investigated by various inhibitors. (A) The MSCs were pre-treated with different inhibitors. Next, the AuNP-Col-FITC 2.5 ppm solutions were added and incubated for 30 min, 2 h and 24 h. The images were obtained by fluorescence microscopy. Scale bar: 20 μm. Green fluorescence: AuNP-Col-FITC (2.5 ppm); red fluorescence: F-actin; blue fluorescence: cell nuclear stained by DAPI. (B,C) The uptake amount quantified by FITC fluorescence intensity was analyzed based on IF and FACS methods. The results were quantified in triplicate. * p < 0.05, ** p < 0.01, *** p < 0.001: compared to the control (treatment without inhibitors).
Figure 9
Figure 9
The intracellular transportation of AuNP-Col in Wharton’s jelly MSCs investigated by LysoTracker assay at 30 min, 2 h and 24 h. (A) The fluorescence images were acquired by fluorescence microscopy. Scale bar: 20 μm. Green color: AuNP-Col-FITC (2.5 ppm); red color: lysosome; blue color: cell nuclei were stained by DAPI solution. (B) The fluorescence intensity of lysosome and AuNP-Col-FITC were analyzed and quantified by Image J software. The results were quantified in triplicate. ** p < 0.01, *** p < 0.001: compared to the 30 min group.
Figure 10
Figure 10
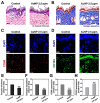
The foreign body response induced by AuNP 2.5 ppm by in vivo animal models. (A) The capsule formation was demonstrated by H&E staining. (B) The collagen deposition was evaluated by Masson’s trichrome staining assay. (C,D) The M1 (CD86, red color) and M2 (CD163, green color) macrophage polarization was investigated by immunohistochemistry staining assay. DAPI was used for cell nuclei staining (blue color). The scale bars were 100 μm. The results were quantified as: (E) capsule thickness, (F) collagen deposition, (G) CD86 expression and (H) CD163 expression. The results were quantified in triplicate. ** p < 0.01: compared to the control (treatment without AuNP 2.5 ppm).
Figure 11
Figure 11
Detection of apoptotic cells in animal tissue via TUNEL assay. The green fluorescence cells indicated TUNEL-positive cells as well as apoptotic cells in animal tissue. The statistical analysis indicated no significant difference between treatment groups and the control group, which demonstrated that AuNP was a biosafe nanomaterial.
Figure 12
Figure 12
Examination of tissue integrity and particle distribution after AuNP treatments for 12 and 24 h. AuNP solution at a concentration of 2.5 ppm was injected into the retro-orbital sinus of the experimental mice. The brain, heart, liver, spleen, lung and kidney tissues, were subjected to H&E staining assay and fluorescence observation. (A,B) The images of tissue morphology and particle distribution were exhibited after 12 hours’ treatment. (C,D) The images of tissue morphology and particle distribution after 24 h treatment. The results of H&E staining demonstrated AuNP did not cause serious destruction in any of the tissue types, and the nanoparticles (green fluorescence) could be observed in these tissues. This indicates that AuNP may have potential for nanodrug applications. DAPI was used to observe the cell nuclei. Scale bar: 50 μm. Arrow: FITC-positive cells.
Figure 13
Figure 13
(A) The illustration indicates that AuNP at concentrations of 1.25 and 2.5 ppm could strengthen the Wharton’s jelly MSC biological performance via the SDF-1α/CXCR4 pathway. (B) A schematic diagram of the endocytic pathways of AuNP-Col uptake by Wharton’s jelly MSCs.

Similar articles

Cited by

References

    1. Gavas S., Quazi S., Karpiński T.M. Nanoparticles for cancer therapy: Current progress and challenges. Nanoscale Res. Lett. 2021;16:173. doi: 10.1186/s11671-021-03628-6. - DOI - PMC - PubMed
    1. Su X., Wang T., Guo S. Applications of 3D printed bone tissue engineering scaffolds in the stem cell field. Regen. Ther. 2021;16:63–72. doi: 10.1016/j.reth.2021.01.007. - DOI - PMC - PubMed
    1. Xue X., Hu Y., Deng Y., Su J. Recent advances in design of functional biocompatible hydrogels for bone tissue engineering. Adv. Funct. Mater. 2021;31:2009432. doi: 10.1002/adfm.202009432. - DOI
    1. Wu D., Wang S., Yu G., Chen X. Cell death mediated by the pyroptosis pathway with the aid of nanotechnology: Prospects for cancer therapy. Angew. Chem. 2021;133:8096–8112. doi: 10.1002/ange.202010281. - DOI - PubMed
    1. Chaudhury K., Kumar V., Kandasamy J., RoyChoudhury S. Regenerative nanomedicine: Current perspectives and future directions. Int. J. Nanomed. 2014;9:4153. doi: 10.2147/IJN.S45332. - DOI - PMC - PubMed

LinkOut - more resources