. 2023 May 22;24(10):9075.
doi: 10.3390/ijms24109075.

Sequential Treatment with Temozolomide Plus Naturally Derived AT101 as an Alternative Therapeutic Strategy: Insights into Chemoresistance Mechanisms of Surviving Glioblastoma Cells

Affiliations

Sequential Treatment with Temozolomide Plus Naturally Derived AT101 as an Alternative Therapeutic Strategy: Insights into Chemoresistance Mechanisms of Surviving Glioblastoma Cells

Dana Hellmold et al. Int J Mol Sci. .

Abstract

Glioblastoma (GBM) is a poorly treatable disease due to the fast development of tumor recurrences and high resistance to chemo- and radiotherapy. To overcome the highly adaptive behavior of GBMs, especially multimodal therapeutic approaches also including natural adjuvants have been investigated. However, despite increased efficiency, some GBM cells are still able to survive these advanced treatment regimens. Given this, the present study evaluates representative chemoresistance mechanisms of surviving human GBM primary cells in a complex in vitro co-culture model upon sequential application of temozolomide (TMZ) combined with AT101, the R(-) enantiomer of the naturally occurring cottonseed-derived gossypol. Treatment with TMZ+AT101/AT101, although highly efficient, yielded a predominance of phosphatidylserine-positive GBM cells over time. Analysis of the intracellular effects revealed phosphorylation of AKT, mTOR, and GSK3ß, resulting in the induction of various pro-tumorigenic genes in surviving GBM cells. A Torin2-mediated mTOR inhibition combined with TMZ+AT101/AT101 partly counteracted the observed TMZ+AT101/AT101-associated effects. Interestingly, treatment with TMZ+AT101/AT101 concomitantly changed the amount and composition of extracellular vesicles released from surviving GBM cells. Taken together, our analyses revealed that even when chemotherapeutic agents with different effector mechanisms are combined, a variety of chemoresistance mechanisms of surviving GBM cells must be taken into account.

Keywords: AT101; R-(-)-gossypol; chemoresistance; combined therapy; epithelial–mesenchymal transition; glioblastoma; mTOR; stemness; temozolomide.


Conflict of interest statement

The authors declare no conflict of interest.

Figures
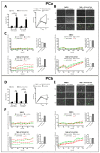
Figure 1
Figure 1
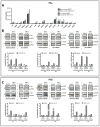
TMZ+AT101/AT101 treatment led to a predominance of phosphatidylserine (PS)-positive GBM cells over time. Human primary GBM cells were mono-cultured or co-cultured with microglia and astrocytes in defined cellular proportions mimicking an incomplete GBM resection. The cultures were treated with TMZ+AT101/AT101 (50 µM TMZ, 2.5 µM AT101) for three and six days, respectively. Death rates of primary culture a (PCa, A) and primary culture b (PCb, D) were obtained by performing a cytotoxicity assay after three and six days of stimulation, respectively (n = 3). Live cell imaging using the Polarity Sensitive Indicator of Viability pSIVA(TM) system was performed throughout the treatment period in both mono- and co-cultured GBM cells. The abundance of green (PS) and red (PI) fluorescence was evaluated by images taken every 4 h throughout the treatment period of 6 days (10-fold magnification; PCa: B, PCb: E). The Gen5 Data Analysis Software (BioTek) was used to quantify the total numbers of PS- and PI-positive cells in relation to the total number of cells within the frame and the ratio of green and red fluorescence per 1000 cells was calculated (PCa: C, PCb: F). Exemplary data shown; n = 3 biological replicates. The significances between different stimulations were determined using a two-way ANOVA test followed by a Tukey’s multiple comparison test (** p < 0.01; *** p < 0.001). Error bars correspond to the standard deviation.
Figure 2
Figure 2
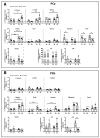
TMZ+AT101/AT101 treatment led to phosphorylation of AKT, mTOR, and GSK3ß in surviving GBM cells. Primary GBM cells were mono-cultured or co-cultured with microglia and astrocytes in defined cellular proportions mimicking an incomplete GBM resection. The cultures were treated with TMZ+AT101/AT101 (50 µM TMZ, 2.5 µM AT101) for three and six days. A human MAPK phosphorylation antibody array of primary culture a (PCa) was performed after 3 days of stimulation (A). Western blotting analysis on p-Akt, p-mTOR, and p-GSK3β of mono- and co-cultured primary cultures a (Pca, B) and b (PCb, C) was performed after stimulation for three and six days, respectively. The obtained p-Akt, p-mTOR, and p-GSK3β signals were normalized to glycerinaldehyde 3-phosphate dehydrogenase (GAPDH) used as loading control. Exemplary data shown; n = 2 biological replicates.
Figure 3
Figure 3
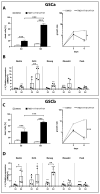
TMZ+AT101/AT101 treatment induced the expression of pro-tumorigenic genes in surviving GBM cells. Primary GBM cells were mono-cultured or co-cultured with microglia and astrocytes in defined cellular proportions mimicking an incomplete GBM resection. The cultures were treated with TMZ+AT101/AT101 (50 µM TMZ, 2.5 µM AT101) for three and six days, respectively. RNA was isolated and qRT-PCR was performed (n = 3 biological replicates). Gene expression of different pro-tumorigenic markers was analyzed in primary culture a (PCa, A) and primary culture b (PCb, B). The induction of gene expression upon stimulation is displayed as n-fold expression changes relative to the DMSO controls after normalization to GAPDH. The significances between the mono- and co-cultures or between different time points were determined by a two-way ANOVA test followed by a Tukey’s multiple comparison test and are indicated on a line linking the bars. Significant differences compared to the DMSO control were determined by a non-paired t-test and are indicated directly above the bars (* p < 0.05; ** p < 0.01; *** p < 0.001).
Figure 4
Figure 4
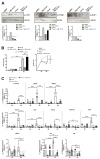
TMZ+AT101/AT101 treatment yielded high cytotoxicity in GSCs and induced the expression of stemness markers in surviving GSCs. Primary GSC cells were mono-cultured and treated with TMZ+AT101/AT101 (50 µM TMZ, 2.5 µM AT101) for three and six days, respectively (n = 2 biological replicates with n = 2 technical replicates). Death rates of GSC culture a (GSCa, A) and GSC culture b (GSCb, C) were obtained by performing a cytotoxicity assay after three and six days of stimulation, respectively. RNA was isolated and gene expression of different stemness markers was analyzed in GSC culture a (GSCa, B) and GSC culture b (GSCb, D) by qRT-PCR. The induction of gene expression upon stimulation is displayed as n-fold expression changes relative to the DMSO controls after normalization to GAPDH. The significances between different time points were determined by a two-way ANOVA test followed by Tukey’s multiple comparison test and are indicated on a line linking the bars. Significant differences compared to the DMSO control were determined by a non-paired t-test and are indicated directly above the bars (* p < 0.05; ** p < 0.01; *** p < 0.001).
Figure 5
Figure 5
Torin2-mediated mTOR inhibition counteracted TMZ+AT101/AT101-regulated chemoresistance mechanisms of surviving GBM cells. Primary GBM cells were co-cultured with microglia and astrocytes in defined cellular proportions mimicking an incomplete GBM resection. The cultures were treated with TMZ+AT101/AT101 (50 µM TMZ, 2.5 µM AT101), Torin2 (0.5 nM), or a combination of Torin2 and TMZ+AT101/AT101 for six days. Western blotting analysis on p-mTOR, p-P70S6K, and p-4E-BP1 of co-cultured primary cultures a (PCa, A) was performed after stimulation for six days, respectively. The obtained signals were normalized to glycerinaldehyde 3-phosphate dehydrogenase (GAPDH) used as loading control. Exemplary data shown; n = 2 biological replicates. Death rates of PCa were obtained by performing a cytotoxicity assay after three and six days of stimulation, respectively (n = 2 biological replicates with n = 2 technical replicates) (B). Gene expression of different pro-tumorigenic markers in PCa after three or six days of treatment was determined by qRT-PCR (C) (n = 2 biological replicates with n = 2 technical replicates). The induction of gene expression upon stimulation is displayed as n-fold expression changes relative to the DMSO controls after normalization to GAPDH. The significances between different time points were determined by a two-way ANOVA test followed by Tukey’s multiple comparison test and are indicated on a line linking the bars. Significant differences compared to the DMSO control were determined by a non-paired t-test and are indicated directly above the bars (* p < 0.05; ** p < 0.01; *** p < 0.001).
Figure 6
Figure 6
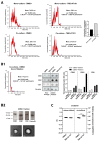
TMZ+AT101/AT101 treatment influenced GBM-derived extracellular vesicles (EVs). Primary culture a (PCa) was mono-cultured or co-cultured with microglia and astrocytes in defined cellular proportions mimicking an incomplete GBM resection. The cultures were treated with TMZ+AT101/AT101 (50 µM TMZ, 2.5 µM AT101) for three days. After three days of stimulation, the media were changed to media supplemented with exosome-depleted fetal bovine serum (FBS), and the cells were incubated for 48 h to allow for the secretion of EVs. The media were harvested and pre-cleared by consecutive centrifugation steps and the EVs were separated by poly(ethylene)glycol (PEG)-mediated precipitation. Obtained EVs of mono- and co-cultured GBM cells (PCa) with and without therapy, respectively, were characterized by nanoparticle tracking analysis (NTA) with respect to their size distribution and quantity (A). Exemplary data shown; n = 2 biological replicates. Further purification and enrichment for smaller EVs were achieved by filtration and enrichment of CD63+ EVs by magnetic separation (B1). Expression of the tetraspanin proteins CD9, CD63, and CD81 was evaluated by Western blotting analysis (B1,B2). The obtained CD9, CD63, and CD81 signals were normalized to caveolin-1. Morphology of the EVs was assessed by negative staining transmission electron microscopy (B2). Gene expression of β-catenin in EVs isolated from PCa after three days of treatment was determined by qRT-PCR (C). Significant differences were determined by a two-way ANOVA test followed by a Tukey’s multiple comparison test (*** p < 0.001).
Figure 7
Figure 7
Identified chemoresistance mechanisms of surviving human GBM primary cells after treatment with TMZ+AT101/AT101. TMZ+AT101/AT101 treatment led to an increased number of surviving phosphatidylserine (PS)-positive GBM cells over time, led to phosphorylation of AKT, mTOR, and GSK3ß, resulting in expression of pro-tumorigenic genes, and influenced extracellular vesicles derived from surviving GBM cells.
Figure 8
Figure 8
Schematic summary of the procedure for isolation and characterization of extracellular vesicles (EVs). Primary GBM cells were mono-cultured or co-cultured with healthy brain cells in indirect co-culture with cell ratios mimicking the incomplete GBM resection and stimulated with TMZ+AT101/AT101. After three days of stimulation, the media were changed to media supplemented with exosome-depleted fetal bovine serum (FBS), and the cells were incubated for 48 h to allow for the secretion of EVs. The media were harvested and pre-cleared by consecutive centrifugation steps and the EVs were separated by poly(ethylene)glycol (PEG)-mediated precipitation. Further purification and enrichment for smaller EVs were achieved by filtration and enrichment of CD63+ EVs by magnetic separation. Created with BioRender.

Similar articles

Cited by

References

    1. Liang J., Lv X., Lu C., Ye X., Chen X., Fu J., Luo C.-H., Zhao Y. Prognostic factors of patients with Gliomas—An analysis on 335 patients with Glioblastoma and other forms of Gliomas. BMC Cancer. 2020;20:35. doi: 10.1186/s12885-019-6511-6. - DOI - PMC - PubMed
    1. Stupp R., Mason W.P., van den Bent M.J., Weller M., Fisher B., Taphoorn M.J.B., Belanger K., Brandes A.A., Marosi C., Bogdahn U., et al. Radiotherapy plus Concomitant and Adjuvant Temozolomide for Glioblastoma. N. Engl. J. Med. 2005;352:987–996. doi: 10.1056/NEJMoa043330. - DOI - PubMed
    1. Verhaak R.G.W., Hoadley K.A., Purdom E., Wang V., Wilkerson M.D., Miller C.R., Ding L., Golub T., Jill P., Alexe G., et al. Integrated Genomic Analysis Identifies Clinically Relevant Subtypes of Glioblastoma Characterized by Abnormalities in PDGFRA, IDH1, EGFR, and NF1. Cancer Cell. 2010;17:98–110. doi: 10.1016/j.ccr.2009.12.020. - DOI - PMC - PubMed
    1. Singh N., Miner A., Hennis L., Mittal S. Mechanisms of temozolomide resistance in glioblastoma—A comprehensive review. Cancer Drug Resist. 2021;4:17–43. doi: 10.20517/cdr.2020.79. - DOI - PMC - PubMed
    1. Tompa M., Kalovits F., Nagy A., Kalman B. Contribution of the Wnt Pathway to Defining Biology of Glioblastoma. NeuroMolecular Med. 2018;20:437–451. doi: 10.1007/s12017-018-8514-x. - DOI - PubMed

MeSH terms