. 2023 May 5:17:1146979.
doi: 10.3389/fnins.2023.1146979. eCollection 2023.

Retinal alpha-synuclein accumulation correlates with retinal dysfunction and structural thinning in the A53T mouse model of Parkinson's disease

Affiliations

Retinal alpha-synuclein accumulation correlates with retinal dysfunction and structural thinning in the A53T mouse model of Parkinson's disease

Katie K N Tran et al. Front Neurosci. .

Abstract

Abnormal alpha-synuclein (α-SYN) protein deposition has long been recognized as one of the pathological hallmarks of Parkinson's disease's (PD). This study considers the potential utility of PD retinal biomarkers by investigating retinal changes in a well characterized PD model of α-SYN overexpression and how these correspond to the presence of retinal α-SYN. Transgenic A53T homozygous (HOM) mice overexpressing human α-SYN and wildtype (WT) control littermates were assessed at 4, 6, and 14 months of age (male and female, n = 15-29 per group). In vivo retinal function (electroretinography, ERG) and structure (optical coherence tomography, OCT) were recorded, and retinal immunohistochemistry and western blot assays were performed to examine retinal α-SYN and tyrosine hydroxylase. Compared to WT controls, A53T mice exhibited reduced light-adapted (cone photoreceptor and bipolar cell amplitude, p < 0.0001) ERG responses and outer retinal thinning (outer plexiform layer, outer nuclear layer, p < 0.0001) which correlated with elevated levels of α-SYN. These retinal signatures provide a high throughput means to study α-SYN induced neurodegeneration and may be useful in vivo endpoints for PD drug discovery.

Keywords: A53T; Parkinson’s disease; alpha-synuclein; electroretinography; optical coherence tomography; retina.


Conflict of interest statement

CN and BB are joint investigators on an Australian Research Council Linkage grant LP160100126 with AstraZeneca Neuroscience and Biogen Inc. The remaining authors declare that the research was conducted in the absence of any commercial or financial relationships that could be construed as a potential conflict of interest.

Figures
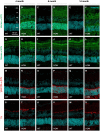
Figure 1
Figure 1
Immunohistochemical staining of alpha-synuclein and tyrosine hydroxylase in A53T retinae with age. Representative 20x confocal z-projection images of human (green, A–F) and mouse (green, G–L) alpha-synuclein (α-SYN), phosphorylated α-SYN (pSer129, red, M–R) and tyrosine hydroxylase (TH, red, S–X) staining in A53T homozygous (HOM) and wildtype (WT) control retinal cross sections at 4, 6, and 14 months of age. All retinal sections were counterstained with Hoechst cell nuclei stain as visualized in cyan. Scale bar = 50 μm. GCL, ganglion cell layer; IPL, inner plexiform layer; INL, inner nuclear layer; OPL, outer plexiform layer; ONL, outer nuclear layer.
Figure 2
Figure 2
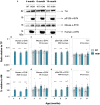
Protein abundance assessment of alpha-synuclein and tyrosine hydroxylase in A53T animals with age. (A) Representative western blots of retinal cell lysate from 4-, 6-, and 14-month-old A53T homozygous (HOM, n = 6) and wildtype (WT) littermate controls (n = 6) immunoblotted for tyrosine hydroxylase (TH), phosphorylated (pSer129), mouse and human alpha-synuclein (α-SYN). Quantification of western blot densitometry normalized to automated total protein measurement via ChemiDoc stain-free detection software (B–E) and presented as percentage (%) relative to 4-month-old (4 M) HOM group (F,H) or WT control (G,I). A53T HOM animals had significantly increased retinal levels of all α-SYN and TH. Gray bars denote wildtype (WT) controls and teal bars denote A53T homozygous (HOM) mice. All data shown, mean ± SEM; gray shaded area, 95% CI for 4-month-old WT; #p < 0.05 for treatment effect on two-way ANOVA analyses; *p < 0.05 for Sidak’s post hoc tests.
Figure 3
Figure 3
Age-related changes in retinal structure in A53T animals assessed by optical coherence tomography. Representative en face mouse fundus image (A) centered on the optic nerve head with the green line corresponding to the cross section B-scan (B) on the right illustrating the automatic segmentation of retinal layers; scale bar, 100 μm. (C–H) Raw retinal thickness values of the: retinal nerve fiber layer, RNFL; ganglion cell inner plexiform layer, GCIPL; inner nuclear layer, INL; outer plexiform layer, OPL; outer nuclear layer, ONL and total retinal thickness (TRT), respectively. TRT is a measurement that spans from the inner limiting membrane (ILM) to the outer limiting membrane (OLM). A53T HOM mice have thicker GCIPL and thinner OPL, ONL and TRT compared to WT controls. Gray bars denote wildtype (WT; 4-month, n = 16; 6-month, n = 18; 14-month, n = 28) controls and teal bars denote A53T homozygous (HOM; 4-month, n = 16; 6-month, n = 15; 14-month, n = 23) mice. All data shown, mean ± SEM; gray shaded area, 95% CI for 4-month-old WT; #p < 0.05 for treatment effect on two-way ANOVA analyses; *p < 0.05 for Sidak’s post hoc tests.
Figure 4
Figure 4
Age-related changes in dark-adapted rod retinal function of A53T mice. Group averaged dark-adapted electroretinogram (ERG) waveforms of (A) 4-month-old, (B) 6-month-old, and (C) 14-month-old mice. Lowest two panels show the ganglion cell dominated scotopic threshold response (STR) response (−5.01 to −4.90 log cd·s/m2); scale bar, 50 μV. Rod driven responses are elicited with increasing luminous energies; scale bar, 500 μV. pSTR, positive scotopic threshold response ganglion cell dominant; a-wave/P3 – photoreceptoral response; b-wave/P2 – bipolar cell response. Raw rod P3 (D), rod P2 (E), and pSTR (F) amplitudes. A53T HOM animals have decreased scoptic photoreceptoral responses. Gray traces/bars denote wildtype (WT; 4-month, n = 14; 6-month, n = 14; 14-month, n = 9) controls and teal traces/bars denote A53T homozygous (HOM; 4-month, n = 12; 6-month, n = 13; 14-month, n = 9) mice. All data shown, mean ± SEM; #p < 0.05 for treatment effect on two-way ANOVA analyses; *p < 0.05 for Sidak’s post hoc tests; gray shaded area, 95% CI for 4-month-old WT.
Figure 5
Figure 5
Age-related changes in light-adapted cone retinal function of A53T mice. Group averaged light-adapted electroretinogram (ERG) waveforms of (A) 4-month-old, (B) 6-month-old, and (C) 14-month-old mice; scale bar, 200 μV. a-wave/P3 – photoreceptoral response; b-wave/P2 – bipolar cell response. Raw cone P3 (D) and cone P2 (E) amplitudes of A53T animals. A53T HOM animals have decreased photopic photoreceptoral and cone bipolar cell responses. Gray traces/bars denote wildtype (WT; 4-month, n = 13; 6-month, n = 14; 14-month, n = 9) controls and teal traces/bars denote A53T homozygous (HOM; 4-month, n = 12; 6-month, n = 13; 14-month, n = 9) mice. All data shown, mean ± SEM; #p < 0.05 for treatment effect on two-way ANOVA analyses; *p < 0.05 for Sidak’s post hoc tests; gray shaded area, 95% CI for 4-month-old WT.
Figure 6
Figure 6
Age-related changes in retinal function and structure in A53T animals expressed relative to age-matched wildtype controls. (A,B) Retinal layer thicknesses (retinal nerve fiber layer, RNFL; ganglion cell inner plexiform layer, GCIPL; inner nuclear layer, INL; outer plexiform layer, OPL; outer nuclear layer, ONL and total retinal thickness, TRT) expressed as a percentage change relative to age-matched wildtype (WT) A53T animals. (C,D) Percentage change of ERG parameters (pSTR, rod P2, cone P2, rod P3 and cone P3 amplitudes) relative to age-matched wildtype A53T animals. ONL thinning and reduced cone P2 amplitude were the most salient and earliest retinal changes in A53T HOM animals. Post hoc analysis also showed that the pattern of change in the positive scotopic threshold response (pSTR) was significantly different from all other ERG parameters, but this is not shown in the figure for simplicity. Wildtype (WT; 4-month, n = 14–16; 6-month, n = 14–18; 14-month, n = 8–28) control littermates versus A53T homozygous (HOM; 4-month, n = 12–16; 6-month, n = 13–15; 14-month, n = 9–19) mice. All data shown, mean ± SEM.
Figure 7
Figure 7
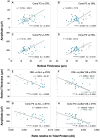
Correlations between retinal α-SYN, structure and function. Deming linear regression analysis of outer plexiform layer (OPL) and outer nuclear layer (ONL) thicknesses with cone P3 (A,B) and cone P2 (C,D) amplitudes, and total alpha-synuclein (addition of mouse α-SYN, human α-SYN and phosphorylated α-SYN, denoted as ALL) and phosphorylated α-SYN (pSer129 α-SYN) levels with ONL thickness (E,F) and cone P2 amplitude (G,H), respectively. Modest correlations were found between outer retinal layer thickness and cone ERG parameters and between total and pSer129 α-SYN levels in A53T animals that correlated with ONL thinning and reduced cone P2 amplitudes. Gray dots denote wildtype (WT; n = 18–37) controls and teal dots denote A53T homozygous (HOM; n = 18–34) mice. Spearman’s R (Rs) is given.

Similar articles

Cited by

References

    1. Adler C. H., Beach T. G., Hentz J. G., Shill H. A., Caviness J. N., Driver-Dunckley E., et al. . (2014). Low clinical diagnostic accuracy of early vs advanced Parkinson disease: clinicopathologic study. Neurology 83, 406–412. doi: 10.1212/WNL.0000000000000641, PMID: - DOI - PMC - PubMed
    1. Albrecht P., Müller A. K., Südmeyer M., Ferrea S., Ringelstein M., Cohn E., et al. . (2012). Optical coherence tomography in parkinsonian syndromes. PLoS One 7:e34891. doi: 10.1371/journal.pone.0034891, PMID: - DOI - PMC - PubMed
    1. Beach T. G., Carew J., Serrano G., Adler C. H., Shill H. A., Sue L. I., et al. . (2014). Phosphorylated α-synuclein-immunoreactive retinal neuronal elements in Parkinson’s disease subjects. Neurosci. Lett. 571, 34–38. doi: 10.1016/j.neulet.2014.04.027, PMID: - DOI - PMC - PubMed
    1. Behn D., Doke A., Racine J., Casanova C., Chemtob S., Lachapelle P. (2003). Dark adaptation is faster in pigmented than albino rats. Doc. Ophthalmol. 106, 153–159. doi: 10.1023/A:1022511918823 - DOI - PubMed
    1. Bétemps D., Verchère J., Brot S., Morignat E., Bousset L., Gaillard D., et al. . (2014). Alpha-synuclein spreading in M83 mice brain revealed by detection of pathological α-synuclein by enhanced ELISA. Acta Neuropathol. Commun. 2:29. doi: 10.1186/2051-5960-2-29, PMID: - DOI - PMC - PubMed

LinkOut - more resources