. 2023 May 3:14:1041079.
doi: 10.3389/fimmu.2023.1041079. eCollection 2023.

Myo1f has an essential role in γδT intraepithelial lymphocyte adhesion and migration

Affiliations

Myo1f has an essential role in γδT intraepithelial lymphocyte adhesion and migration

Irving Ulises Martínez-Vargas et al. Front Immunol. .

Abstract

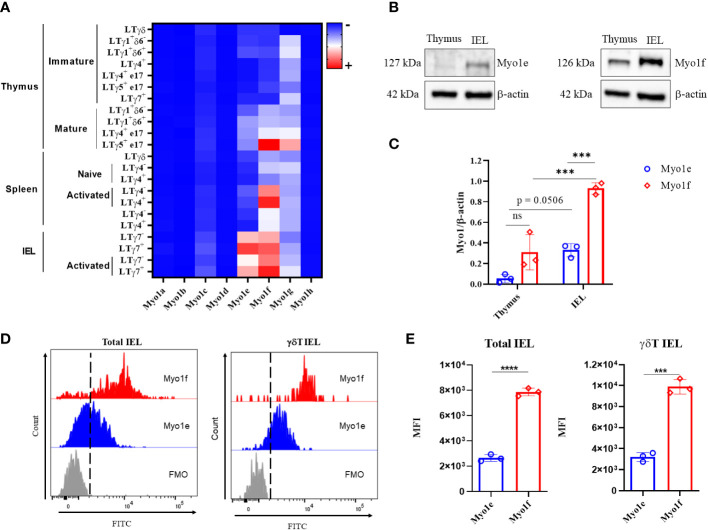
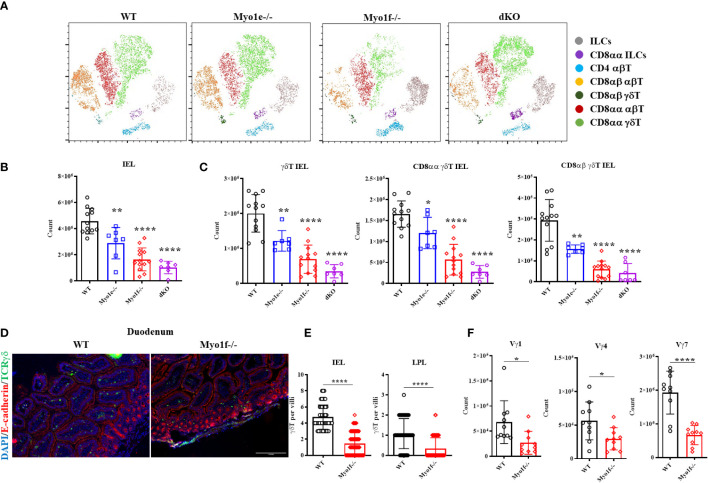
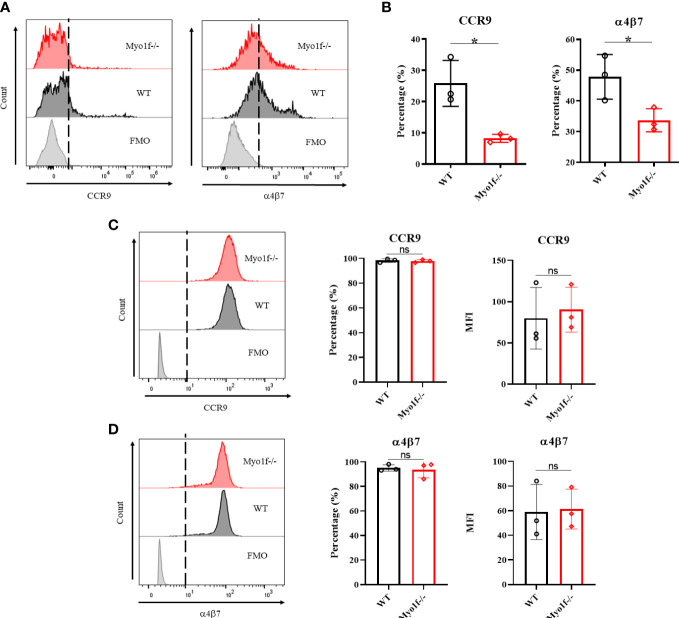
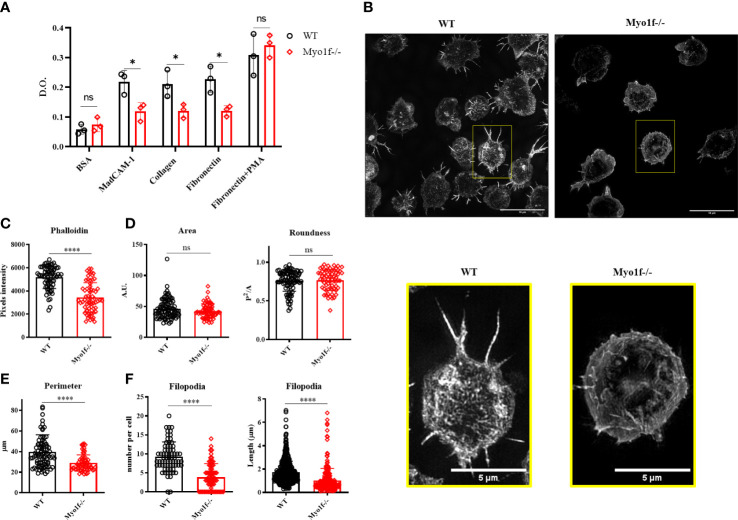
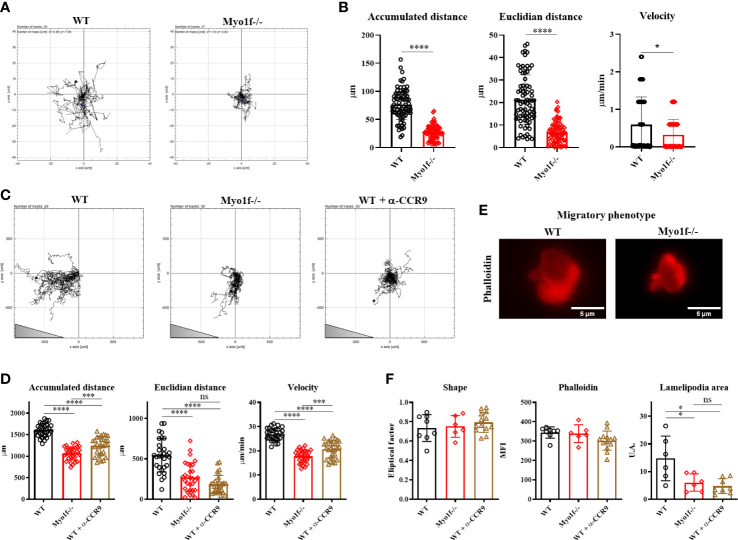
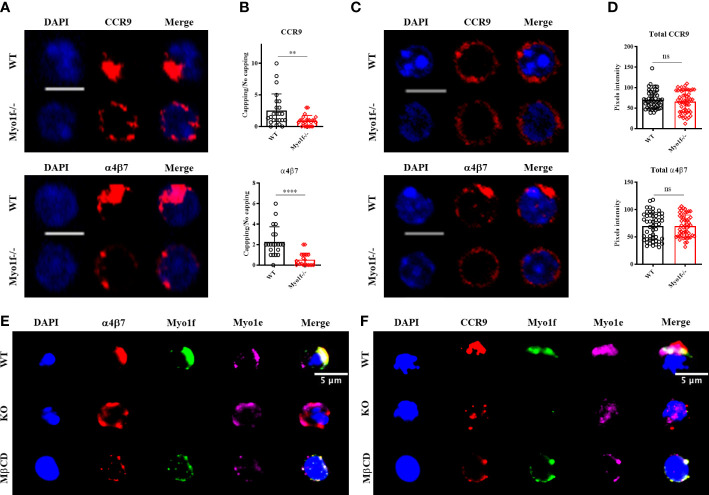
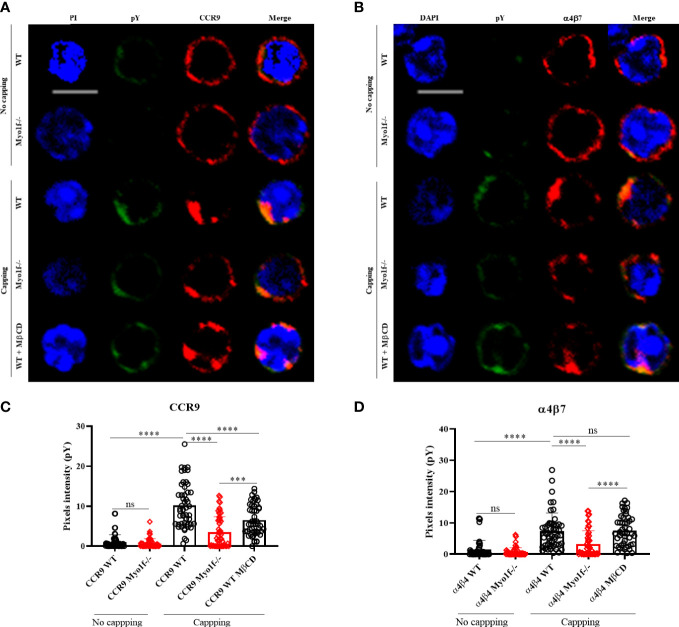
γδT intraepithelial lymphocyte represents up to 60% of the small intestine intraepithelial compartment. They are highly migrating cells and constantly interact with the epithelial cell layer and lamina propria cells. This migratory phenotype is related to the homeostasis of the small intestine, the control of bacterial and parasitic infections, and the epithelial shedding induced by LPS. Here, we demonstrate that Myo1f participates in the adhesion and migration of intraepithelial lymphocytes. Using long-tailed class I myosins KO mice, we identified the requirement of Myo1f for their migration to the small intestine intraepithelial compartment. The absence of Myo1f affects intraepithelial lymphocytes' homing due to reduced CCR9 and α4β7 surface expression. In vitro, we confirm that adhesion to integrin ligands and CCL25-dependent and independent migration of intraepithelial lymphocytes are Myo1f-dependent. Mechanistically, Myo1f deficiency prevents correct chemokine receptor and integrin polarization, leading to reduced tyrosine phosphorylation which could impact in signal transduction. Overall, we demonstrate that Myo1f has an essential role in the adhesion and migration in γδT intraepithelial lymphocytes.

Keywords: class I myosins; cytoskeleton; integrins; intraepithelial lymphocytes; migration; signaling.


Conflict of interest statement

The authors declare that the research was conducted in the absence of any commercial or financial relationships that could be construed as a potential conflict of interest.

Figures

Figure 1
Figure 1
Expression of class I myosins in IEL. (A) Heat map of class I myosins expression in γδT lymphocytes from data available at https://www.immgen.org/. (B) Cropped western blot of Myo1e (127 kDa) and Myo1f (126 kDa) expression in thymus and total IEL by independent western blots. (C) Densitometric analysis of Myo1e and Myo1f expression in thymus and total IEL; β-actin was used as a loading control. A two-way ANOVA test was applied. (D) Representative histogram of Myo1e and Myo1f expression in total and γδT IEL by flow cytometry. Fluorescence Minus One (FMO) control. (E) Mean Fluorescence Intensity (MFI) of Myo1e and Myo1f expression by flow cytometry. An unpaired t-Student test was applied. Heat map generated with Prism version 8. The western blot represents three independent experiments. Flow cytometry data are from three independent experiments. p-value; ***=0.001, ****=0.0001.
Figure 2
Figure 2
Intraepithelial lymphocyte count in WT, Myo1e-/-, Myo1f-/-, and dKO mice. (A) t-SNE algorithm analysis from flow cytometry data in WT, Myo1e-/-, Myo1f-/-, and dKO mice. (B) Total and (C) γδT, CD8αα γδT, and CD8αβ γδT IEL count in WT, Myo1e-/-, Myo1f-/-, and dKO mice. An unpaired t-Student test was applied. (D) Representative histofluorescense staining of γδT lymphocytes in duodenum from WT and Myo1f-/-. (E) γδT IEL and Lamina propria lymphocytes (LPL) count in histofluorescense sections. Kolmogorov-Smirnov test was applied. (F) Vγ-specific γδT IEL subsets in WT and Myo1f-/- mice. An unpaired t-Student was applied. In flow cytometry analysis, each dot represents one mouse. In tissue count, each dot represents villi and shows pooled data from 3 independent experiments. p-value; *=0.05, **=0.005, ****=0.0001.
Figure 3
Figure 3
Gut homing and integrin expression. (A) Representative histogram of surface CCR9 and α4β7 integrin expression in WT vs. Myo1f-/- γδT cells. (B) Percentage of CCR9 and α4β7 positive cells. An unpaired t-Student test was applied. (C) Representative histograms of total CCR9 staining and percentage and MFI of CCR9 staining. (D) Representative histograms of total α4β7 integrin staining and percentage and MFI of α4β7 integrin staining. For CCR9 and α4β7 MFI analysis, unpaired t-Student tests were applied. Each dot represents one mouse of three independent experiments. p value *=0.05. ns, no significance.
Figure 4
Figure 4
Cell adhesion and spreading. (A) Cell adhesion to MadCAM-1, fibronectin, and collagen I. As negative and positive controls, we used 5% BSA and PMA-activated γδT cells, respectively. A two-way ANOVA test was applied. Each dot represents an average of 2 duplicates in 3 independent experiments. (B) Representative images of collagen-adhered (spreading) γδT cells for 30 min, stained post-fixation with phalloidin (dilution 1:500) and analyzed by structured illumination microscopy (SIM). (C) Phalloidin pixels intensity. (D) Cell morphologic analysis of the area, roundness, and (E) Perimeter. (F) Filopodia count per cell and length. Kolmogorov-Smirnov test was applied. Each dot represents one cell. 90 cells were analyzed. Pooled data from 3 independent experiments. p-value; *=0.05, ****=0.0001. ns, no significance.
Figure 5
Figure 5
Random and CCL25-dependent migration. (A) Representative single-cell migration tracks in random migration. (B) Accumulated and Euclidian distance and velocity. (C) Representative single-cell migration tracks in CCL25-dependent migration. Triangle represents gradient orientation (D) Accumulated and Euclidian distance and velocity in CCL25-dependent migration. (E) Phalloidin staining of γδT lymphocyte migratory phenotype; cells were fixed and stained after CCL25-dependent migration. An unpaired t-Student test was applied in distance data, and in velocity data, Kolmogorov-Smirnov test was applied. (F) Phalloidin MFI fixed and stained post-migration, shape factor, and lamellipodia area of γδT lymphocyte migratory phenotype. For random and CCL25-dependent migration, 80 and 50 cells were analyzed, respectively. For migratory phenotype, 10 cells were analyzed. A one-way ANOVA test was applied. p-value; *=0.05, ***=0.0005, ****=0.0001. ns, no significance.
Figure 6
Figure 6
Myo1f role in CCR9 and α4β7 integrin polarization. (A) Representative confocal images of CCR9 and α4β7 capping induction in WT and Myo1f-/- γδT IEL. (B) Capping/no capping quotient of CCR9 and α4β7 defined by the molecule agglomeration (32). Each dot represents capping/no capping quotient per field (3-6 cells per field, 25 fields per group). Mann-Whitney test was applied. Pooled data from 3 independent experiments. (C) Representative confocal images of total CCR9 and α4β7 staining in WT and Myo1f-/- γδT IEL (D) Pixels intensity of total CCR9 and α4β7 staining. The Kolmogorov-Smirnov test was applied. Pooled data from 3 independent experiments. (E) Representative epifluorescence images of α4β7 capping phenotypes from WT, Myo1f-/- and MβCD pre-treated γδT IEL. (F) Representative epifluorescence images of CCR9 capping phenotypes from WT, Myo1f-/-, and MβCD pre-treated γδT IEL. Scale bar 5 μm. p-value; **= 0.005, ****=0.0001. ns, no significance.
Figure 7
Figure 7
Myo1f deficiency in tyrosine phosphorylation-mediated signaling. (A) Representative CCR9 no capping and capping phenotype and phosphotyrosine staining from WT, Myo1f-/- and MβCD pre-treated γδT IEL (B) Representative α4β7 no capping and capping phenotype and phosphotyrosine staining from WT, Myo1f-/- and MβCD pre-treated γδT IEL C) Phosphotyrosine pixels intensity in WT, Myo1f-/- and MβCD pre-treated γδT IEL in CCR9 capping phenotype. A Kruskal-Wallis test was applied. Each dot represents one cell. Pooled from 3 independent experiments. (D) Phosphotyrosine pixels intensity in WT, Myo1f-/- and MβCD pre-treated γδT IEL in α4β7 capping phenotypes. The Kruskal-Wallis test was applied. Each dot represents one cell. Pooled data from 3 independent experiments. Scale bar 5 μm. p-value; ***=0.0005, ****=0.0001. ns, no significance.

Similar articles

References

    1. Cheroutre H, Lambolez F, Mucida D. The light and dark sides of intestinal intraepithelial lymphocytes. Nat Rev Immunol (2011) 11(7):445–56. doi: 10.1038/nri3007 - DOI - PMC - PubMed
    1. Goodman T, Lefrançois L. Expression of the γ-δ T-cell receptor on intestinal CD8+ intraepithelial lymphocytes. Nature (1988) 333(6176):855–8. doi: 10.1038/333855a0 - DOI - PubMed
    1. Boll G, Rudolphi A, Spieβ S, Reimann J. Regional specialization of intraepithelial T cells in the murine small and large intestine. Scand J Immunol (1995) 41(2):103–13. doi: 10.1111/j.1365-3083.1995.tb03541.x - DOI - PubMed
    1. Bonneville M, Janeway CA, Ito K, Haser W, Ishida I, Nakanishit N, et al. . Intestinal intraepithelial lymphocytes are a distinct set of γδ T cells. Nature (1988) 336(6198):479–81. doi: 10.1038/336479a0 - DOI - PubMed
    1. Darlington D, Rogers AW. Epithelial lymphocytes in the small intestine of the mouse. J Anat (1966) 100(Pt 4):813. - PMC - PubMed

Publication types

Grants and funding

This work was partially supported by Fondo SEP-CINVESTAV (Project 194 to PT). It was also supported, by the Consejo Nacional de Ciencia y Tecnología, through doctorate fellowships to IM-V (780744), MS-B (780755), CM-R (780860), and FH-C (780260).