[Preprint]. 2023 May 3:2023.05.03.539260.
doi: 10.1101/2023.05.03.539260.

The lncRNA Neat1 is associated with astrocyte reactivity and memory deficits in a mouse model of Alzheimer's disease

Affiliations

The lncRNA Neat1 is associated with astrocyte reactivity and memory deficits in a mouse model of Alzheimer's disease

Ashleigh B Irwin et al. bioRxiv. .

Abstract

Dysregulation of long non-coding RNAs (lncRNAs) have been associated with Alzheimer's disease (AD). However, the functional role of lncRNAs in AD remains unclear. Here, we report a crucial role for the lncRNA Neat1 in astrocyte dysfunction and memory deficits associated with AD. Transcriptomics analysis show abnormally high expression levels of NEAT1 in the brains of AD patients relative to aged-matched healthy controls, with the most significantly elevated levels in glial cells. In a human transgenic APP-J20 (J20) mouse model of AD, RNA-fluorescent in situ hybridization characterization of Neat1 expression in hippocampal astrocyte versus non-astrocyte cell populations revealed a significant increase in Neat1 expression in astrocytes of male, but not female, mice. This corresponded with increased seizure susceptibility in J20 male mice. Interestingly, Neat1 deficiency in the dCA1 in J20 male mice did not alter seizure threshold. Mechanistically, Neat1 deficiency in the dorsal area CA1 of the hippocampus (dCA1) J20 male mice significantly improved hippocampus-dependent memory. Neat1 deficiency also remarkably reduced astrocyte reactivity markers suggesting that Neat1 overexpression is associated with astrocyte dysfunction induced by hAPP/Aβ in the J20 mice. Together, these findings indicate that abnormal Neat1 overexpression may contribute to memory deficits in the J20 AD model not through altered neuronal activity, but through astrocyte dysfunction.


Conflict of interest statement

Competing Interests All authors declare no competing interests.

Figures
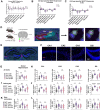
Figure 1.
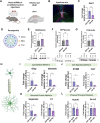
Figure 1.. Increased glial expression of the lncRNA NEAT1 in patients with AD and the male J20 mouse model of AD.
A) Differential NEAT1 expression from AD patients relative to age and sex-matched controls in three brain regions, Entorhinal Cortex (EC), Prefrontal Cortex (PFC) and Superior Frontal Gyrus (SFG). B) Average log Fold change of NEAT1 by cell type relative to all other cell types in healthy controls. C) Average log Fold change of NEAT1 by cell type relative to all other cell types in AD patients. Data from the scREAD Single-cell RNA-seq Database for Alzheimer’s Disease D) Schematic depicting experimental approach with an overlayed tracing of individual hippocampal subfields and representative image of Neat1 positive cell detection in the J20 mouse model of AD. E) Representative RNAscope images taken on the Olympus slide scanner (40x) of dorsal hippocampus with Neat1 (magenta) and DAPI staining. F) Representative images of each individual subfield (40x) G) Quantification of the proportion of Neat1 positive cells in the dorsal hippocampus n=6 mice/group, One-way ANOVA followed by Tukey’s Multiple comparisons test *P<0.05, **P<0.01, ***P<0.001. H) Quantification of the proportion of Neat1 positive cells in each subfield independently. n=6 mice/group, One-way ANOVA followed by Tukey’s Multiple comparisons test *P<0.05, **P<0.01, ***P<0.001. I) Quantification of the proportion of Neat1 positive astrocytes (Gja1+) in the dorsal hippocampus. n=6 mice/group, One-way ANOVA followed by Tukey’s Multiple comparisons test *P<0.05, **P<0.01, ***P<0.001. J) Quantification of the proportion of Neat1 positive astrocytes (Gja1+) in each subfield independently. n=6 mice/group, One-way ANOVA followed by Tukey’s Multiple comparisons test *P<0.05, **P<0.01, ***P<0.001. K) Quantification of the proportion of Neat1 positive non-astrocytes (Gja1−) in the dorsal hippocampus n=6 mice/group, One-way ANOVA followed by Tukey’s Multiple comparisons test *P<0.05, **P<0.01, ***P<0.001. L) Quantification of the proportion of Neat1 positive non-astrocytes (Gja1−) in each subfield independently. RNAscope data are n=6 mice/group, One-way ANOVA followed by Tukey’s Multiple comparisons test *P<0.05, **P<0.01, ***P<0.001.
Figure 2.
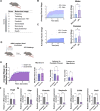
Figure 2.. Hippocampal Neat1 mediates astrocyte reactivity in the J20 mouse model of AD.
A) Schematic of experimental design. B) Representative injection site image. C) Reverse transcription quantitative polymerase chain reaction (qPCR) showing Neat1 knockdown relative to actin. Data are from n=3 mice/group Student’s t-test, ns = not significant*P<0.05, **P<0.01, ***P<0.001 D) Schematic of paraspeckle E-G) Western blot quantification of three key paraspeckle proteins, NONO, SFPQ, and FUS in Neat1 siRNA treated J20 mouse as well as WT and J20 scrambled siRNA treated controls. Data are from n=3 mice/group Student’s t-test, ns = not significant H) Schematic of the transition from quiescent to reactive astrocyte I-L) qPCR quantification analysis of several molecular markers of astrocyte reactivity: GFAP, Vimentin, S100B, Stat3, Serpina3n, C3, and Eaat1, Kcnj10. Data are from n=5–6 mice/group (males and females) Student’s t-test, ns = not significant, *P<0.05, **P<0.01, ***P<0.001
Figure 3.
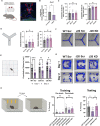
Figure 3.. siRNA mediated Neat1 knockdown in dCA1 does not alter seizure threshold in the J20 mouse model of AD.
A) Graphical depiction of the modified Racine scale used to quantify seizure stage following Pentylenetetrazol (PTZ) injection (45mg/kg). B) Left, Quantification of average Racine stage by minute over the course of 30 minutes following PTZ injection in J20 males and wild type (WT) littermate controls. Right, average maximum stage reached. Data is from n=9–10 male mice/group Student’s t-test *P<0.05, **P<0.01, ***P<0.001 C) Left, Quantification of average Racine stage by minute over the course of 30 minutes following PTZ injection in J20 females and WT littermate controls. Right, average maximum stage reached. Data is from n=13–17 female mice/group. Student’s t-test *P<0.05, **P<0.01, ***P<0.001 D) Graphical depiction of siRNA mediated Neat1 knockdown or scrambled siRNA control injections in dCA1 of male J20 mice followed five days later by PTZ challenge and subsequent qPCR of injection site. E) Quantification of average Racine stage over 30 minutes, Maximum Racine stage, Latency to Forelimb Clonus and Latency to maximum Racine stage. F-G) qPCR quantification of Fosb and the astrocyte reactivity markers GFAP, Vimentin, S100B, Stat3, Serpina3n. Data from n=12 male mice/group. Student’s t-test *P<0.05, **P<0.01, ***P<0.001
Figure 4.
Figure 4.. Neat1 mediates hippocampus-dependent long-term memory in the J20 mice.
A) Graphical depiction of siRNA mediated Neat1 knockdown in dCA1 and representative injection site image. B) qPCR quantification of Neat1 knockdown five days following dCA1 injection. N=4/group, mice were 4–6 months of age. Student’s t-test *p<0.05. C) Quantification of thigmotaxis following dCA1 Neat1 Knockdown based on (left) cumulated duration in the inner zone (seconds) and (right) cumulative duration in the outer zone (seconds). Data is n=8–13 male and female mice One-way ANOVA ns = not significant, p>0.05. D) Graphical depiction (left) and quantification of alternation frequency (middle) and Maximum Alternations in a Y maze following siRNA knockdown in dCA1 of the J20 mouse model of AD. Data is n=8–13 male and female mice. One-way ANOVA followed by Tukey’s multiple comparisons test ns = not significant. E) Representative Y maze heatmaps from each group. F) Graphical depiction of Open field habituation task (left) and quantification of cumulative distance traveled (cm) on day 1 of training and 24 hours following. Data is n=8–13 male and female mice. Two-way ANOVA followed by Bonferroni’s comparisons test ns = not significant, p>0.05. *p<0.05. **p<0.01. G) Representative open field heatmaps from each group. H) Graphical depiction of contextual fear conditioning paradigm five days following bilateral infusion of neat1 targeting siRNA or scrambled siRNA control (left). Freezing behavior was quantified before and after shock (middle) and again 24 hours later when animals were returned to the context (right). Data are n = 10–12 male and female mice/group. mice were 4–6 months of age. One-way ANOVA followed by Tukey’s multiple comparisons test *p<0.05. **p<0.01

Similar articles

References

    1. Bookheimer S.Y., Strojwas M.H., Cohen M.S., Saunders A.M., Pericak-Vance M.A., Mazziotta J.C., and Small G.W. (2000). Patterns of brain activation in people at risk for Alzheimer’s disease. N Engl J Med 343, 450–456. 10.1056/nejm200008173430701. - DOI - PMC - PubMed
    1. Shah D., Gsell W., Wahis J., Luckett E.S., Jamoulle T., Vermaercke B., Preman P., Moechars D., Hendrickx V., Jaspers T., et al. (2022). Astrocyte calcium dysfunction causes early network hyperactivity in Alzheimer’s disease. Cell Rep 40, 111280. 10.1016/j.celrep.2022.111280. - DOI - PMC - PubMed
    1. Gallagher M., and Koh M.T. (2011). Episodic memory on the path to Alzheimer’s disease. Curr Opin Neurobiol 21, 929–934. 10.1016/j.conb.2011.10.021. - DOI - PMC - PubMed
    1. 2022 Alzheimer’s disease facts and figures. (2022). Alzheimer’s & dementia : the journal of the Alzheimer’s Association 18, 700–789. 10.1002/alz.12638. - DOI - PubMed
    1. Riva P., Ratti A., and Venturin M. (2016). The Long Non-Coding RNAs in Neurodegenerative Diseases: Novel Mechanisms of Pathogenesis. Current Alzheimer research 13, 1219–1231. - PubMed

Publication types