

In silico studies of a novel scaffold of benzoxazole derivatives as anticancer agents by 3D-QSAR, molecular docking and molecular dynamics simulations
- PMID: 37197188
- PMCID: PMC10184002
- DOI: 10.1039/d3ra01316b
In silico studies of a novel scaffold of benzoxazole derivatives as anticancer agents by 3D-QSAR, molecular docking and molecular dynamics simulations
Abstract
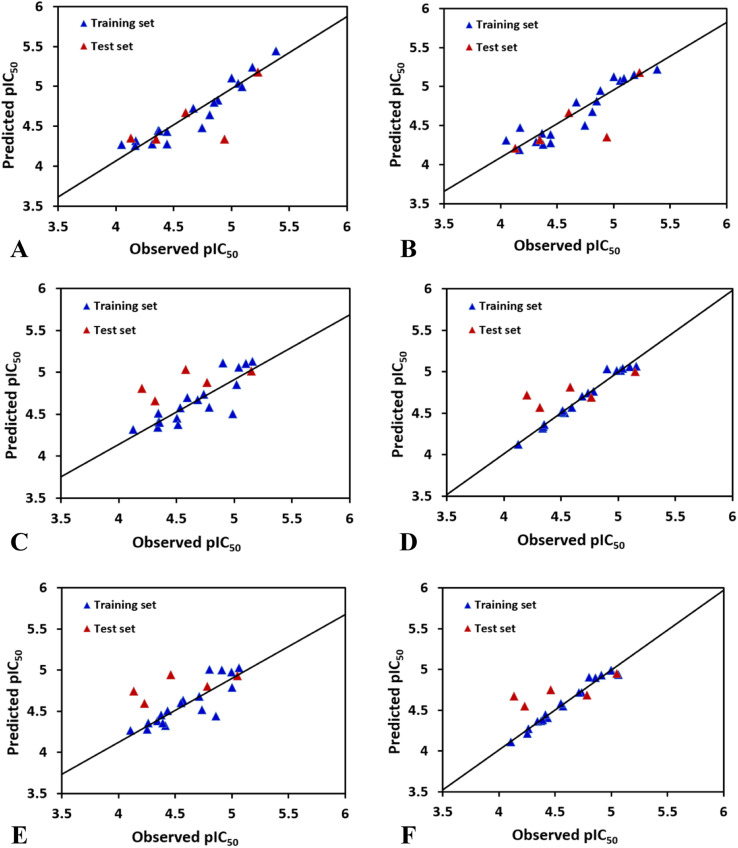
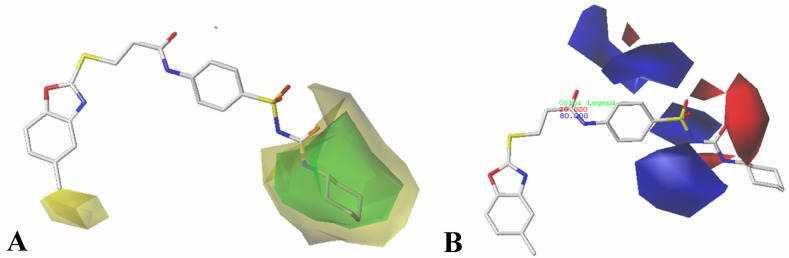
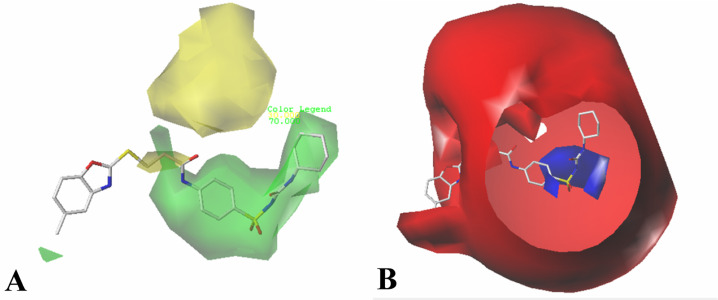
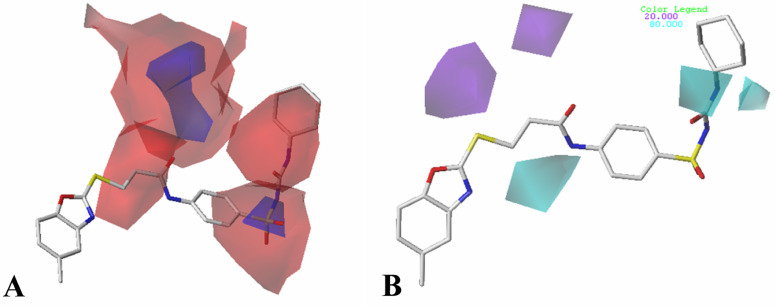
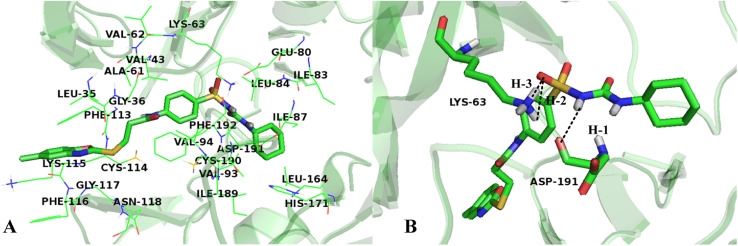
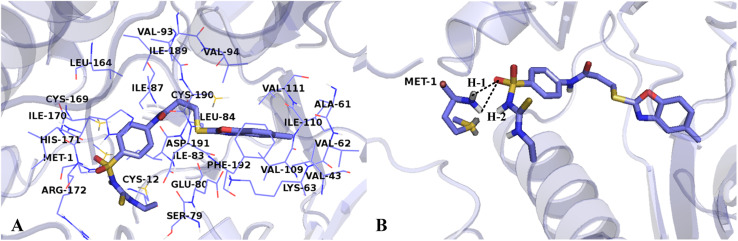
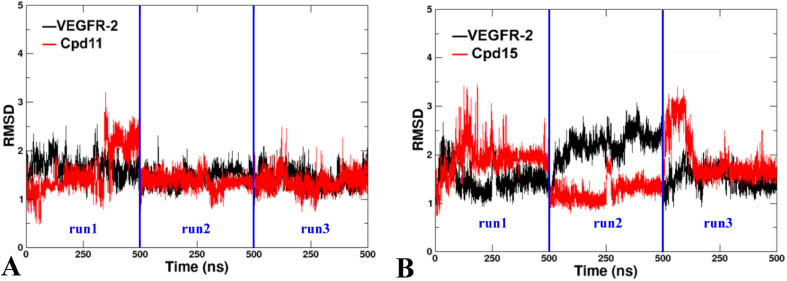
The vascular endothelial growth factor receptor-2 kinases (VEGFR-2) expressed on tumor cells and vessels are attractive targets for cancer treatment. Potent inhibitors for the VEGFR-2 receptor are novel strategies to develop anti-cancer drugs. In this work, template ligand-based 3D-QSAR studies were performed on a series of benzoxazole derivatives toward different cell lines (HepG2, HCT-116 and MCF-7). Comparative molecular field analysis (CoMFA) and comparative molecular similarity indices analysis (CoMSIA) techniques were used to generate 3D-QSAR models. Good predictability was derived for the optimal CoMFA models (HepG2: Rcv2 = 0.509, Rpred2 = 0.5128; HCT-116: Rcv2 = 0.574, Rpred2 = 0.5597; MCF-7: Rcv2 = 0.568, Rpred2 = 0.5057) and CoMSIA models (HepG2: Rcv2 = 0.711, Rpred2 = 0.6198; HCT-116: Rcv2 = 0.531, Rpred2 = 0.5804; MCF-7: Rcv2 = 0.669, Rpred2 = 0.6577). In addition, the contour maps derived from CoMFA and CoMSIA models were also generated to illustrate the relationship between different fields and the inhibitory activities. Moreover, molecular docking and molecular dynamics (MD) simulations were also conducted to understand the binding modes and the potential interactions between the receptor and the inhibitors. Some key residues (Leu35, Val43, Lys63, Leu84, Gly117, Leu180 and Asp191) were pointed out for stabilizing the inhibitors in the binding pocket. The binding free energies for the inhibitors agreed well with the experimental inhibitory activity and indicated that steric, electrostatic and hydrogen bond interactions are the main driving force for inhibitor-receptor binding. Overall, a good consistency between theoretical 3D-SQAR and molecular docking and MD simulation studies would provide directions for the design of new candidates, avoiding time-consuming and costly synthesis and biological evaluations. On the whole, the results derived from this study could expand the understanding of benzoxazole derivatives as anticancer agents and would be of great help in lead optimization for early drug discovery of highly potent anticancer activity targeting VEGFR-2.
This journal is © The Royal Society of Chemistry.
Conflict of interest statement
The authors declare that there are no conflicts of interest.
Figures


Similar articles
-
Identification of the Structural Features of Guanine Derivatives as MGMT Inhibitors Using 3D-QSAR Modeling Combined with Molecular Docking.Molecules. 2016 Jun 23;21(7):823. doi: 10.3390/molecules21070823. Molecules. 2016. PMID: 27347909 Free PMC article.
-
Molecular determinants of thyroid hormone receptor selectivity in a series of phosphonic acid derivatives: 3D-QSAR analysis and molecular docking.Chem Biol Interact. 2015 Oct 5;240:324-35. doi: 10.1016/j.cbi.2015.09.008. Epub 2015 Sep 9. Chem Biol Interact. 2015. PMID: 26363198
-
In silico studies on potential TNKS inhibitors: a combination of pharmacophore and 3D-QSAR modelling, virtual screening, molecular docking and molecular dynamics.J Biomol Struct Dyn. 2019 Sep;37(14):3803-3821. doi: 10.1080/07391102.2018.1528887. Epub 2018 Dec 24. J Biomol Struct Dyn. 2019. PMID: 30261821
-
In silico design of novel FAK inhibitors using integrated molecular docking, 3D-QSAR and molecular dynamics simulation studies.J Biomol Struct Dyn. 2022 Aug;40(13):5965-5982. doi: 10.1080/07391102.2021.1875880. Epub 2021 Jan 21. J Biomol Struct Dyn. 2022. PMID: 33475043
-
Molecular docking and 3D-QSAR study on 4-(1H-indazol-4-yl) phenylamino and aminopyrazolopyridine urea derivatives as kinase insert domain receptor (KDR) inhibitors.J Mol Model. 2012 Mar;18(3):1207-18. doi: 10.1007/s00894-011-1146-9. Epub 2011 Jun 22. J Mol Model. 2012. PMID: 21695506
References
LinkOut - more resources
Full Text Sources