. 2023 Jul 3;222(7):e202111069.
doi: 10.1083/jcb.202111069. Epub 2023 May 17.

The C10orf76-PI4KB axis orchestrates CERT-mediated ceramide trafficking to the distal Golgi

Affiliations

The C10orf76-PI4KB axis orchestrates CERT-mediated ceramide trafficking to the distal Golgi

Aya Mizuike et al. J Cell Biol. .

Abstract

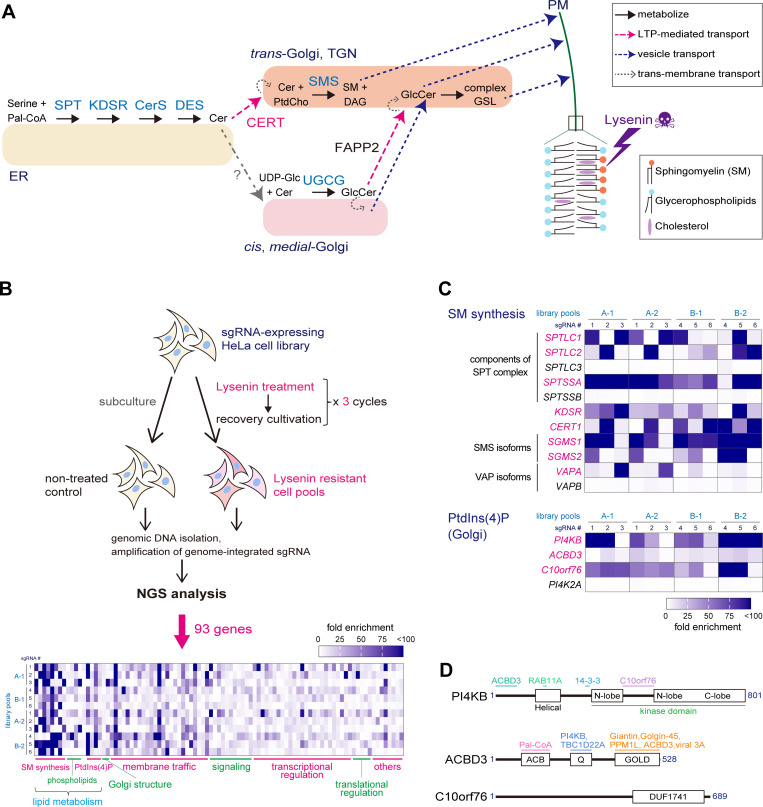
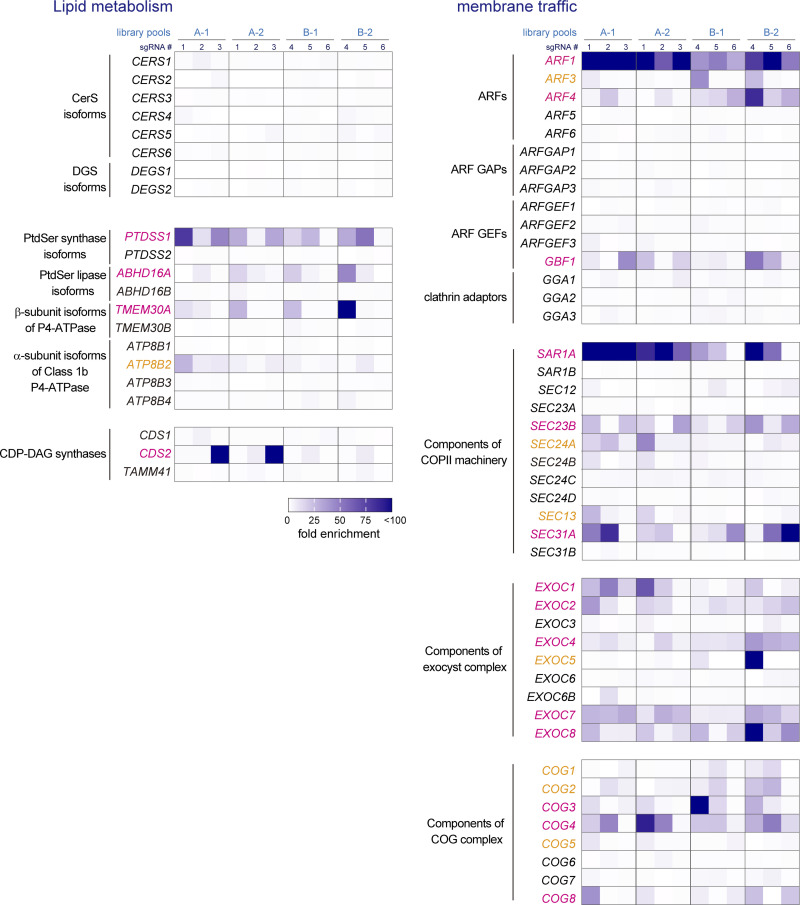
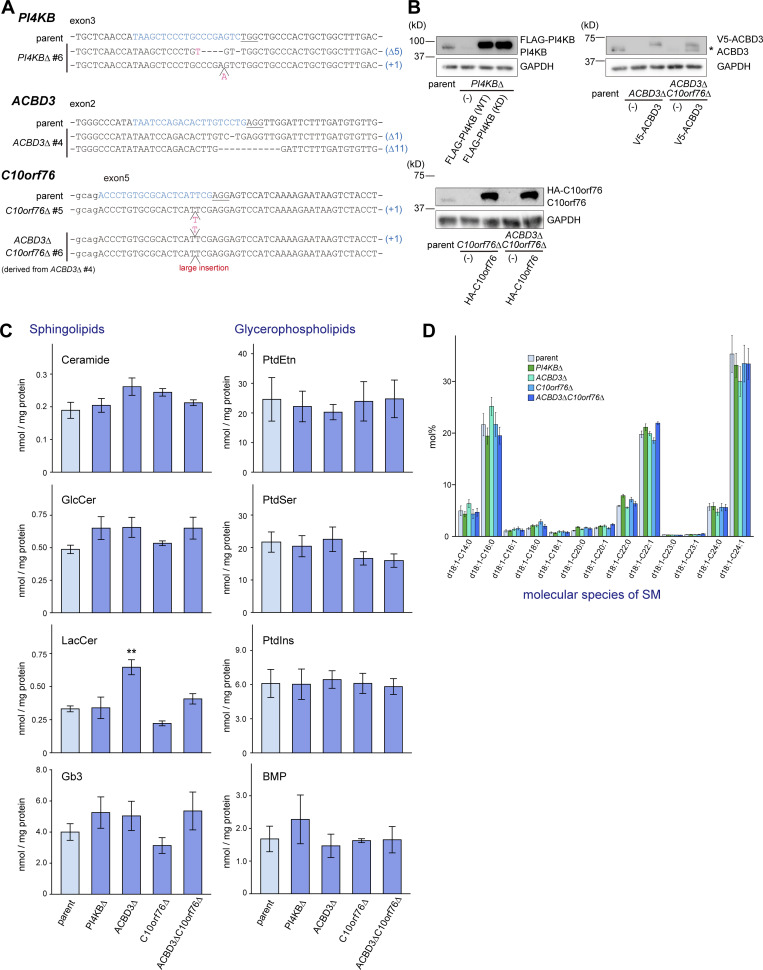
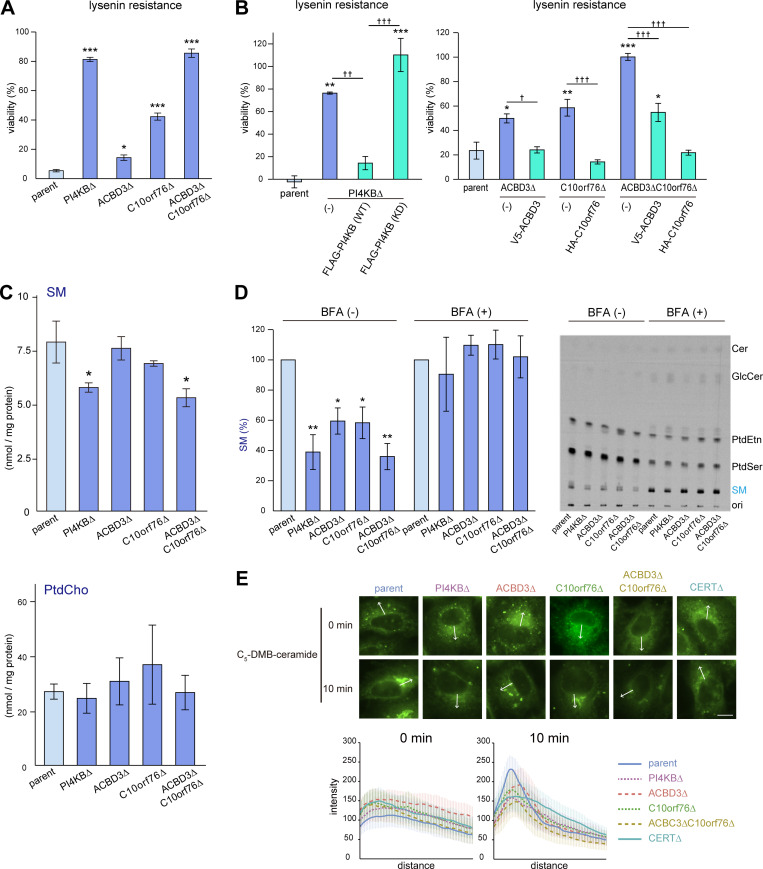
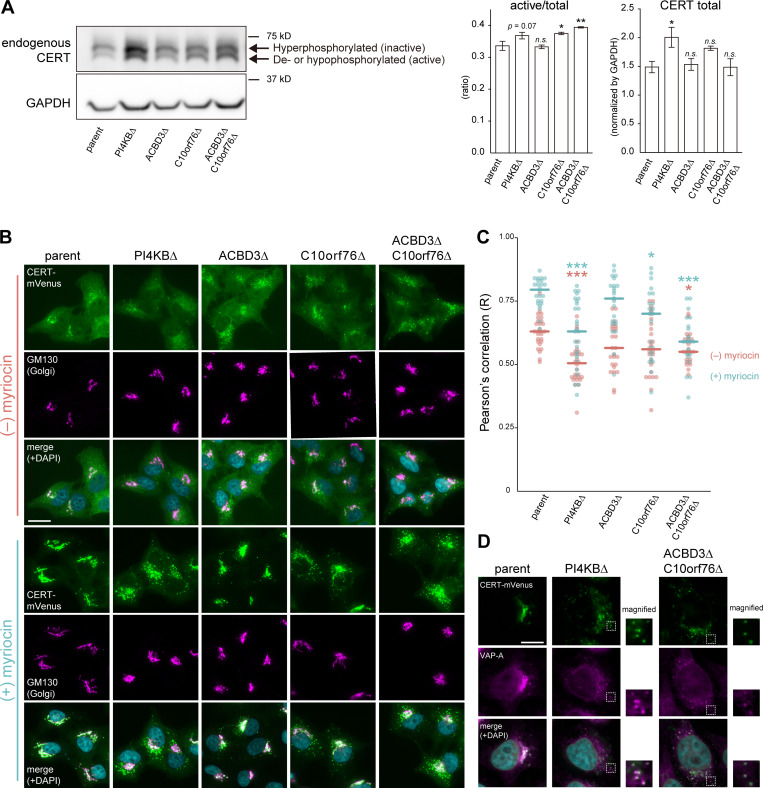
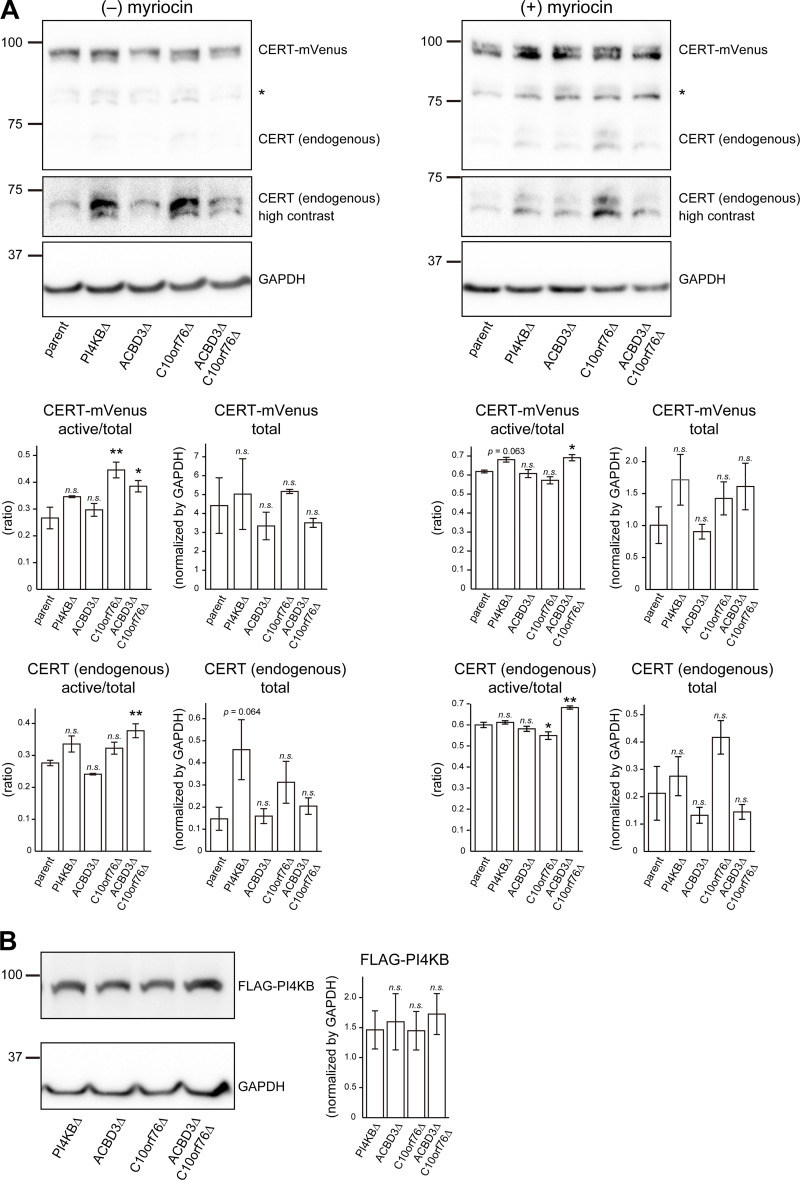
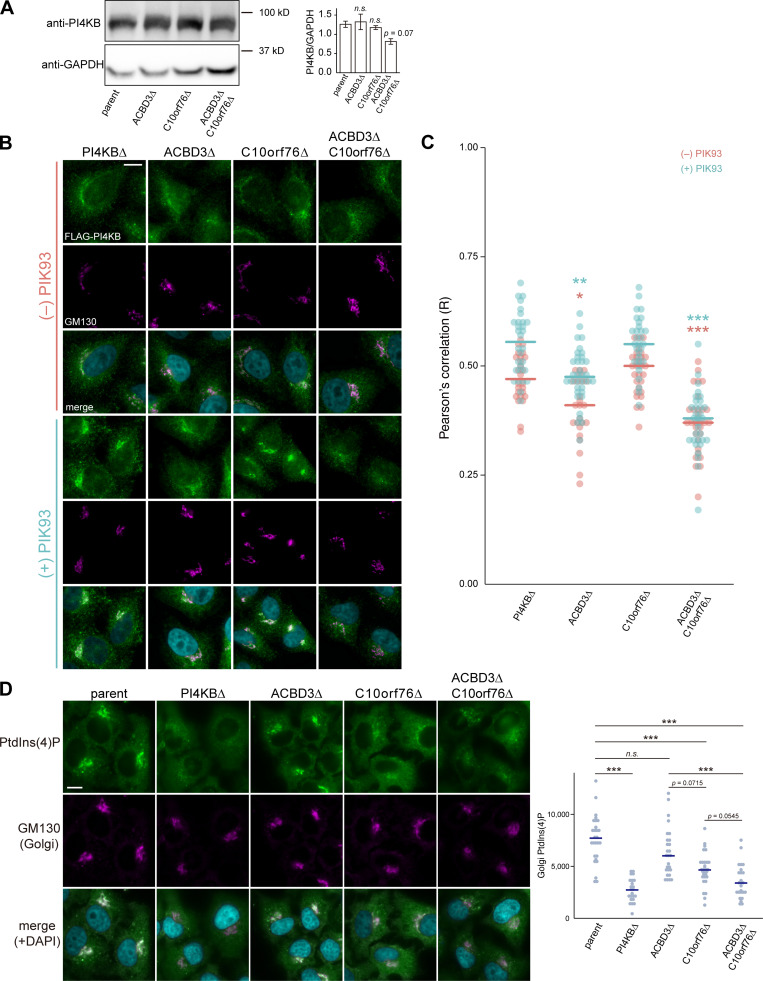
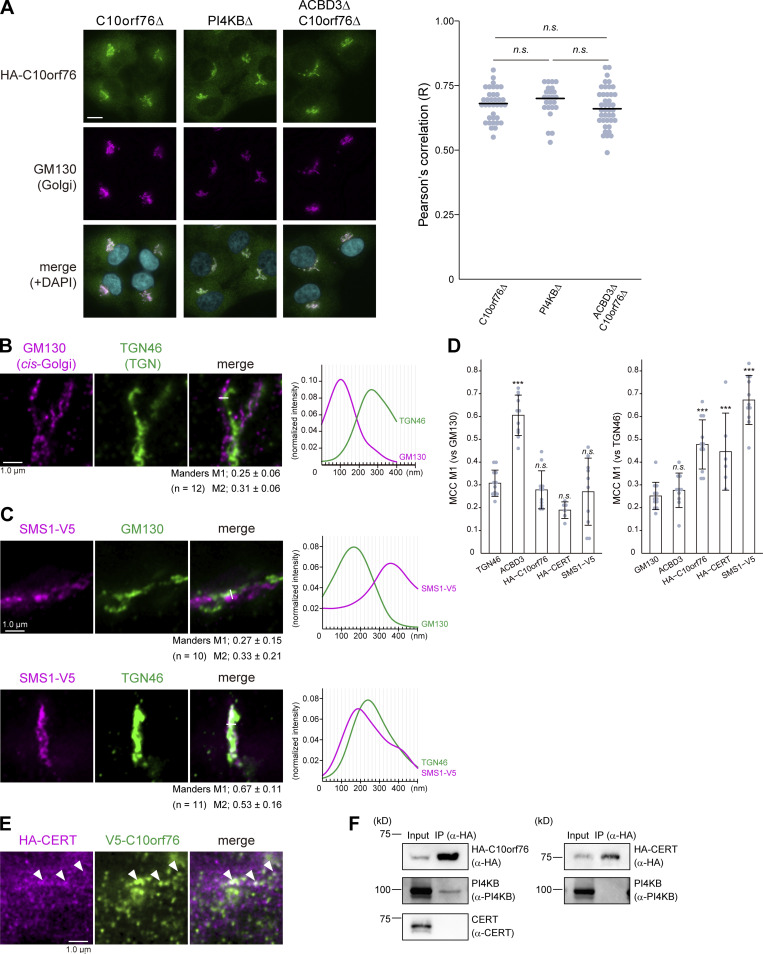
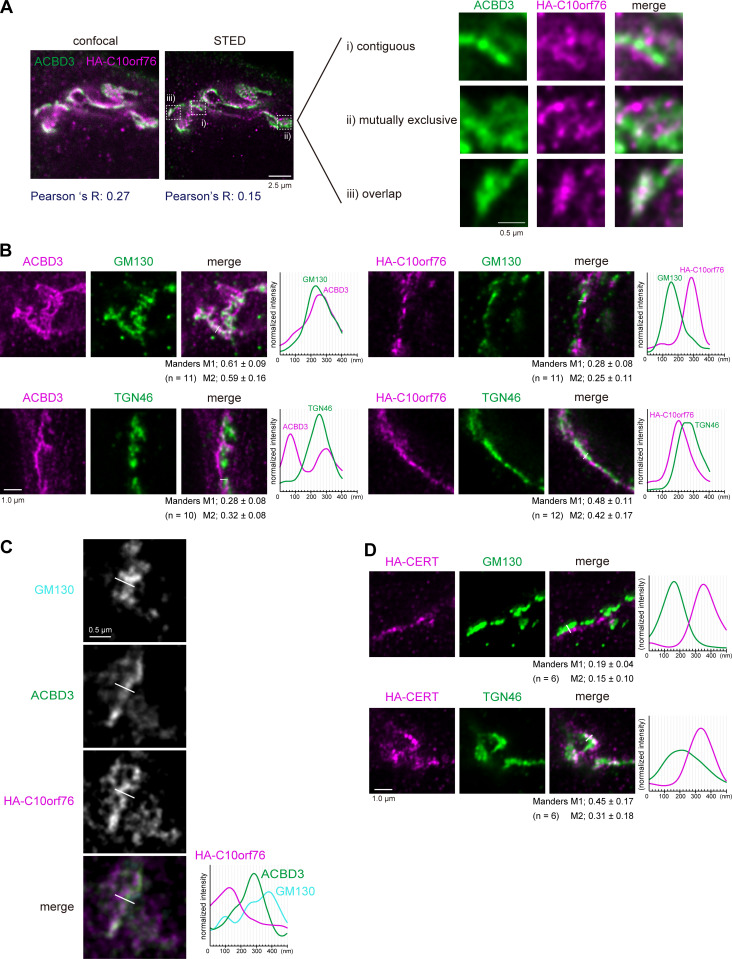
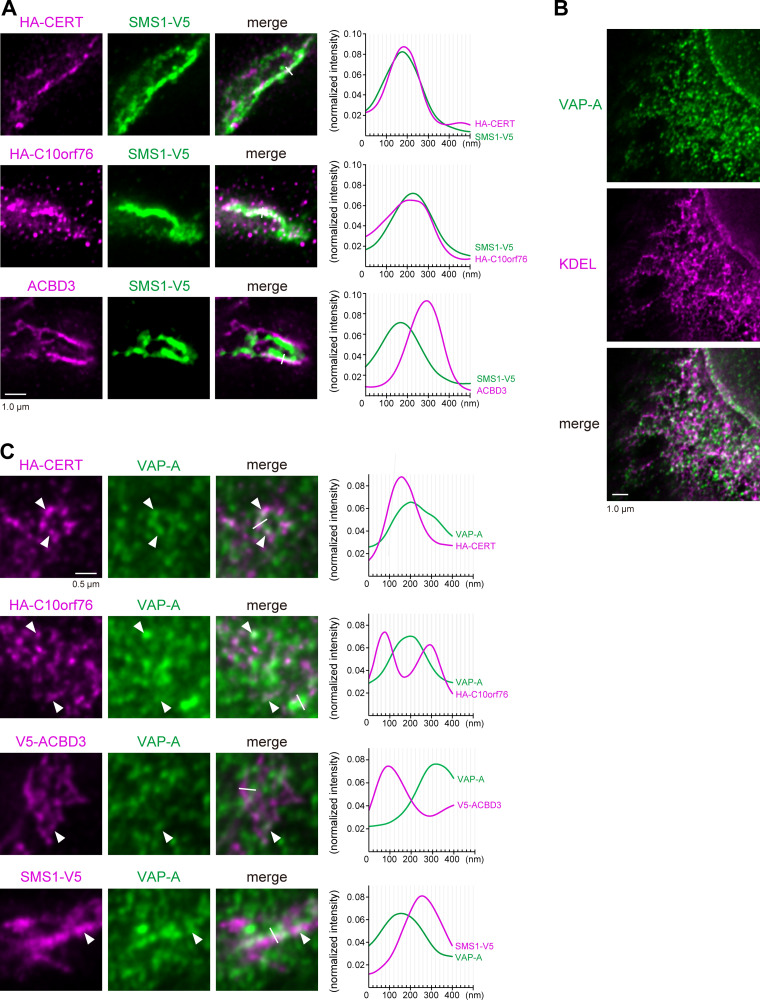
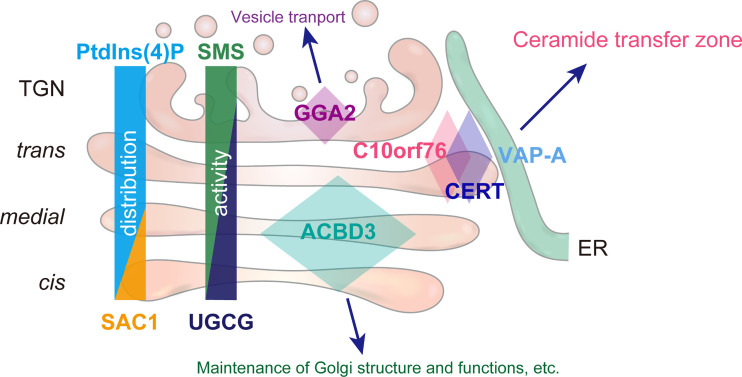
Phosphatidylinositol 4-monophosphate [PtdIns(4)P] is a precursor for various phosphoinositides but also a membrane-embedded component crucial for membrane contact sites (MCSs). Several lipid transfer proteins are recruited to MCSs by recognizing PtdIns(4)P; however, it remains poorly elucidated how the production of PtdIns(4)P for lipid transport at MCSs is regulated. Following human genome-wide screening, we discovered that the PtdIns(4)P-related genes PI4KB, ACBD3, and C10orf76 are involved in endoplasmic reticulum-to-Golgi trafficking of ceramide by the ceramide transport protein CERT. CERT preferentially utilizes PtdIns(4)P generated by PI4KB recruited to the Golgi by C10orf76 rather than by ACBD3. Super-resolution microscopy observation revealed that C10orf76 predominantly localizes at distal Golgi regions, where sphingomyelin (SM) synthesis primarily occurs, while the majority of ACBD3 localizes at more proximal regions. This study provides a proof-of-concept that distinct pools of PtdIns(4)P are generated in different subregions, even within the same organelle, to facilitate interorganelle metabolic channeling for the ceramide-to-SM conversion.


Conflict of interest statement

Disclosures: The authors declare no competing interests exist.

Figures

Figure 1.
Figure 1.
Identification of genes conferring lysenin resistance by disruption. (A) Pathways involved in de novo SM synthesis. Lysenin binds to SM in the PM and forms a pore, thereby causing cytotoxicity. SPT, serine palmitoyltransferase; KDSR, 3-ketodihydrosphingosine reductase; CerS, ceramide synthase; DES, sphingolipid Δ(4)-desaturase; SMS, SM synthase; UGCG, UDP-glucose ceramide glucosyltransferase (or GlcCer synthase). (B) Scheme of genome-wide KO screening of lysenin-resistant genes. Two independent pools of lentivirus-based GeCKO v2 pooled libraries, each of which were composed of two-half libraries, A and B (resulting in four independent pools, A-1, A-2, B-1, and B-2), were used for the screening. A heatmap composed of sgRNAs of 93 candidate genes is shown. (C) Heatmaps of genes involved in the pathways of de novo SM synthesis and Golgi-PtdIns(4)P metabolism are shown. Genes identified in the screening are shown in magenta. (B and C) Heatmaps represent the fold-enrichment of normalized read numbers of six sgRNAs of each gene in two independent experiments. See also Table S1 and Fig. S1 for other genes. (D) Domains and interaction partners of PI4KB, ACBD3, and C10orf76. Numbers represent the amino acid number counted from the initial methionine (the most typical isoforms expressed in HeLa cells are shown). Regions involved in interactions with proteins or ligands are shown in the upper, colored lines. ACB, acyl-CoA binding; GOLD, Golgi dynamics; DUF, domain of unknown function.
Figure S1.
Figure S1.
Identification of genes conferring lysenin resistance by disruption. Heatmaps of representative genes involved in lipid metabolism and membrane traffic are shown. Heatmaps depict the fold-enrichment of normalized read numbers of six sgRNAs of each gene in two independent experiments. Genes enriched during the screening are highlighted in color: magenta represents genes for which sgRNAs were enriched in both the A and B libraries, and orange represents those enriched in just one of the libraries.
Figure S2.
Figure S2.
Establishment of the KO cell clones and lipidomic analysis. (A) Sequence analysis of genomic DNA derived from genome-edited clones. (B) Confirmation of KO by Western blot analysis. Cell lysates were immunoblotted with anti-PI4KB, anti-ACBD3, anti-C10orf76, or anti-GAPDH antibodies. *, degradation product. (C and D) Lipidomic analysis of the KO cells (supplemental information for Fig. 2 C). Lipids were extracted from cells subcultured in FBS-free medium and analyzed by LC–MS/MS. The bar graph represents the mean ± SEM of three independent experiments. Statistical significance was determined by two-sided Dunnett test. *, P < 0.05. (D) The molecular species of SM was unaltered by gene disruption. Source data are available for this figure: SourceData FS2.
Figure 2.
Figure 2.
Disruption of PI4KB, ACBD3, or C10orf76 downregulates SM synthesis. (A) Gene disruption of PI4KB, ACBD3, and C10orf76 confers lysenin resistance to HeLa cells. (B) Stable expression of N-terminally tagged recombinant proteins reverses the lysenin resistance in each of the KO cell lines. (A and B) Overnight cultured cells were treated with lysenin at 50 (A) or 100 (B) ng/ml for 2 h. Viability was estimated via a colorimetric assay using water-soluble formazan dye and is shown as the percentage of the A450 nm value in the absence of lysenin. The bar graph represents the mean ± SEM of three biological replicates. Representative data from at least two independent experiments with similar results are shown. (C) The content of cellular SM is decreased in PI4KB KO and ACBD3/C10orf76 DKO cells. Lipids were extracted from cells subcultured in serum-free medium then analyzed by LC–MS. The bar graph represents the mean ± SEM of three independent experiments. See also Fig. S2. (See Tables S2 and S3 for the raw data sets.) (D) De novo SM synthesis was defective in the KO cell lines. Overnight cultured cells pretreated with mock or 1 μg/ml BFA for 30 min were metabolically labeled with L-[14C(U)]-serine for 8 h. Lipids were extracted from cell lysates (with the equal protein amounts among the samples) and separated using TLC. The intensity of autoradiography of labeled SM was analyzed using ImageJ, with the intensity of parent cells set to 100%. The bar graph represents the mean ± SEM of three independent experiments. A representative autoradiography image of the TLC plates is shown. (A–D) * and † represent statistically significant differences between the KO cells and the parent cells, or between samples linked with black lines, respectively. * and †, P < 0.05; ** and ††, P < 0.005; *** and †††, P < 0.0005. Statistical analysis of A, C, and D were performed by one-sided Dunnett test. Tukey-Kramer test was used for B. (E) Analysis of intracellular trafficking of C5-DMB-ceramide. Cells were labeled with C5-DMB-ceramide complexed with BSA for 30 min at 4°C and chased for 10 min at 37°C. Fixed cells were subjected to fluorescence microscopy observation. Graphs represent the mean ± SD of line profiles of the perinucleus regions of interest (ROIs, depicted by white arrows), calculated from n > 25 cells in at least three images. Data are representative of at least two independent experiments with similar results. Scale bar, 10 μm.
Figure 3.
Figure 3.
Recruitment of CERT to the Golgi apparatus is impaired in PI4KB KO and ACBD3/C10orf76 DKO cells. (A) Western blot analysis of the phosphorylation state of endogenous CERT. Cell lysates were immunoblotted with anti-CERT or anti-GAPDH antibodies. CERT displayed a doublet pattern that represents a hyperphosphorylated upper band (i.e., the inactive form) and a de- or hypophosphorylated lower band (i.e., the active form). The intensities of the upper and lower bands of CERT were quantified, and the ratio was calculated by dividing the intensity of the lower bands by the sum of the upper and lower bands (left panel). To compare the relative expression levels of CERT between different cell types, the total intensity of the upper and lower bands was normalized by the intensity of GAPDH as the loading control (right panel). The graphs represent the mean ± SEM of three biological replicates. Statistical significance was determined by two-sided Dunnett test *, P < 0.05; **, P < 0.005. n.s., not significant. (B) Microscopic observation of the intracellular distribution of CERT-mVenus. Cells stably expressing CERT-mVenus were cultured in the presence or absence of 2.5 μM myriocin for 24 h. Fixed cells were then immunostained with an anti-GM130 antibody. (C) Image analysis of B. Data are representative of at least two independent experiments with similar results. The dots represent the Pearson’s correlation coefficient between CERT-mVenus and the Golgi marker GM130 of one cell (n = 23–28), calculated from at least three images. The line segments represent the median. Orange, myriocin untreated; light blue, myriocin treated. Statistical differences, determined by Steel-Dwass test, between the parent and KO cells in each of the myriocin-treated and untreated conditions are shown. *, P < 0.05; ***, P < 0.0005. n.s., not significant. (D) Microscopic observation of CERT-mVenus puncta in the KO cells. Cells stably expressing CERT-mVenus were treated with 2.5 μM myriocin for 24 h. Fixed cells were then immunostained with an anti-VAP-A antibody. Magnified views of the white-dashed boxes are shown. (B and D) Nuclei were visualized by staining with DAPI. Scale bars, 10 μm. Source data are available for this figure: SourceData F3.
Figure S3.
Figure S3.
The expression levels of recombinant proteins expressed in the KO cells are similar to those in the parent cells. (A) Western blot analysis of the endogenous CERT and ectopic CERT-mVenus expressed in various cells treated with or without the sphingolipid synthesis inhibitor myriocin. Cells stably expressing CERT-mVenus were cultured with or without 2.5 μM myriocin for 24 h. Cell lysates were immunoblotted with anti-CERT or anti-GAPDH antibodies. Statistical significance was determined by two-sided Dunnett test. *, P < 0.05, **, P < 0.01. (B) Western blot analysis of FLAG-PI4KB stably expressed in various cells. Cell lysates were immunoblotted with anti-FLAG or anti-GAPDH antibodies. Statistical significance was determined by two-sided Dunnett test. n.s., not significant. Source data are available for this figure: SourceData FS3.
Figure 4.
Figure 4.
PI4KB requires either ACBD3 or C10orf76 for its recruitment to the Golgi apparatus. (A) Western blot analysis of the abundance of endogenous PI4KB. Cell lysates were immunoblotted with anti-PI4KB or anti-GAPDH antibodies. The graph represents the mean ± SEM (three biological replicates) of the band intensity of PI4KB, which was normalized by that of the loading control GAPDH. Statistical significance was determined by two-sided Dunnett test. n.s., not significant. (B) Microscopic observation of FLAG-PI4KB recruitment to the Golgi apparatus. Cells stably expressing FLAG-PI4KB were treated with 0 or 2 μM PIK93 for 4 h. Fixed cells were then immunostained with anti-FLAG and anti-GM130 antibodies. (C) Image analysis of B. Data are representative of two independent experiments with similar results. The dots represent the Pearson’s correlation coefficient between FLAG-PI4KB and the Golgi marker GM130 in one cell (n = 24–36), calculated from at least three images. The line segments represent the median. Orange, without PIK93; light blue, PIK93-treated. Statistical differences, determined by Steel-Dwass test, between the parent and KO cells in each of the PIK93-treated and untreated conditions are shown. *, P < 0.05; **, P < 0.005; ***, P < 0.0005. (D) Analysis of PtdIns(4)P pools in the Golgi apparatus. Fixed cells were immunostained with anti-PtdIns(4)P and anti-GM130 antibodies. The dots represent the intensity of Golgi-PtdIns(4)P normalized by the Golgi area in one cell (n = 23–30), calculated from at least three images. Data are representative of two independent experiments with similar results. The blue line segments represent the median. Statistical significance was determined by Steel-Dwass test. ***, P < 0.0005. n.s., not significant. (B and C) Nuclei were visualized by staining with DAPI. Scale bars, 10 μm. Source data are available for this figure: SourceData F4.
Figure S4.
Figure S4.
Only a portion of CERT colocalizes with C10orf76. (A) Microscopic observation of the intracellular distribution of HA-C10orf76 in KO cells. Cells stably expressing HA-C10orf76 were fixed and immunostained with anti-HA and anti-GM130 antibodies. Nuclei were visualized with DAPI. Scale bar, 10 μm. The Pearson’s correlation coefficients between HA-C10orf76 and the Golgi marker GM130 in one cell (n = 24–41), calculated from at least three images, are shown on the right. The line segments represent the median. Statistical significance was determined by Steel-Dwass test. n.s., not significant. Representative data from at least two independent experiments with similar results are shown. (B) STED microscopic observation of cis-Golgi (marked by GM130) and the TGN (marked by TGN46). Fixed cells were immunostained with anti-GM130 and anti-TGN46 antibodies. (C) STED microscopic observation of the intra-Golgi distribution patterns of SMS1-V5. Cells stably expressing SMS1-V5 were fixed and immunostained with anti-V5 + anti-GM130 antibodies or anti-V5 + anti-TGN46 antibodies. Graphs represent the line profiles of regions of interest (ROIs, depicted by white lines): x-axis, distance; y-axis, normalized signal intensity. (B and C) The mean ± SD of Manders correlation coefficient (MCC) and the cell numbers (n) analyzed are shown. MCC M1 represents the colocalization rate of the protein of interest with the marker protein. M2 represents the colocalization rate of the marker protein with the protein of interest. (D) The mean ± SD of MCC M1 from Fig. 5, B and D, and Fig. S4, B and C are shown. Dots represent the individual data points. Statistical differences between the marker protein (TGN46 or GM130) and the proteins of interest are shown. Statistical significance was determined by one-sided Dunnett test. ***, P < 0.001; n.s., not significant. (E) STED microscopic observation of HA-CERT and V5-C10orf76. (B, C, and E) Scale bars, 1.0 µm. (F) Co-immunoprecipitation analysis of CERT, C10orf76, and PI4KB. Cell lysates, prepared from cells stably expressing HA-C10orf76 or HA-CERT, were subjected to immunoprecipitation with anti-HA-agarose. The eluates were immunoblotted with anti-HA, anti-PI4KB, or anti-CERT antibodies. Source data are available for this figure: SourceData FS4.
Figure 5.
Figure 5.
ACBD3 and C10orf76 localize at distinct subregions in the Golgi apparatus. (A) STED microscopy observation of ACBD3 and HA-C10orf76. The C10orf76 KO cells stably expressing HA-C10orf76 were immunostained with anti-ACBD3 and anti-HA antibodies and imaged using confocal or super-resolution STED microscopy. (B) STED microscopic observation of the intra-Golgi distribution patterns of ACBD3 and C10orf76. ACBD3 and HA-C10orf76 were co-stained with a cis-Golgi marker, GM130, or a TGN marker, TGN46. (C) GM130, ACBD3, and HA-C10orf76 were co-stained and observed under STED microscopy. (D) STED microscopic observation of the intra-Golgi distribution patterns of HA-CERT. The CERT KO cells stably expressing HA-CERT were immunostained with anti-HA + anti-GM130 antibodies or anti-HA + anti-TGN46 antibodies and imaged using STED microscopy. (B–D) Graphs represent the line profiles of ROIs (depicted by white lines): x-axis, distance; y-axis, normalized signal intensities. Scale bars, 1.0 µm. (B and D) The mean ± SD of Manders correlation coefficient (MCC) and the cell numbers (n) analyzed are shown. MCC M1 represents the colocalization rate of the protein of interest with the marker protein. M2 represents the colocalization rate of the marker protein with the protein of interest. Source data are available for this figure: SourceData F5.
Figure 6.
Figure 6.
C10orf76 marks the ER–Golgi ceramide transport zones. (A) STED microscopic observation of the SMS1-positive Golgi stacks. The CERT KO cells stably expressing HA-CERT and SMS1-V5 or C10orf76 KO cells stably expressing HA-C10orf76 and SMS1-V5 were fixed and immunostained with anti-ACBD3 + anti-V5 antibodies or anti-HA + anti-V5 antibodies and imaged using STED microscopy. Scale bar, 1.0 µm. (B) STED microscopic observation of the intra-ER distribution pattern of VAP-A. HeLa cells were fixed and immunostained with anti-KDEL and anti-VAP-A antibodies and imaged using STED microscopy. Scale bar, 1.0 µm. (C) STED microscopic observation of ER–Golgi-associated subregions. Cells were fixed and immunostained with anti-HA + anti-VAP-A antibodies or anti-V5 + anti-VAP-A antibodies and imaged using STED microscopy. Arrowheads indicate the overlapping regions. Scale bar, 0.5 µm. (A and C) Graphs represent the line profiles of ROIs (depicted by white lines): x-axis, distance; y-axis, normalized signal intensities. Source data are available for this figure: SourceData F6.
Figure 7.
Figure 7.
The C10orf76PI4KB axis orchestrates the CERT-mediated ceramide trafficking to the distal Golgi. PtdIns(4)P is distributed with a gradient in the Golgi complex, being higher at the distal side. PI4KB properly adopts several mechanisms to localize at distinct Golgi regions: ACBD3 is for localizing at the cis- and medial-cisternae, C10orf76 is for localizing at the limited regions within the trans-cisterna, and GGA2 is for localizing at the TGN. PtdIns(4)P pools generated at these sites should harbor distinctive properties. In addition, PI4K2A-dependent PtdIns(4)P pools are likely to be present at the TGN. Among the diverse PtdIns(4)P pools in the Golgi complex, CERT preferentially utilizes the PtdIns(4)P pools generated by PI4KB recruited by C10orf76. This system may act as an inter-organelle metabolic channeling mechanism for the efficient conversion of ceramide to SM. Under C10orf76-deficient conditions, ACBD3-dependent PtdIns(4)P may partially compensate for the loss of C10orf76-dependent PtdIns(4)P. As ACBD3 is known to interact with a variety of proteins, ACBD3-dependent PtdIns(4)P pools may act as a scaffold for several zones that are involved in the maintenance of Golgi structure and functions. GGA2, as a clathrin adapter, likely produces PtdIns(4)P pools critical for vesicle transport.

Similar articles

Cited by

References

    1. Allan, D., and Obradors M.J.M.. 1999. Enzyme distributions in subcellular fractions of BHK cells infected with semliki forest virus: Evidence for a major fraction of sphingomyelin synthase in the trans-golgi network. Biochim. Biophys. Acta. 1450:277–287. 10.1016/S0167-4889(99)00057-9 - DOI - PubMed
    1. Alli-Balogun, G.O., and Levine T.P.. 2019. Regulation of targeting determinants in interorganelle communication. Curr. Opin. Cell Biol. 57:106–114. 10.1016/j.ceb.2018.12.010 - DOI - PubMed
    1. Almeida, C., and Amaral M.D.. 2020. A central role of the endoplasmic reticulum in the cell emerges from its functional contact sites with multiple organelles. Cell. Mol. Life Sci. 77:4729–4745. 10.1007/s00018-020-03523-w - DOI - PMC - PubMed
    1. Arita, M. 2019. Essential domains of phosphatidylinositol-4 kinase III β required for enterovirus replication. Microbiol. Immunol. 63:285–288. 10.1111/1348-0421.12718 - DOI - PubMed
    1. Balla, A., Tuymetova G., Barshishat M., Geiszt M., and Balla T.. 2002. Characterization of type II phosphatidylinositol 4-kinase isoforms reveals association of the enzymes with endosomal vesicular compartments. J. Biol. Chem. 277:20041–20050. 10.1074/jbc.M111807200 - DOI - PubMed

Publication types

MeSH terms